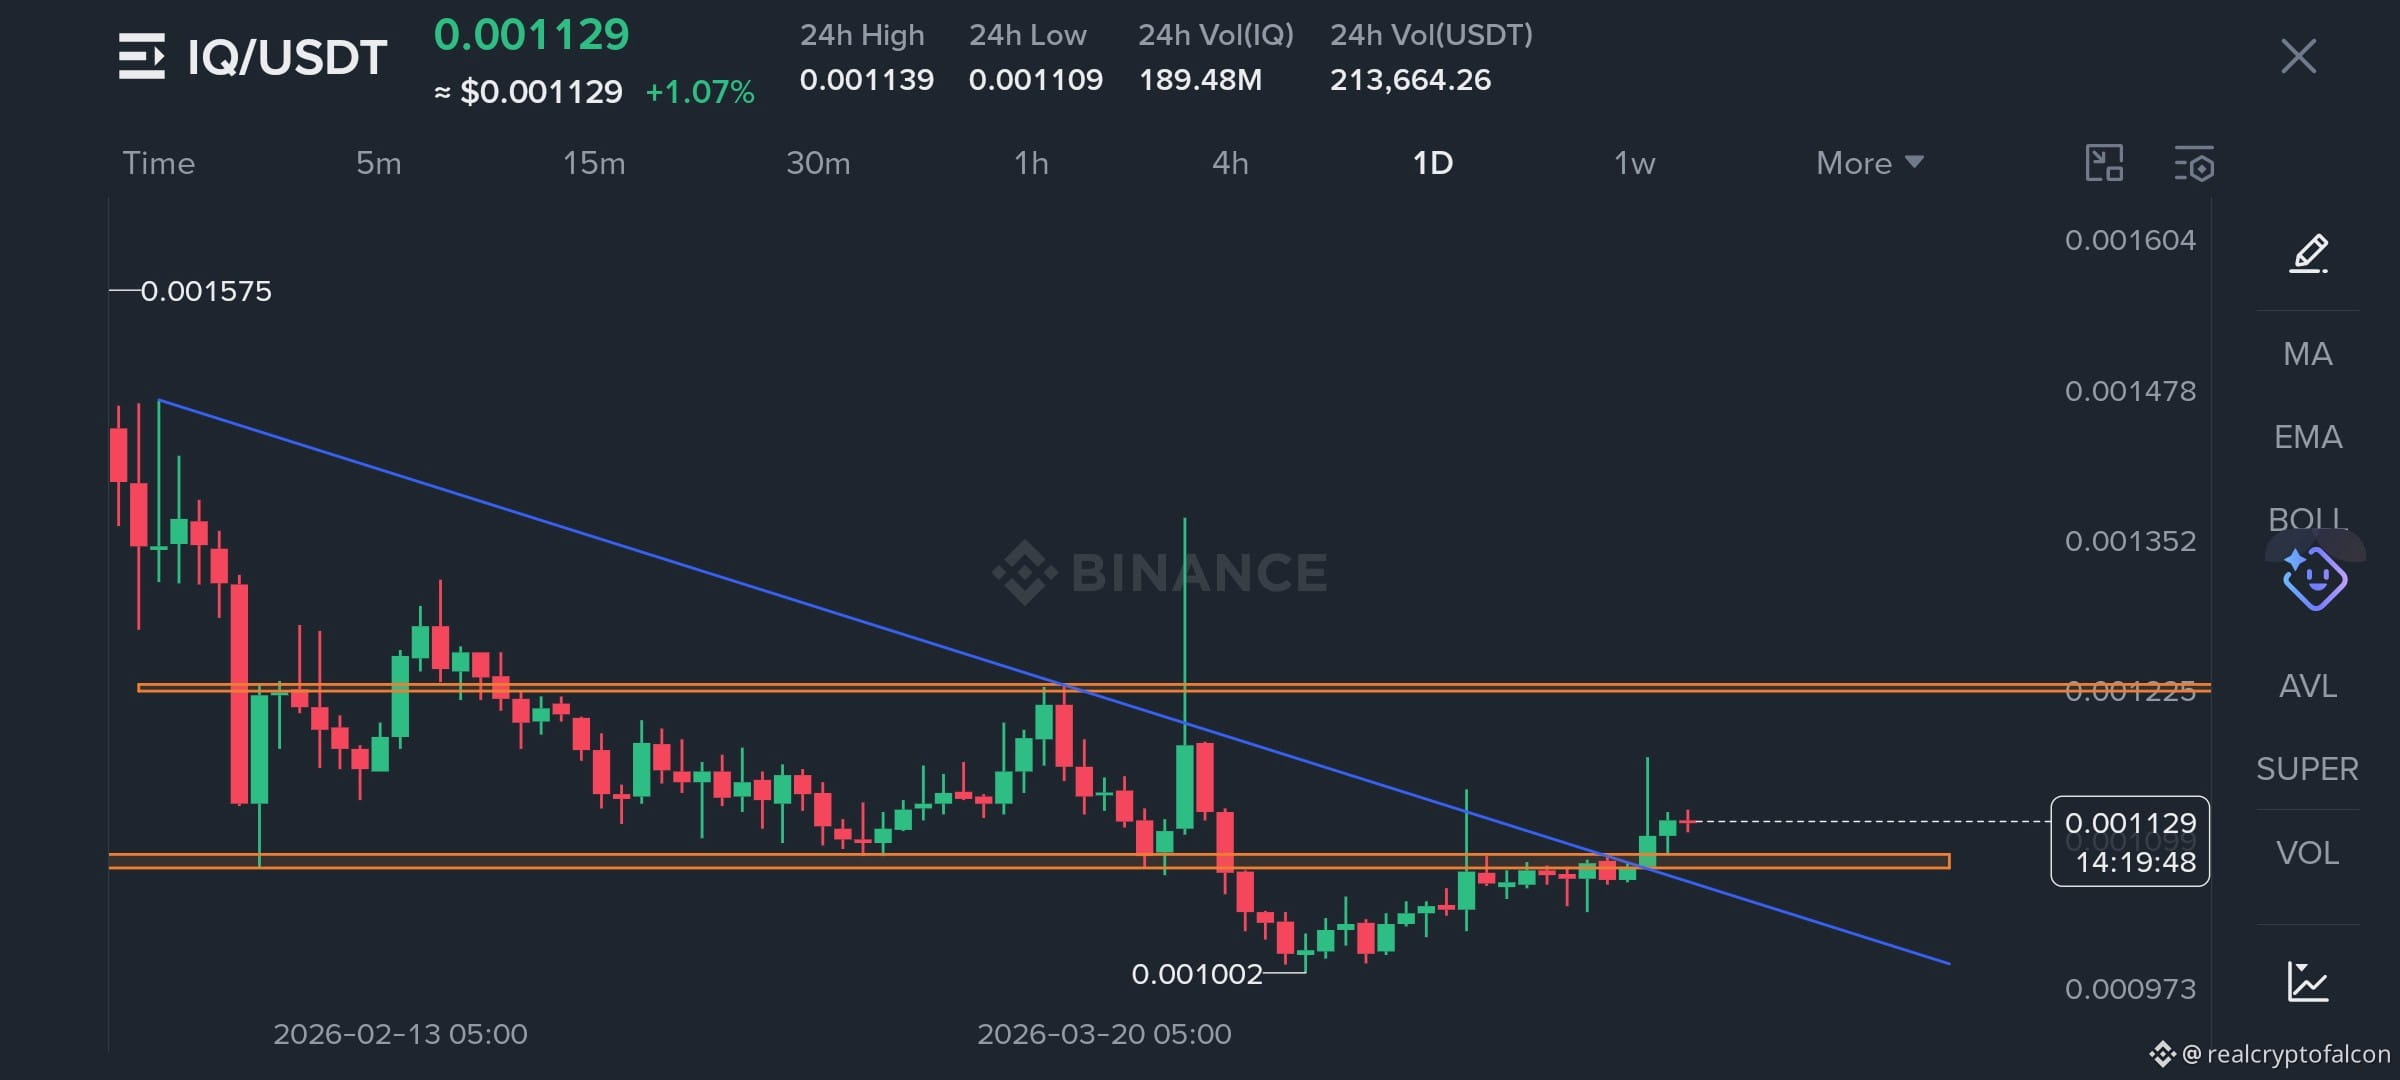
$IQ IQ/USDT Daily Timeframe 📈
Bullish Breakout & Trend Reversal Confirmed!
The daily chart for $IQ is showing strong bullish momentum after a period of consolidation. We have witnessed two major technical developments that signal a potential price rally:
Macro Trendline Breakout: The long-standing descending blue trendline, which has been acting as a major resistance, has finally been breached. This indicates that the previous downtrend is losing grip and buyers are taking control.
Resistance-to-Support Flip: Price has successfully broken above a key horizontal resistance zone (micro flip) and, more importantly, managed a daily candle close above it. This confirms the area as new support.
Price Targets & Outlook 🎯
With the current breakout and solid daily closing, the path toward the upper resistance levels looks clear. If the momentum sustains:
Immediate Target: Testing the next major resistance zone around the 0.001225 area.
Support: The breakout zone now acts as a strong cushion for any minor retests.
Conclusion: The structure has shifted from bearish to bullish. Keep a close eye on the volume as price approaches the next overhead resistance.$IQ
Bullish Breakout & Trend Reversal Confirmed!
The daily chart for $IQ is showing strong bullish momentum after a period of consolidation. We have witnessed two major technical developments that signal a potential price rally:
Macro Trendline Breakout: The long-standing descending blue trendline, which has been acting as a major resistance, has finally been breached. This indicates that the previous downtrend is losing grip and buyers are taking control.
Resistance-to-Support Flip: Price has successfully broken above a key horizontal resistance zone (micro flip) and, more importantly, managed a daily candle close above it. This confirms the area as new support.
Price Targets & Outlook 🎯
With the current breakout and solid daily closing, the path toward the upper resistance levels looks clear. If the momentum sustains:
Immediate Target: Testing the next major resistance zone around the 0.001225 area.
Support: The breakout zone now acts as a strong cushion for any minor retests.
Conclusion: The structure has shifted from bearish to bullish. Keep a close eye on the volume as price approaches the next overhead resistance.$IQ