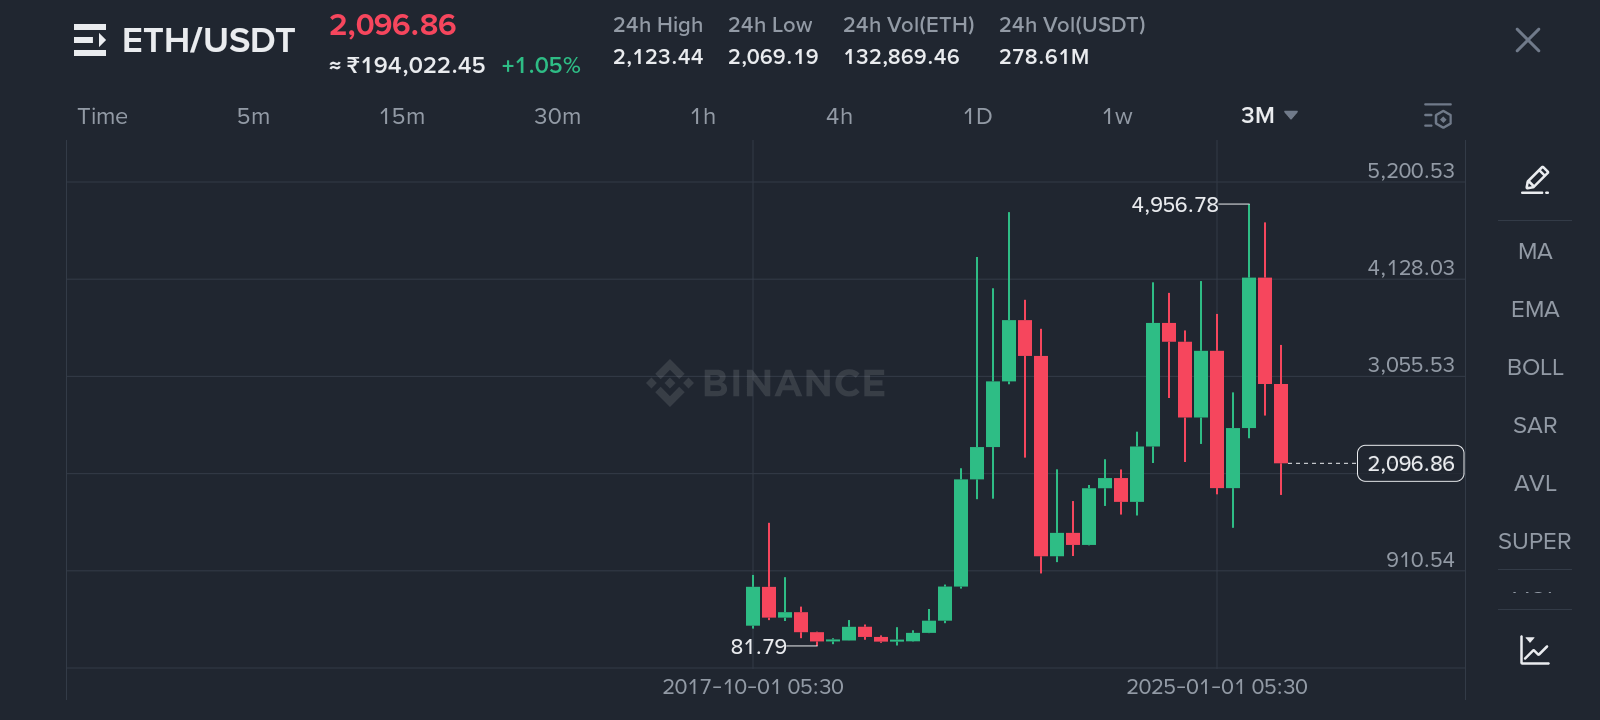
As of March 15, 2026 (around 6-7 PM IST), Ethereum ($ETH ) is trading at approximately $2,110–$2,120 USD, showing a positive day with gains of about 1-2% in the last 24 hours (based on sources like Yahoo Finance, Investing.com, CoinDesk, and others reporting closes/opens around $2,096–$2,118 with highs near $2,122).
1-Month Performance Overview (mid-February to mid-March 2026)
From around February 15, 2026 (when ETH was in the $1,966–$2,085 range, with closes often near $1,966–$1,997), to now:
$ETH experienced volatility but has shown a net upward trend in recent weeks.
It dipped into the low $1,900s (e.g., late February around $1,930–$1,965) and saw some pressure in early March.
From early March (around $1,939–$1,982 on March 1–2), it recovered strongly, climbing steadily through the $2,000–$2,100 zone.
Over the last 30 days, ETH has gained roughly 7–10% overall (from mid-February lows ~$1,930–$2,000 to current ~$2,110+ levels), with stronger momentum in the past 10–14 days.
Recent daily closes/movements:
March 15: ~$2,112–$2,118 (up ~1–2%)
March 14: ~$2,097
March 13: ~$2,092 (high of ~$2,206 intraday)
March 12: ~$2,073
March 11: ~$2,051
Earlier March: Dips to ~$1,930–$2,000 range before rebound.
This marks a recovery phase after a broader downtrend from 2025 highs (ETH peaked near $4,955 in August 2025 but has been down significantly since, trading in the $2,000 zone recently with oversold signals and whale accumulation noted in some analyses).
Key Insights and Context
Bullish factors recently: Steady gains in mid-March, neutral-to-positive technical indicators (e.g., RSI around neutral), and high trading volume on up days (e.g., spikes over $20–$29B on volatile sessions).
Market sentiment: ETH remains far from its 2025 ATH but shows signs of stabilization around $2,000 support, with resistance tested near $2,100–$2,200. Some forecasts for March 2026 suggested averages around $2,200–$2,300, and it's aligning with that recovery path.
Volatility note: Crypto prices fluctuate rapidly—24h volumes are in billions, and intraday swings of 2–5% are common.
For real-time charts or deeper technicals, check platforms like CoinMarketCap, TradingView, or Yahoo Finance. This is not financial advice—always DYOR and consider market risks! If you want visuals or more specific dates, let me know.