

612 Ceros
29.7k Publications

612 Ceros
 Compte Square Vérifié+
Signaler
Bloquer l’utilisateur
📊 Crypto strategist | Market signals daily | Trade smart, not emotional. Find me on X: @612Ceros
Ouvert au trading

Détenteur pour BNB
Trade fréquemment
5.1 an(s)
57 Suivis
180.2K+ Abonnés
229.4K+ J’aime
Publications
Portefeuille
Tous
Citations
Direct
·
--
Haussier
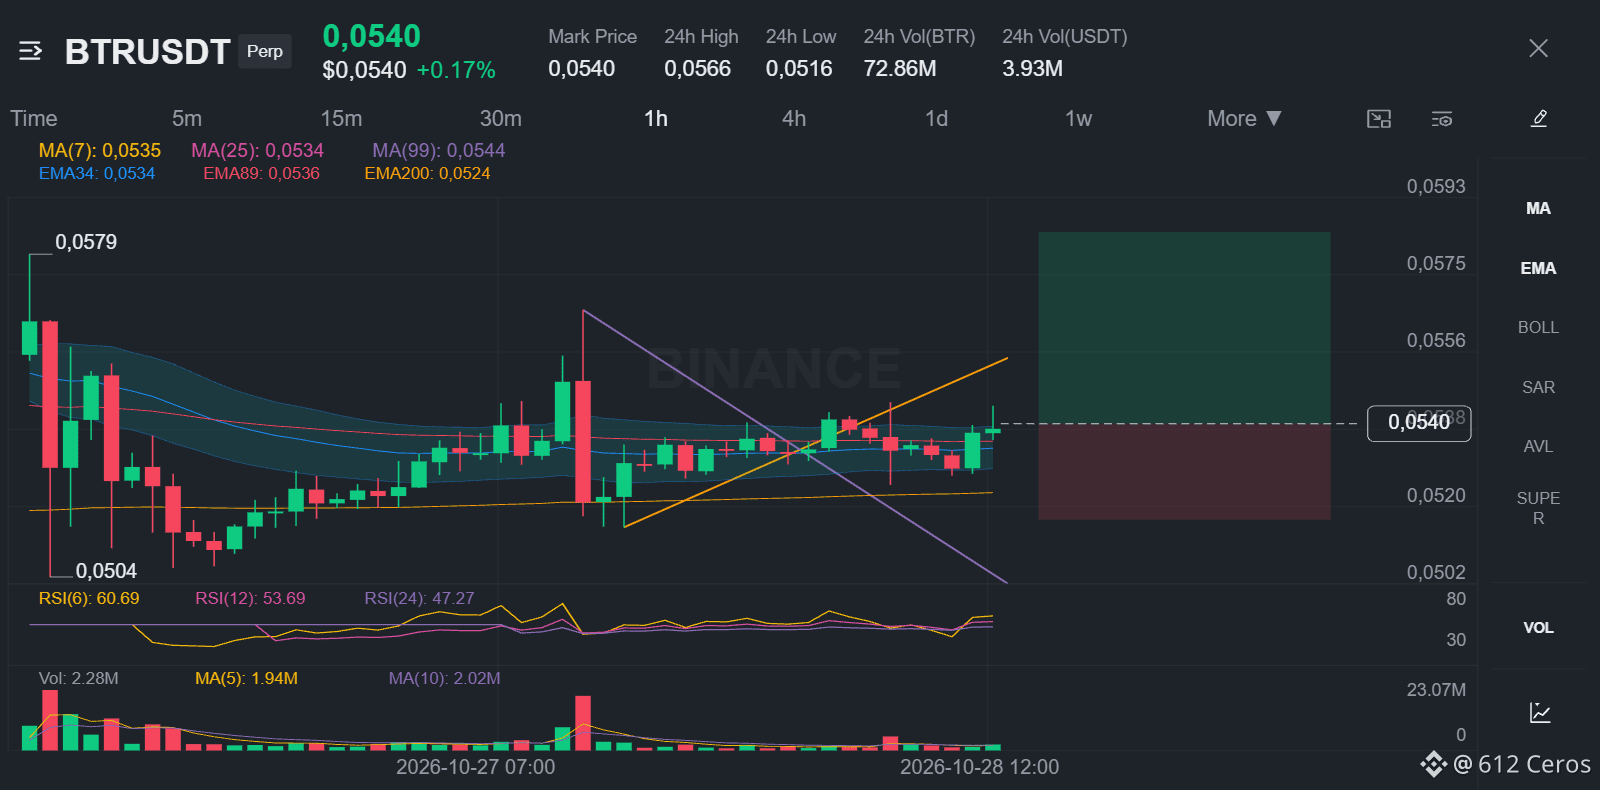
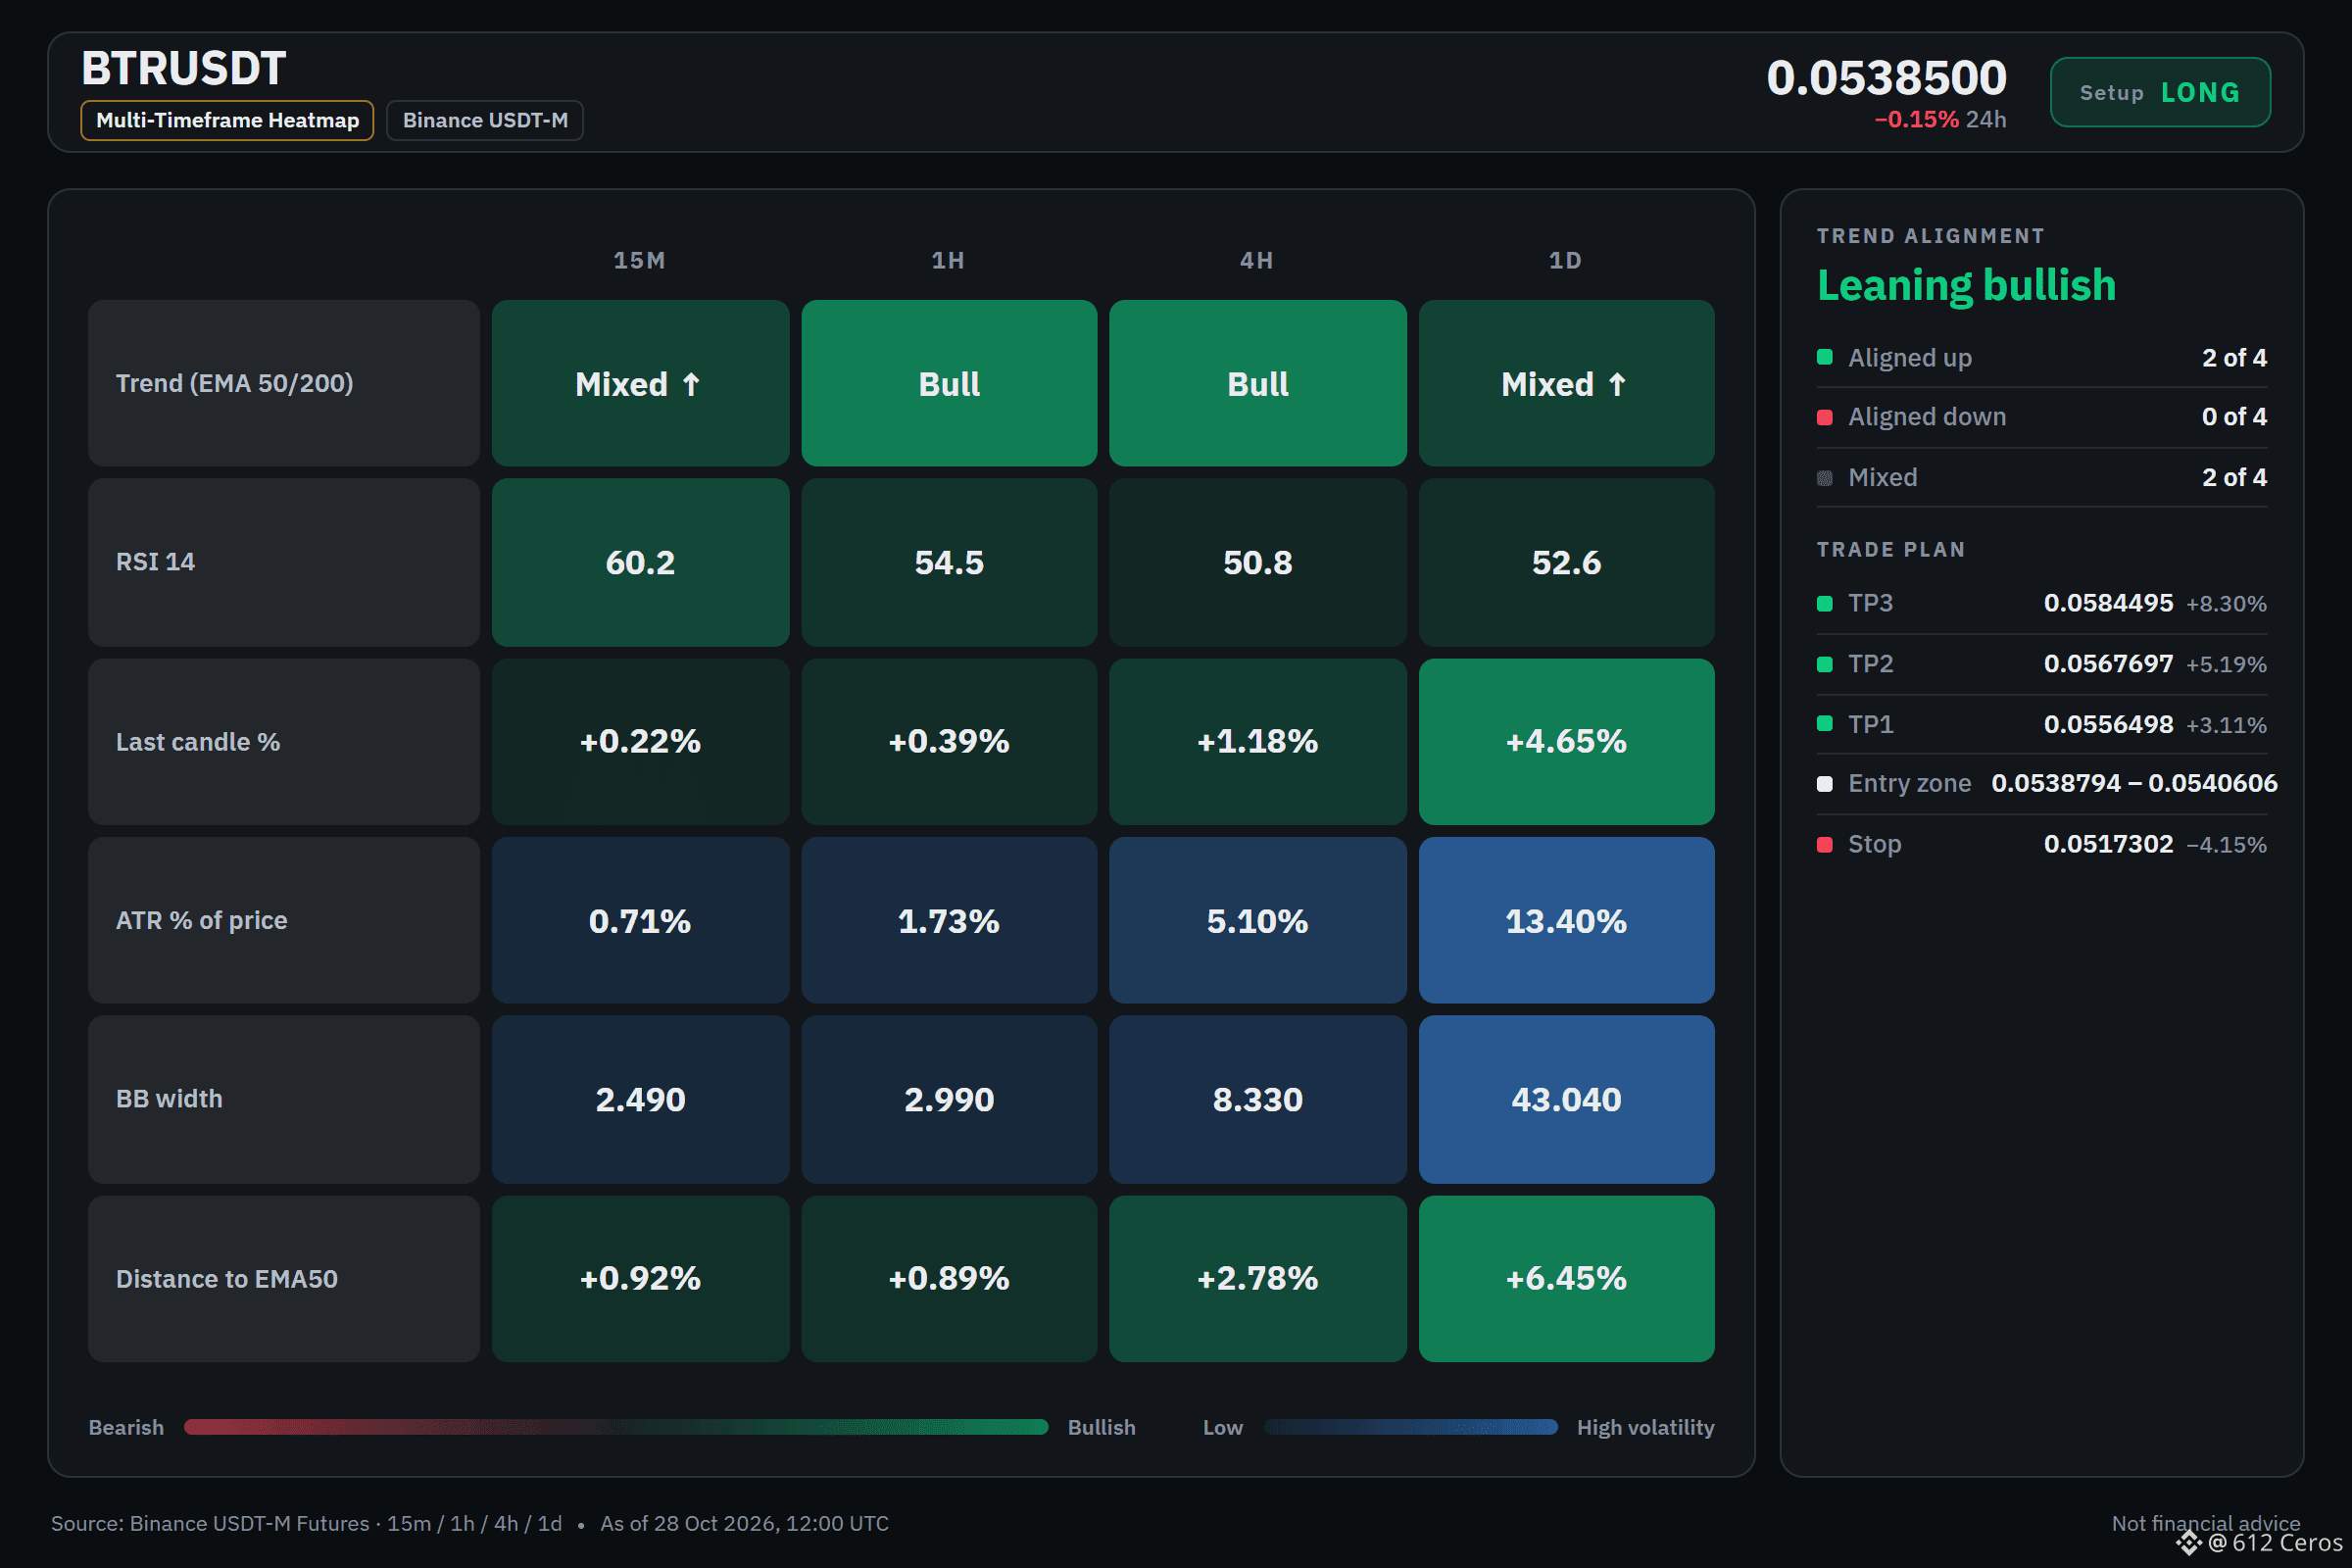
BTR is quietly stacking bullish on the 4h
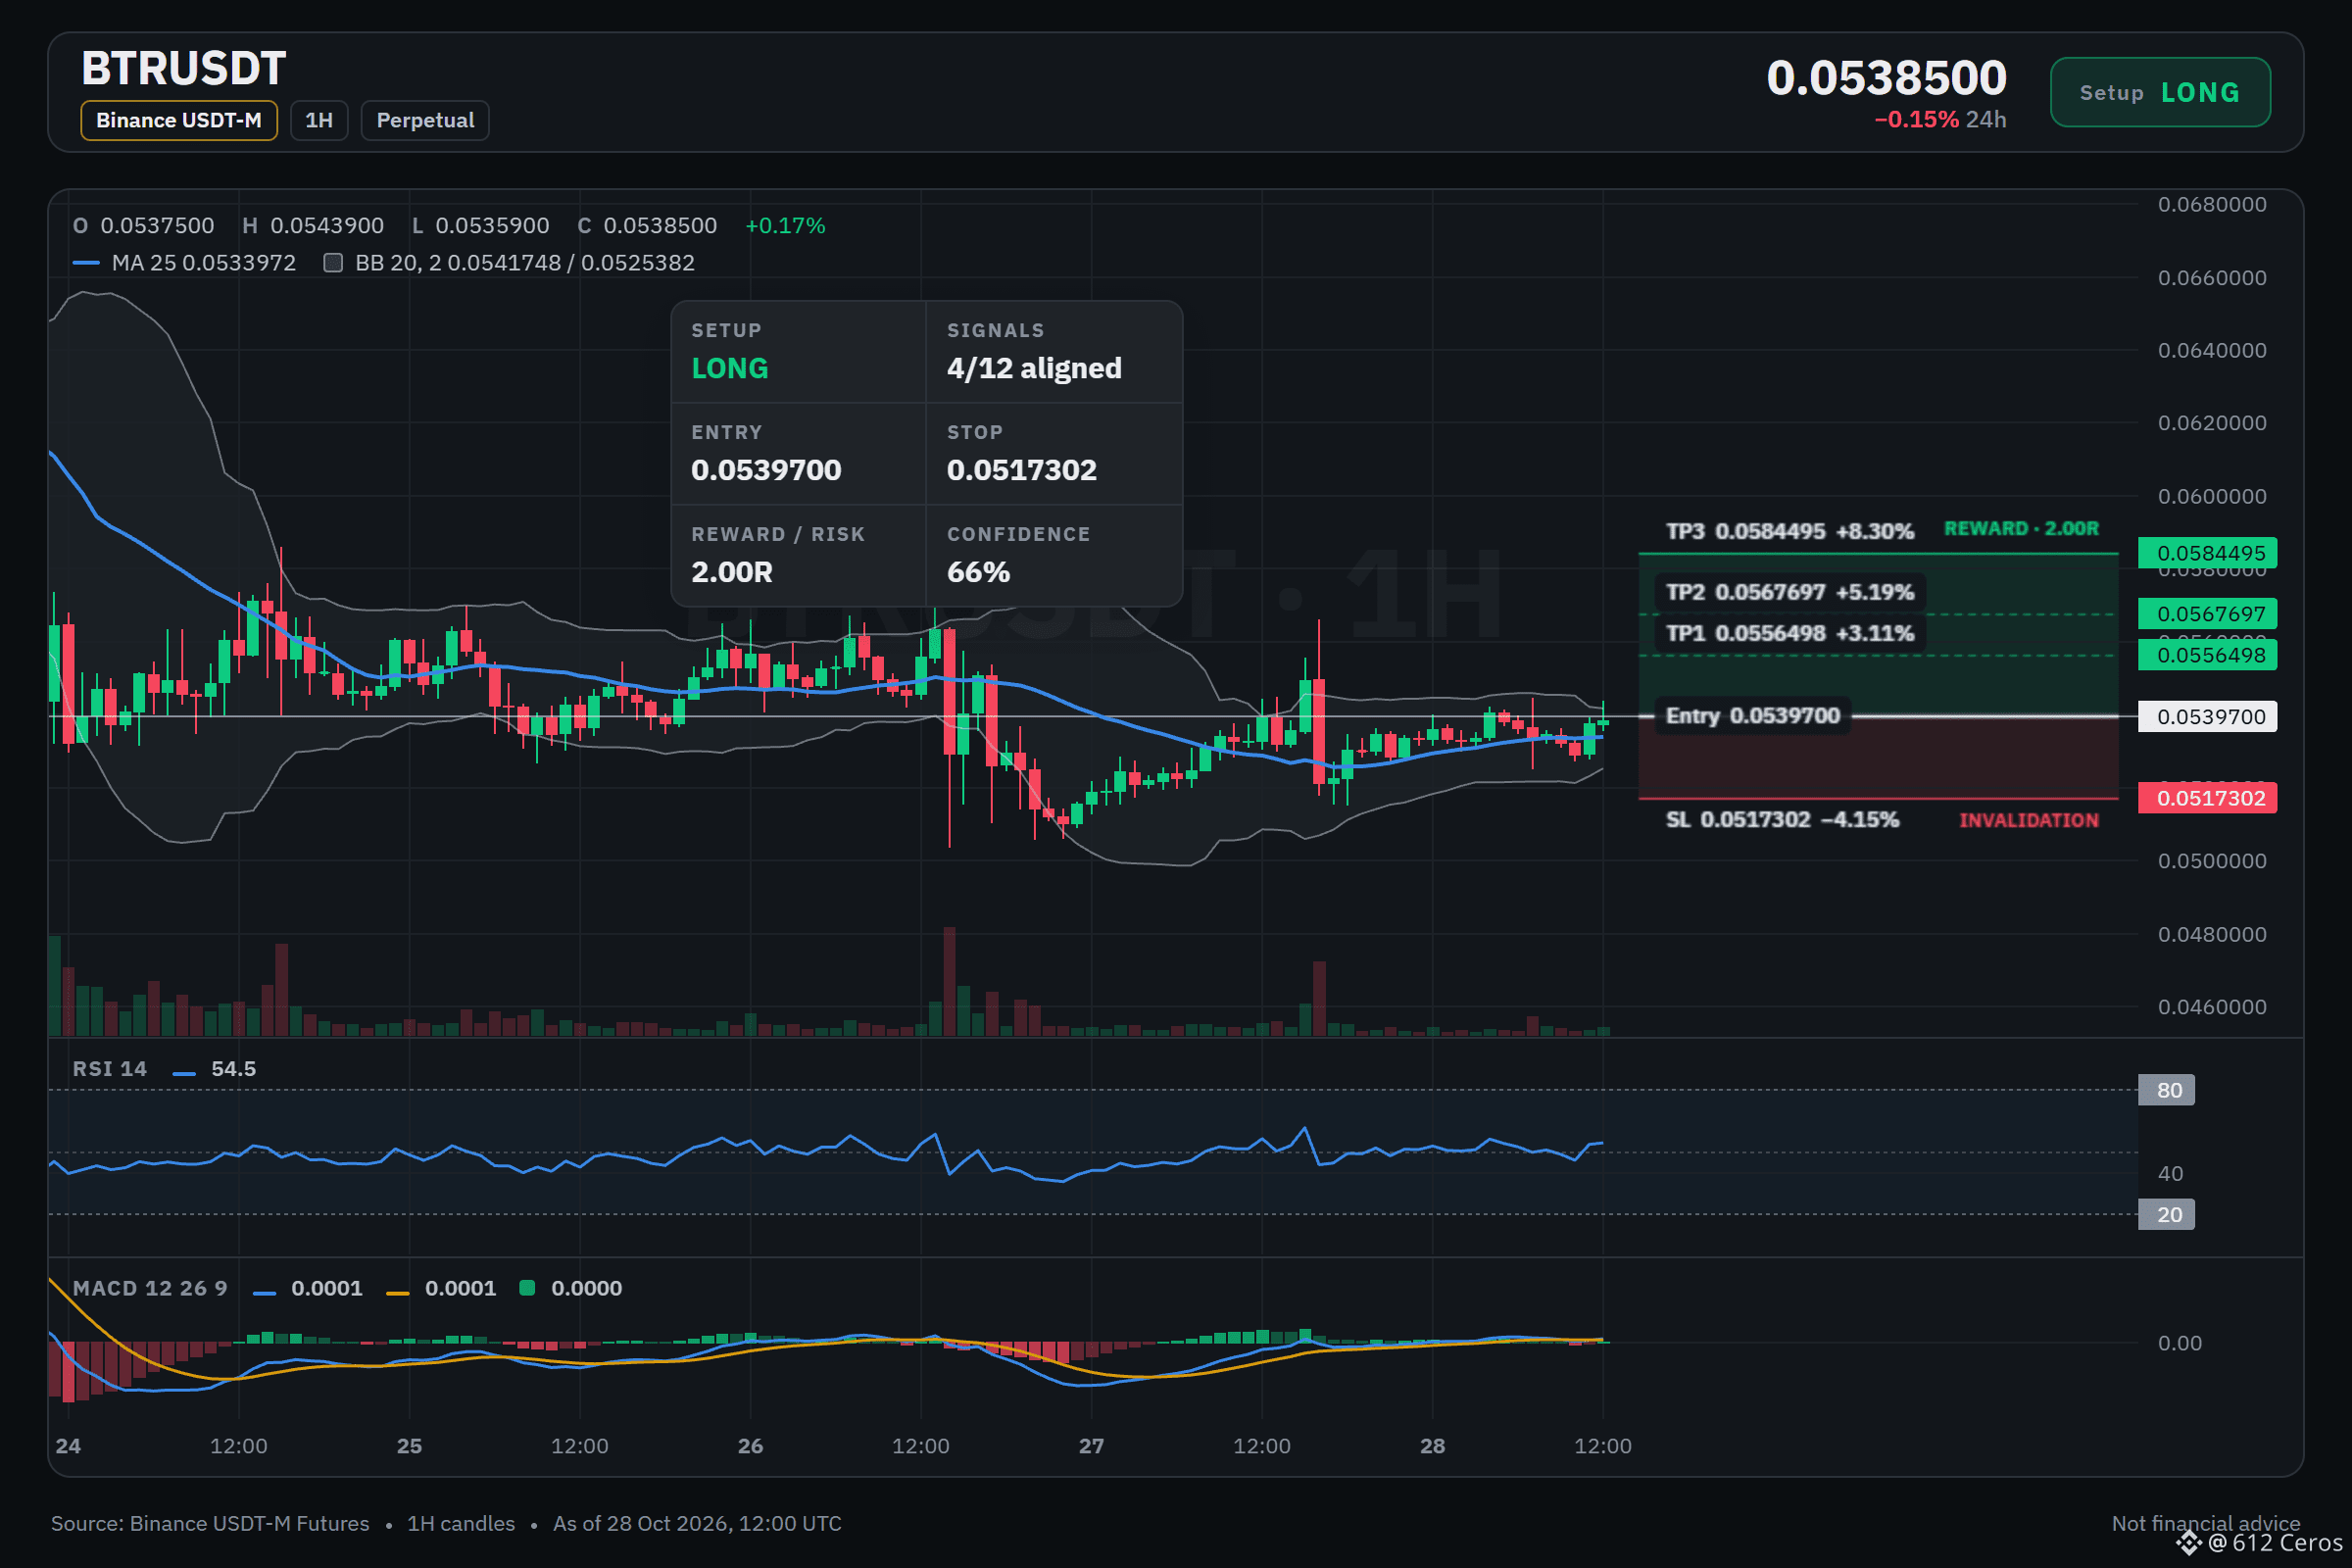
🟢 LONG $BTR /USDT: expecting price to go UP
Bias: LONG · Leaning
Entry: 0.0538794 – 0.0540606
TP1: 0.0556498 (+3.1%)
TP2: 0.0567697 (+5.2%)
TP3: 0.0584495 (+8.3%)
SL: 0.0517302 (-4.2%)
Plan: enter only inside the zone, close 50% at TP1, 25% at TP2, 25% at TP3, and move the stop to entry after TP1.
Note: moderate conviction only, keep size light.
Why LONG? BTR checklist: 4/12 agree, 0 against.
• 4h trend up (above EMA50 & EMA200)
• 1h trend up (above EMA50 & EMA200)
• Buyers are driving the move (15m ADX 24.8)
Watch: The idea is wrong if price reaches the stop at 0.0517302
Bottom line: The 4h bullish stack and 1h buyers pressing are the strongest support, but the daily trend is a range and conviction stays moderate.
Where do you see BTR stopping if this stack breaks?
Full setup on the chart below.
{future}(BTRUSDT)
📲 Want more of my latest signals? Join me here:
[https://app.binance.com/uni-qr/D26WbL9t](https://app.binance.com/uni-qr/D26WbL9t)
⚠️ Personal market analysis only. NFA — manage risk and DYOR.
Educational content, not investment advice or a recommendation to buy, sell, deposit, or withdraw any asset. No paid promotion or referral/affiliate links.
BTR is quietly stacking bullish on the 4h
🟢 LONG $BTR /USDT: expecting price to go UP
Bias: LONG · Leaning
Entry: 0.0538794 – 0.0540606
TP1: 0.0556498 (+3.1%)
TP2: 0.0567697 (+5.2%)
TP3: 0.0584495 (+8.3%)
SL: 0.0517302 (-4.2%)
Plan: enter only inside the zone, close 50% at TP1, 25% at TP2, 25% at TP3, and move the stop to entry after TP1.
Note: moderate conviction only, keep size light.
Why LONG? BTR checklist: 4/12 agree, 0 against.
• 4h trend up (above EMA50 & EMA200)
• 1h trend up (above EMA50 & EMA200)
• Buyers are driving the move (15m ADX 24.8)
Watch: The idea is wrong if price reaches the stop at 0.0517302
Bottom line: The 4h bullish stack and 1h buyers pressing are the strongest support, but the daily trend is a range and conviction stays moderate.
Where do you see BTR stopping if this stack breaks?
Full setup on the chart below.
📲 Want more of my latest signals? Join me here:
https://app.binance.com/uni-qr/D26WbL9t
⚠️ Personal market analysis only. NFA — manage risk and DYOR.
Educational content, not investment advice or a recommendation to buy, sell, deposit, or withdraw any asset. No paid promotion or referral/affiliate links.
6
·
--
Baissier
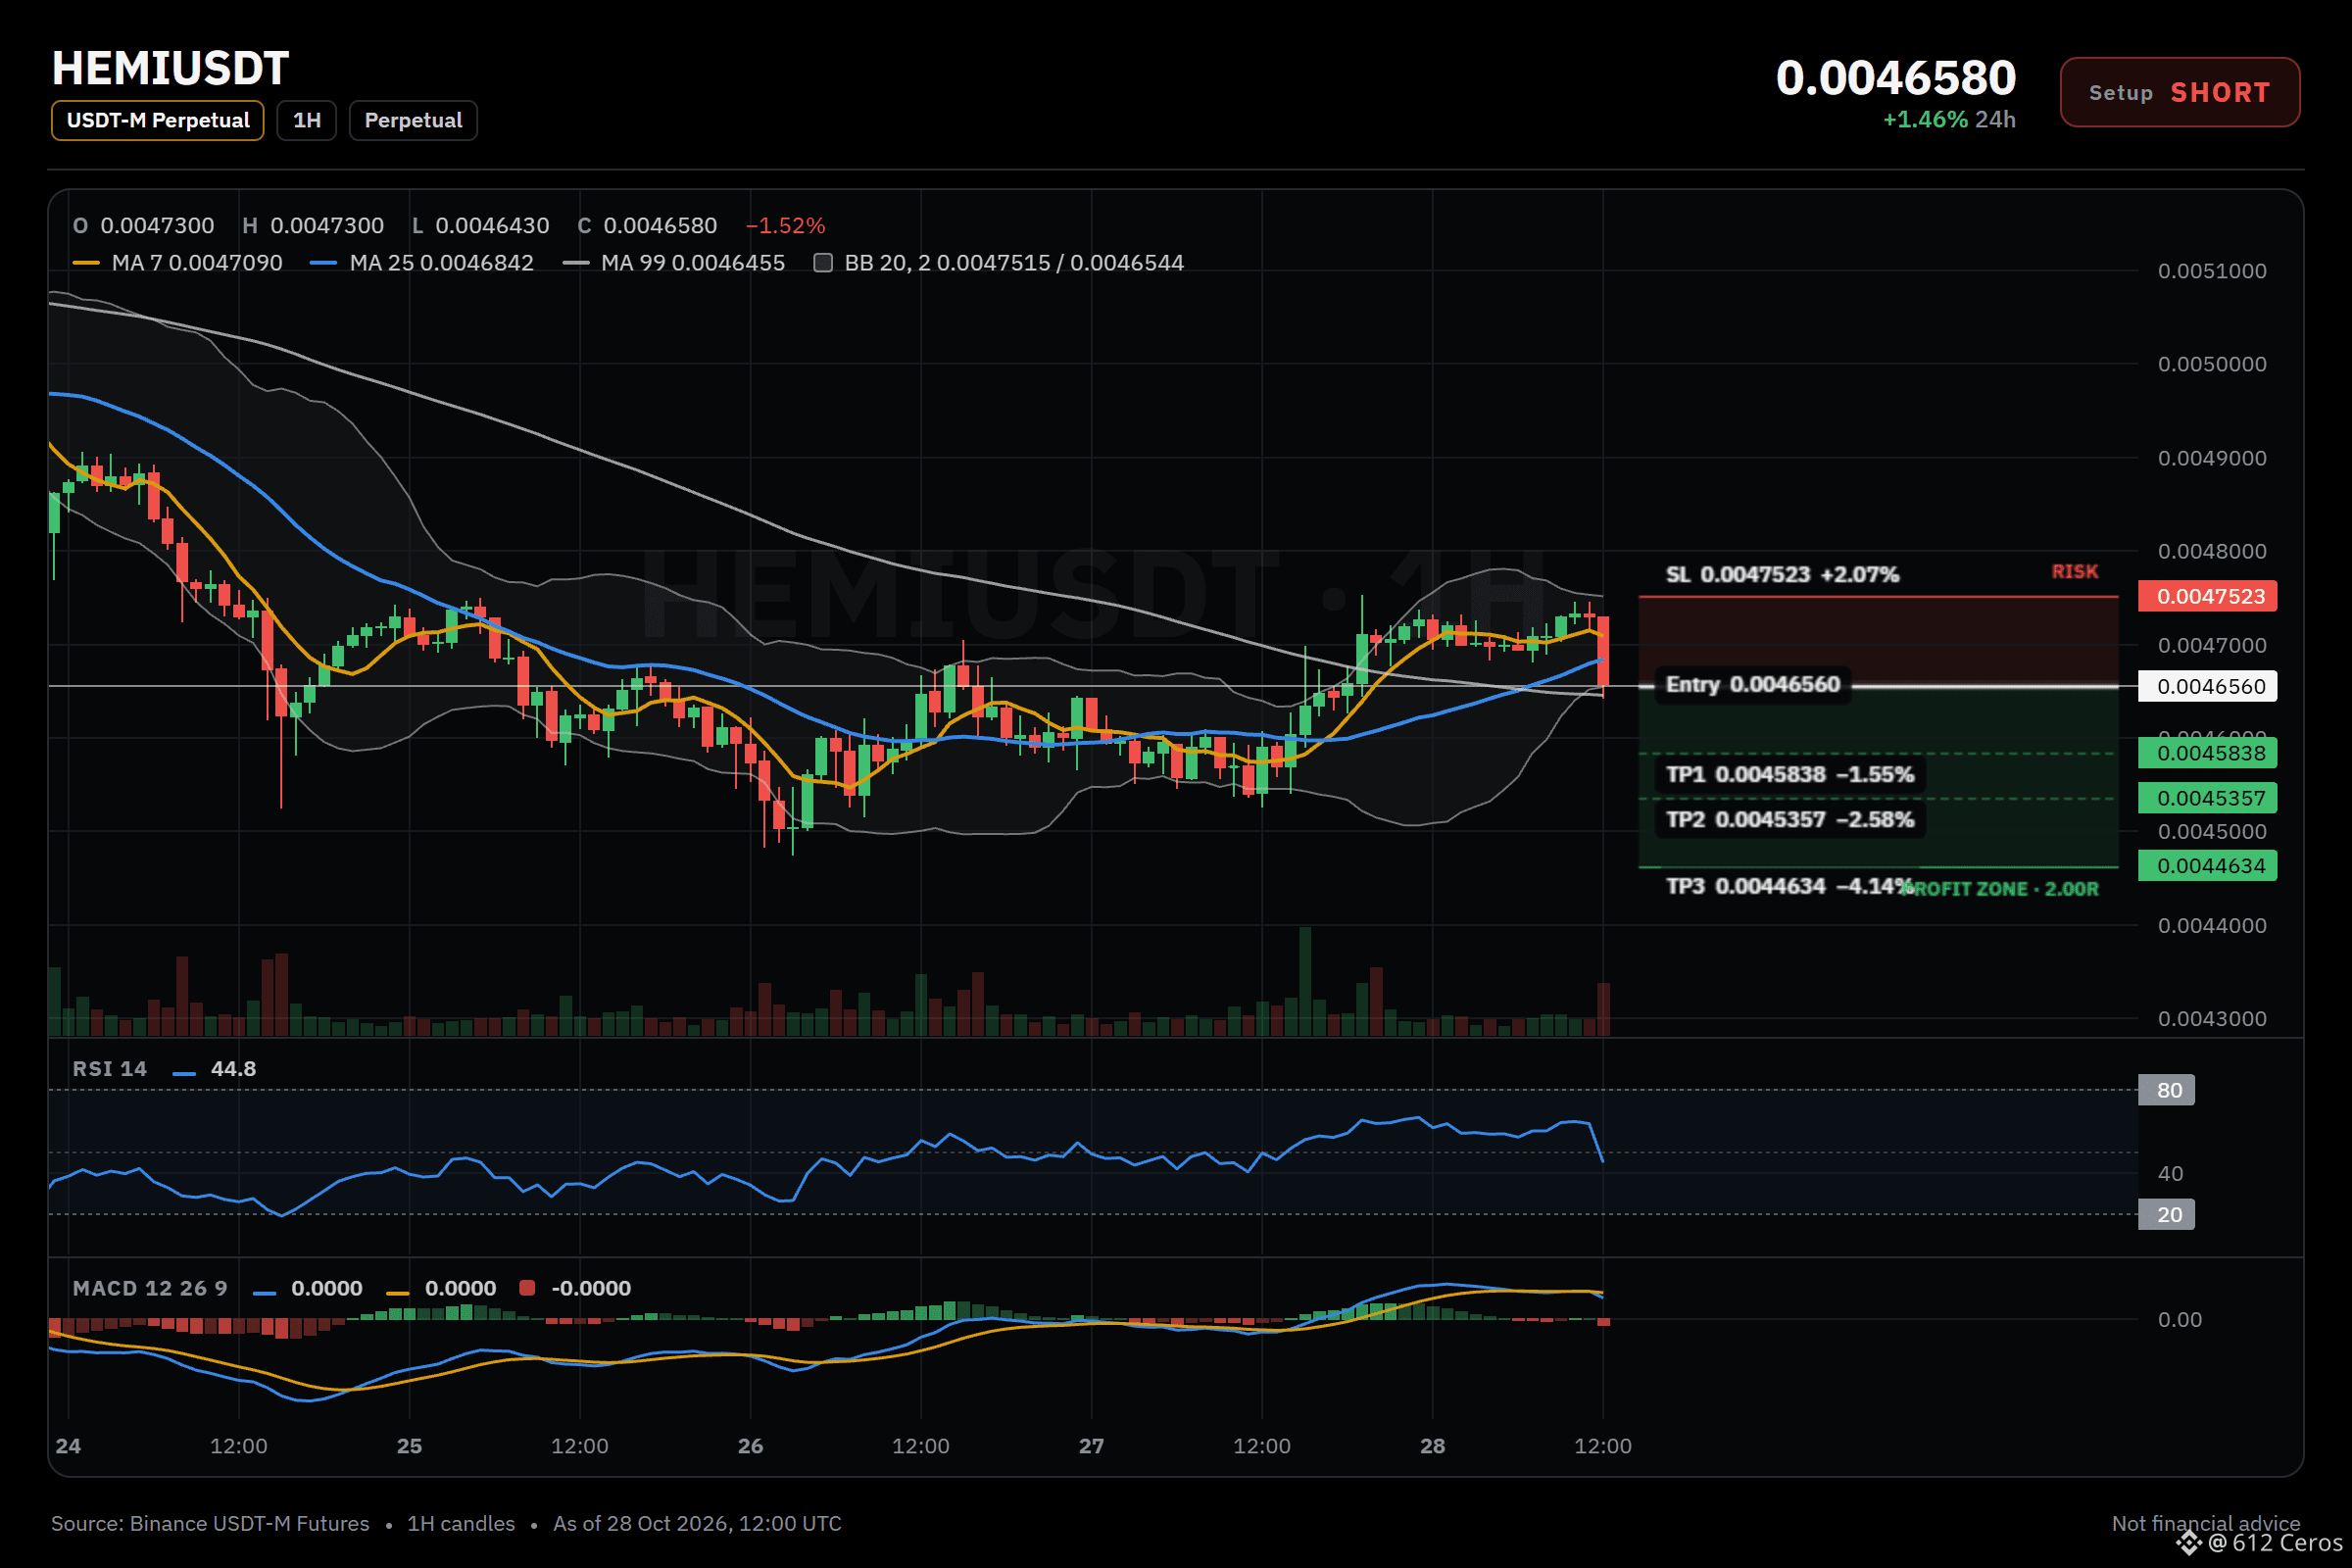
HEMI is still stubbornly lower against its stacked averages.
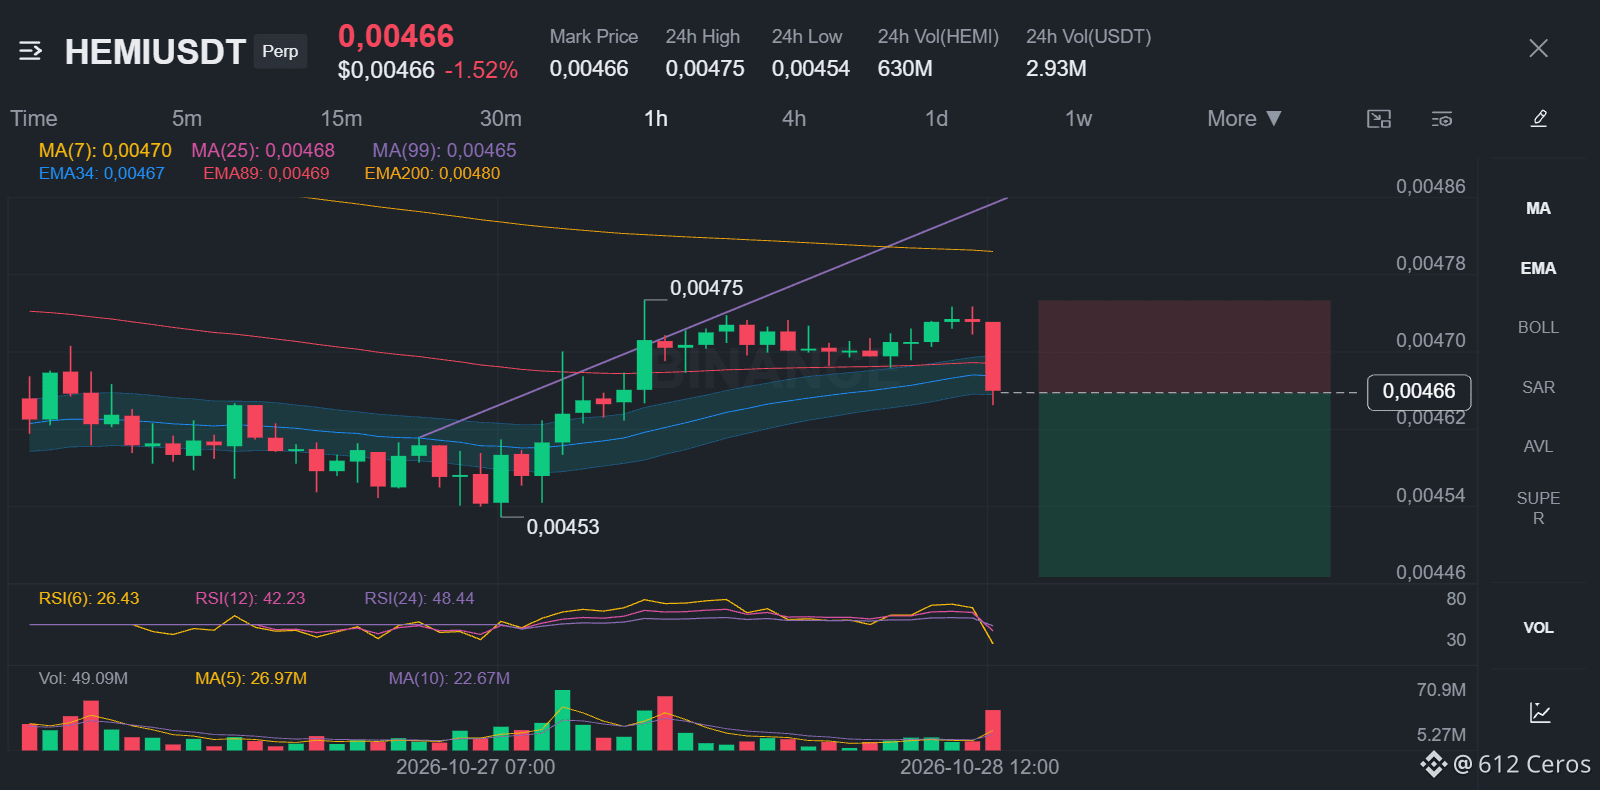
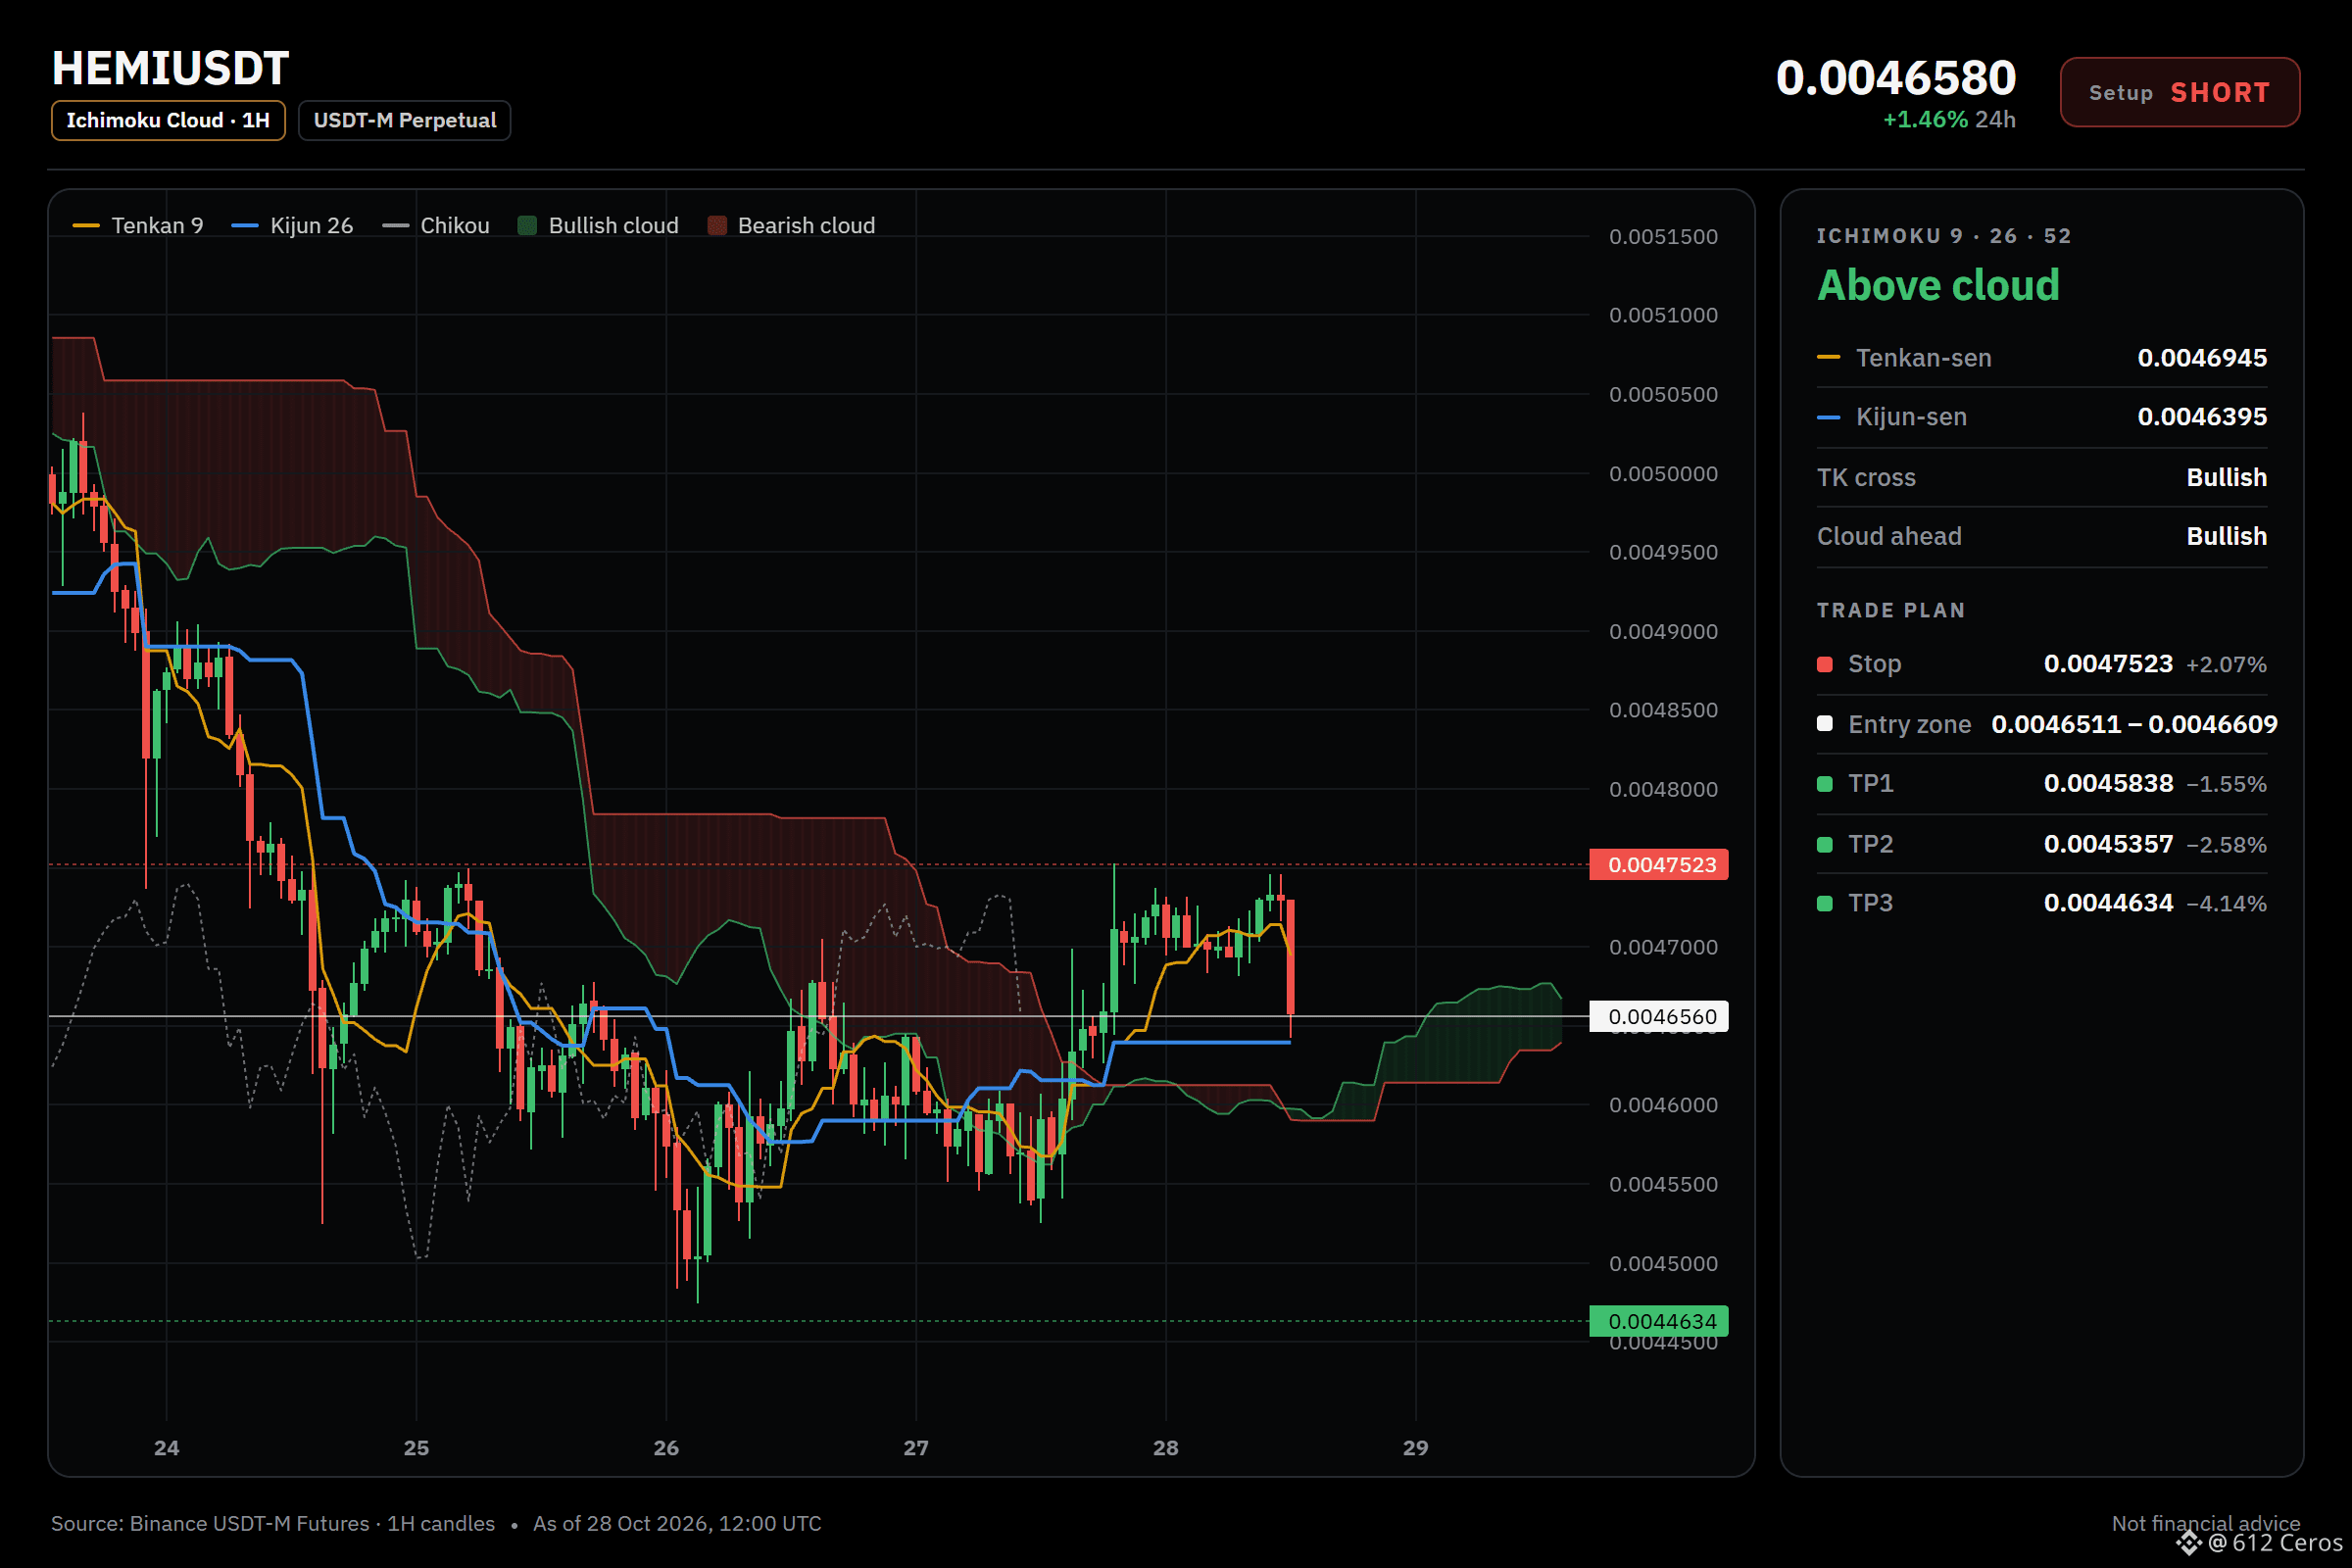
🔴 SHORT $HEMI /USDT: expecting price to go DOWN
Bias: SHORT · Strong
Entry: 0.0046511 – 0.0046609
TP1: 0.0045838 (-1.6%)
TP2: 0.0045357 (-2.6%)
TP3: 0.0044634 (-4.1%)
SL: 0.0047523 (+2.1%)
Plan: enter only inside the zone, close 50% at TP1, 25% at TP2, 25% at TP3, and move the stop to entry after TP1.
Why SHORT? 7/12 signals agree, 2 against.
• Daily trend down (below EMA50 & EMA200)
• 4h trend down (below EMA50 & EMA200)
• 1h trend down (below EMA50 & EMA200)
Risk: Stronger than BTC (+1.47% 24h vs BTC)
My read on HEMI today
I'm watching for a short here because the daily, 4h, and 1h trends are all bearish. I want to see sellers keep control before I look for a push higher. The 1h RSI is 44.9, which means bearish momentum, and the daily trend shows price below both the EMA50 and EMA200.
Where are you shorting HEMI if you are in?
Chart with every level below.
{future}(HEMIUSDT)
📲 Want more of my latest signals? Join me here:
[https://app.binance.com/uni-qr/D26WbL9t](https://app.binance.com/uni-qr/D26WbL9t)
⚠️ Personal market analysis only. NFA — manage risk and DYOR.
Educational content, not investment advice or a recommendation to buy, sell, deposit, or withdraw any asset. No paid promotion or referral/affiliate links.
HEMI is still stubbornly lower against its stacked averages.
🔴 SHORT $HEMI /USDT: expecting price to go DOWN
Bias: SHORT · Strong
Entry: 0.0046511 – 0.0046609
TP1: 0.0045838 (-1.6%)
TP2: 0.0045357 (-2.6%)
TP3: 0.0044634 (-4.1%)
SL: 0.0047523 (+2.1%)
Plan: enter only inside the zone, close 50% at TP1, 25% at TP2, 25% at TP3, and move the stop to entry after TP1.
Why SHORT? 7/12 signals agree, 2 against.
• Daily trend down (below EMA50 & EMA200)
• 4h trend down (below EMA50 & EMA200)
• 1h trend down (below EMA50 & EMA200)
Risk: Stronger than BTC (+1.47% 24h vs BTC)
My read on HEMI today
I'm watching for a short here because the daily, 4h, and 1h trends are all bearish. I want to see sellers keep control before I look for a push higher. The 1h RSI is 44.9, which means bearish momentum, and the daily trend shows price below both the EMA50 and EMA200.
Where are you shorting HEMI if you are in?
Chart with every level below.
📲 Want more of my latest signals? Join me here:
https://app.binance.com/uni-qr/D26WbL9t
⚠️ Personal market analysis only. NFA — manage risk and DYOR.
Educational content, not investment advice or a recommendation to buy, sell, deposit, or withdraw any asset. No paid promotion or referral/affiliate links.
108
·
--
Baissier
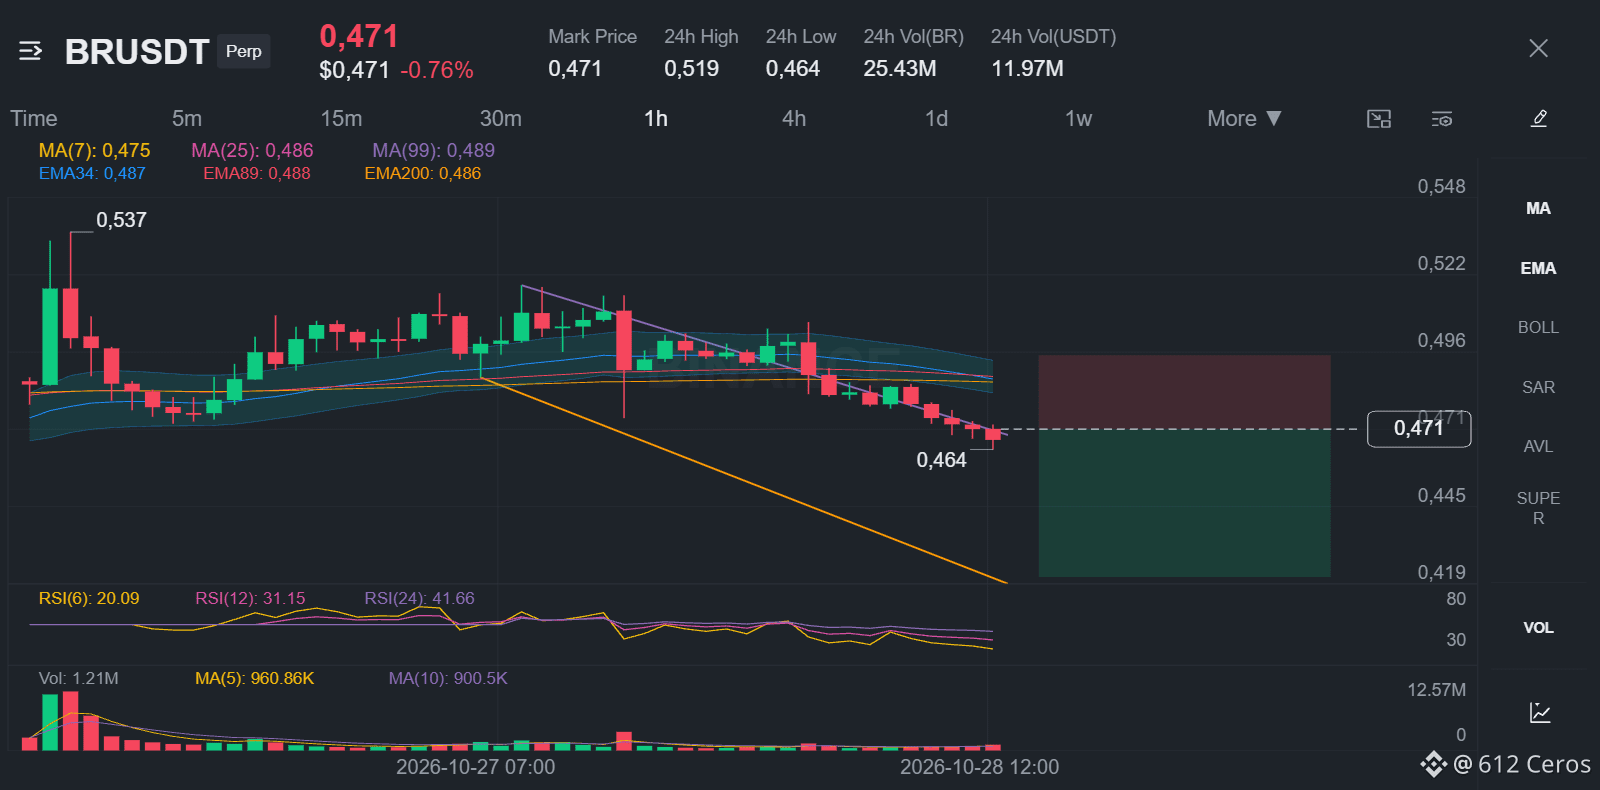
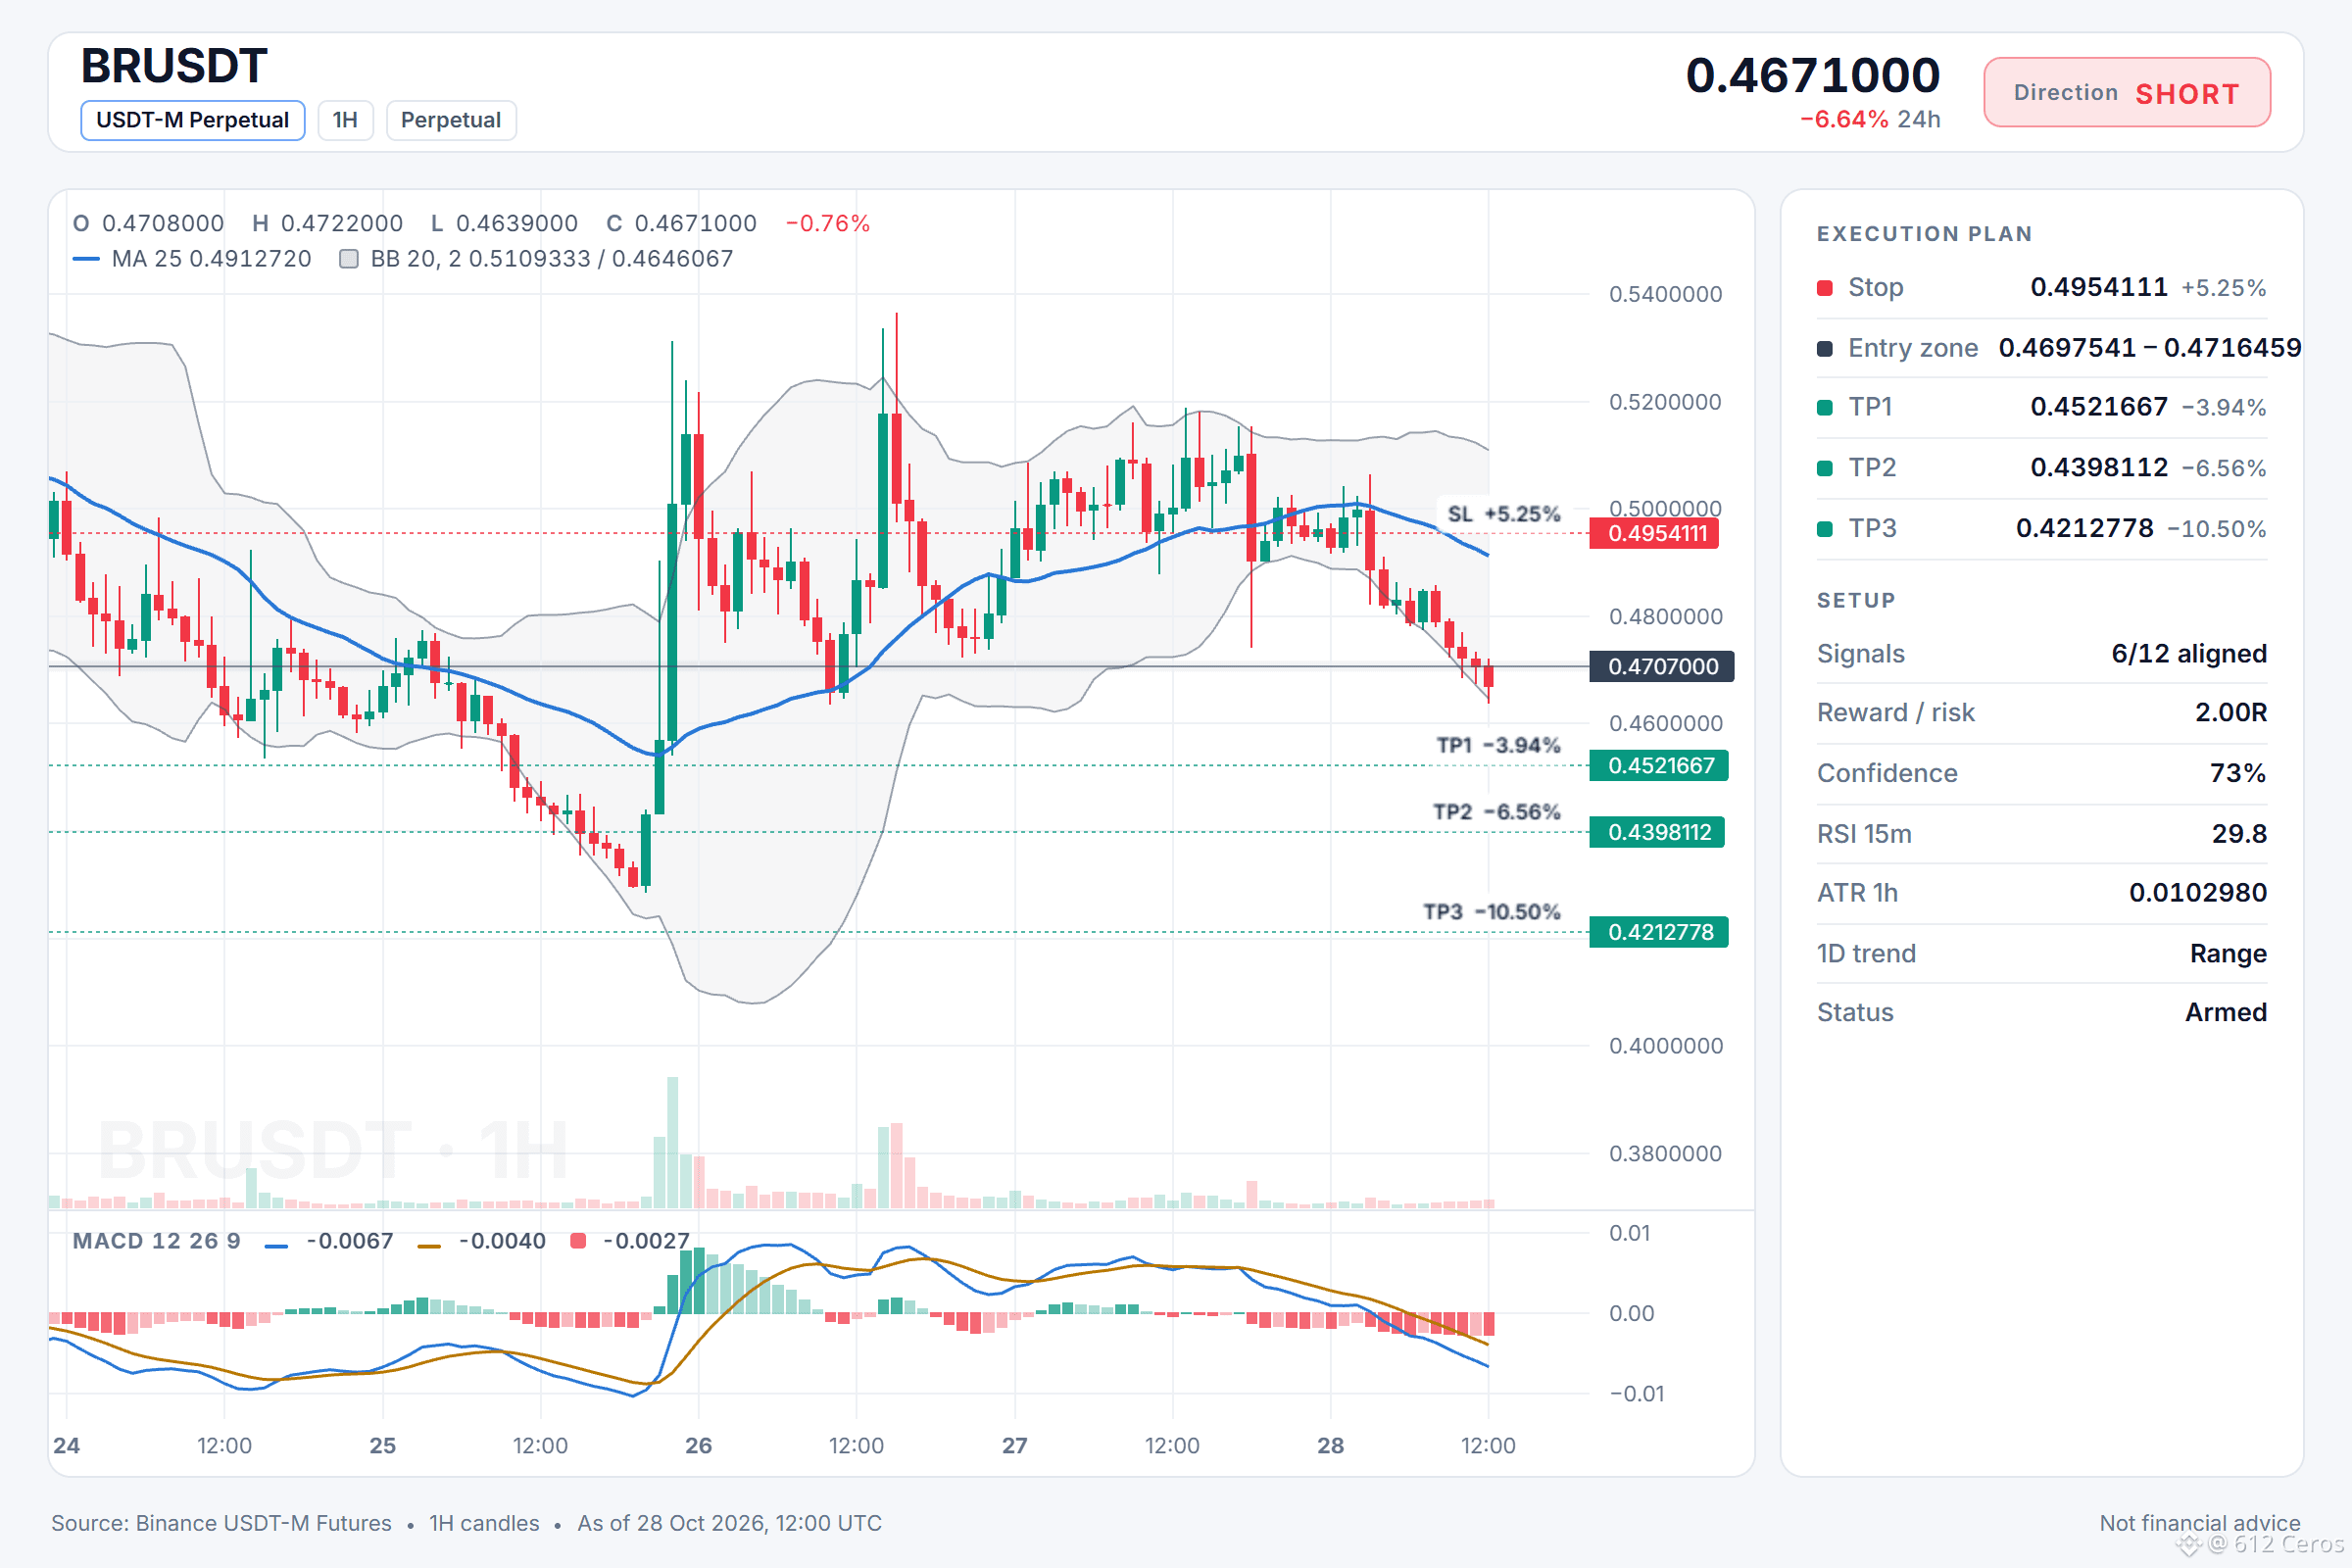
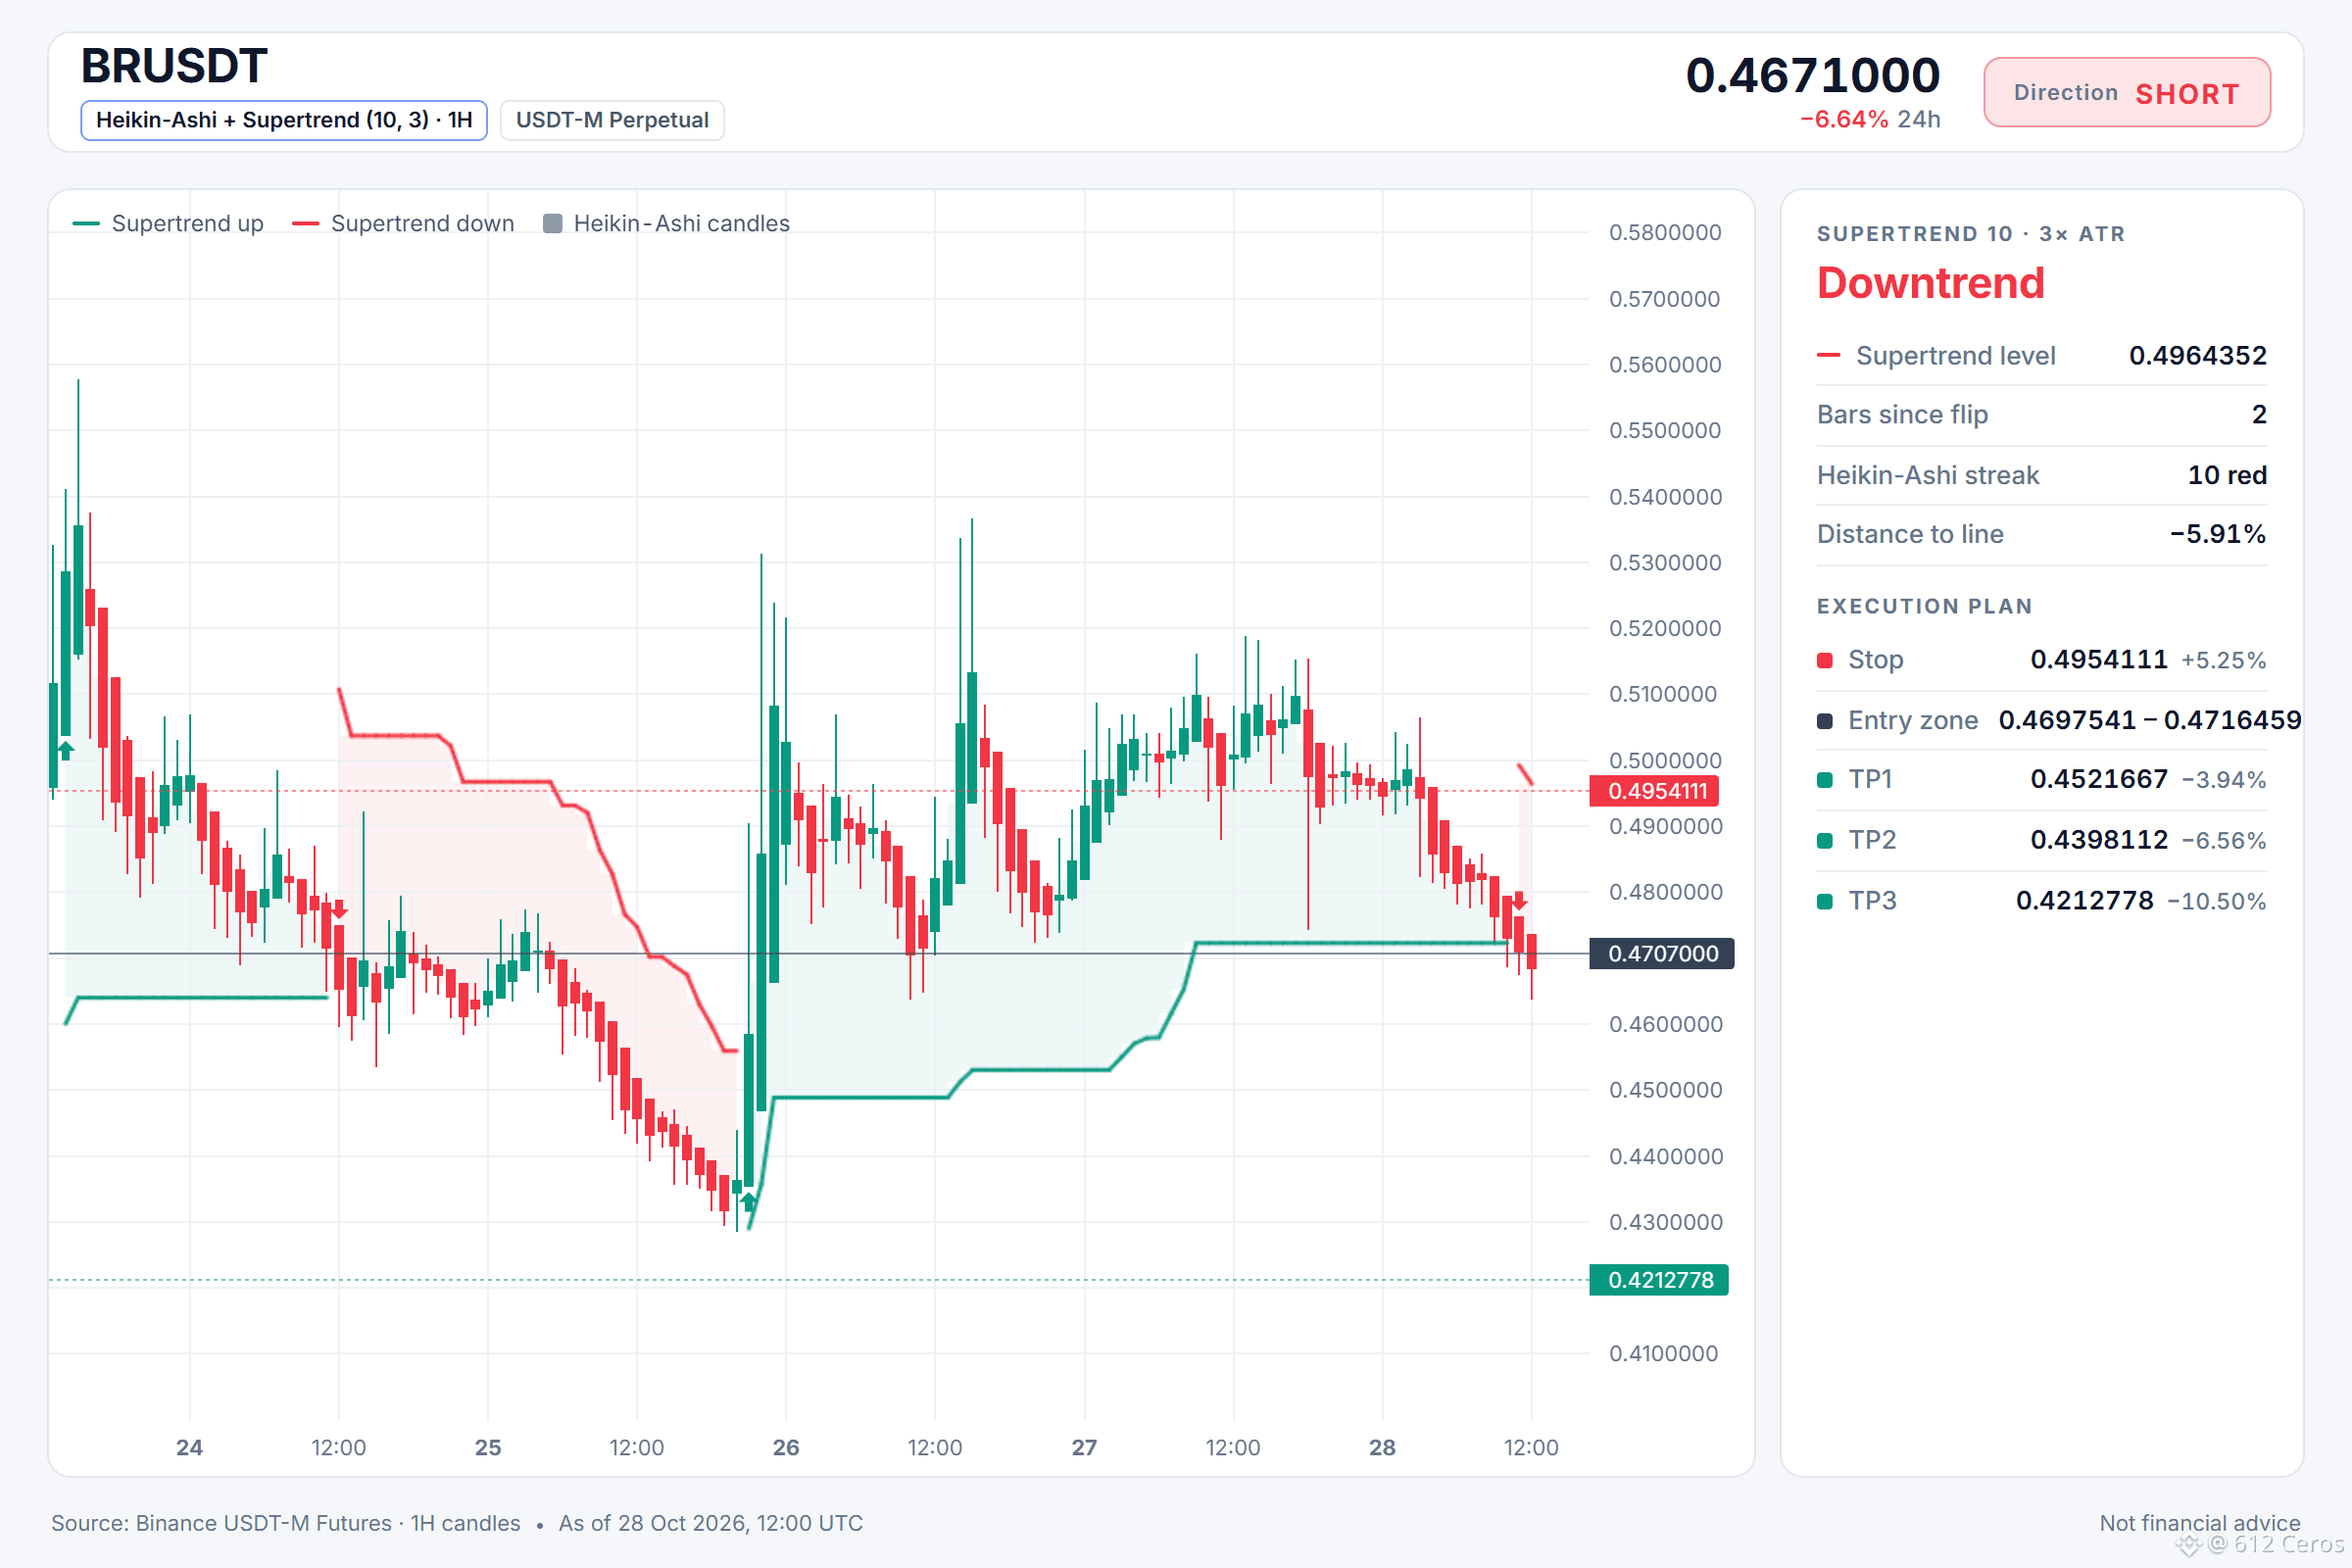
A bearish stack is dragging BR lower again.
🔴 SHORT $BR /USDT: expecting price to go DOWN
Bias: SHORT · Strong
Entry: 0.4697541 – 0.4716459
TP1: 0.4521667 (-3.9%)
TP2: 0.4398112 (-6.6%)
TP3: 0.4212778 (-10.5%)
SL: 0.4954111 (+5.2%)
Plan: enter only inside the zone, close 50% at TP1, 25% at TP2, 25% at TP3, and move the stop to entry after TP1.
Why SHORT? 6/12 signals agree, 0 against.
• 4h trend down (below EMA50 & EMA200)
• 1h trend down (below EMA50 & EMA200)
• Sellers are driving the move (15m ADX 35.3)
In plain words:
The 4h trend is down, with the price below both the 50 and 200 period averages, and the 1h trend is also down. The 4h RSI sits at 44.6 and the 1h RSI at 33.6, both showing sellers are in control. This gives a clear edge for a short setup on BR.
Where would you place your own short level?
Levels mapped on the chart below.
{future}(BRUSDT)
📲 Want more of my latest signals? Join me here:
[https://app.binance.com/uni-qr/D26WbL9t](https://app.binance.com/uni-qr/D26WbL9t)
⚠️ Personal market analysis only. NFA — manage risk and DYOR.
Educational content, not investment advice or a recommendation to buy, sell, deposit, or withdraw any asset. No paid promotion or referral/affiliate links.
A bearish stack is dragging BR lower again.
🔴 SHORT $BR /USDT: expecting price to go DOWN
Bias: SHORT · Strong
Entry: 0.4697541 – 0.4716459
TP1: 0.4521667 (-3.9%)
TP2: 0.4398112 (-6.6%)
TP3: 0.4212778 (-10.5%)
SL: 0.4954111 (+5.2%)
Plan: enter only inside the zone, close 50% at TP1, 25% at TP2, 25% at TP3, and move the stop to entry after TP1.
Why SHORT? 6/12 signals agree, 0 against.
• 4h trend down (below EMA50 & EMA200)
• 1h trend down (below EMA50 & EMA200)
• Sellers are driving the move (15m ADX 35.3)
In plain words:
The 4h trend is down, with the price below both the 50 and 200 period averages, and the 1h trend is also down. The 4h RSI sits at 44.6 and the 1h RSI at 33.6, both showing sellers are in control. This gives a clear edge for a short setup on BR.
Where would you place your own short level?
Levels mapped on the chart below.
📲 Want more of my latest signals? Join me here:
https://app.binance.com/uni-qr/D26WbL9t
⚠️ Personal market analysis only. NFA — manage risk and DYOR.
Educational content, not investment advice or a recommendation to buy, sell, deposit, or withdraw any asset. No paid promotion or referral/affiliate links.
1
201
·
--
Baissier
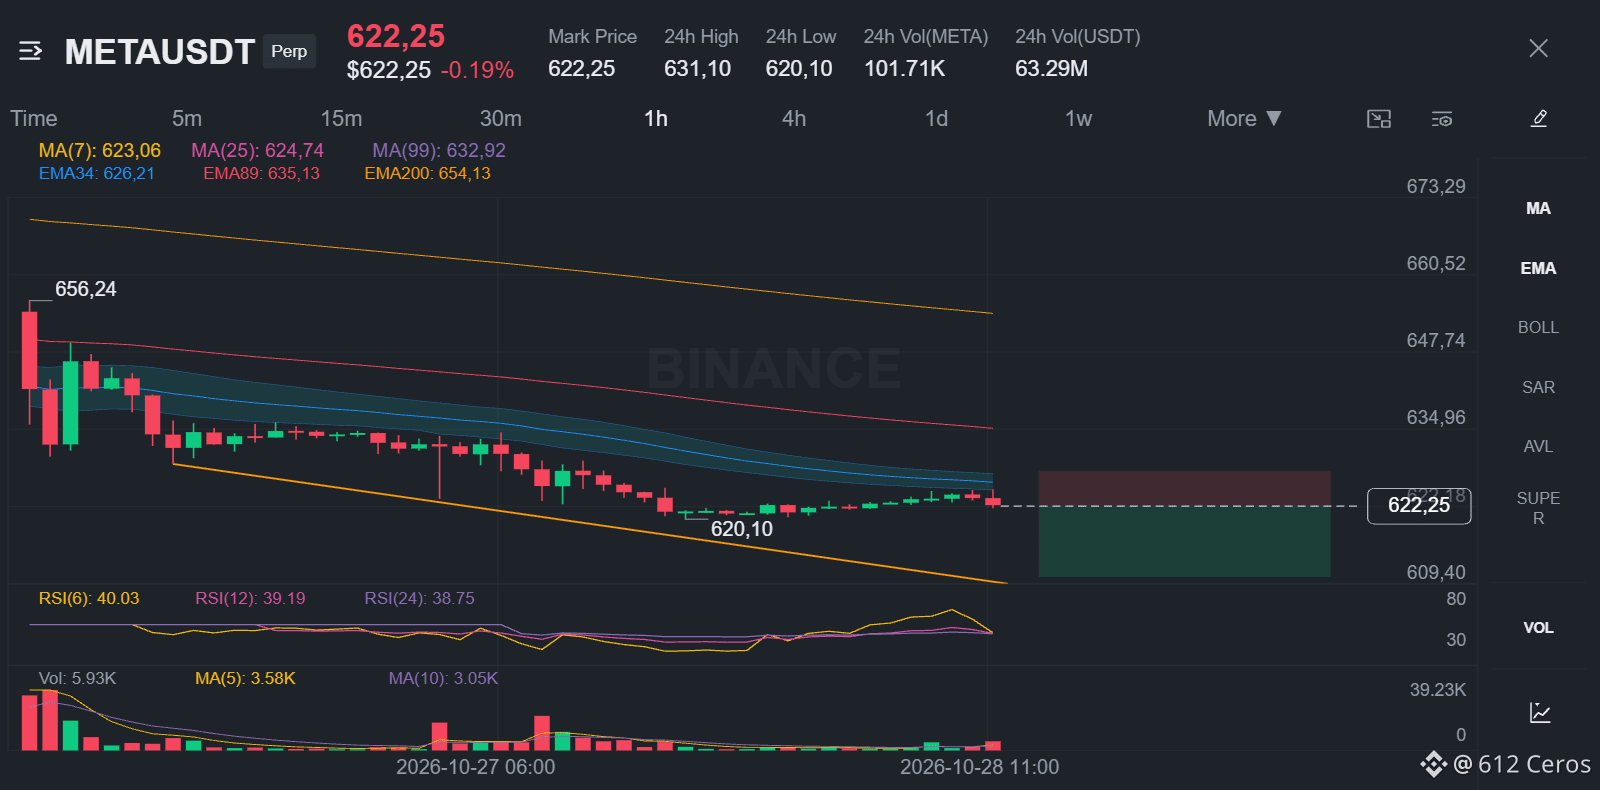
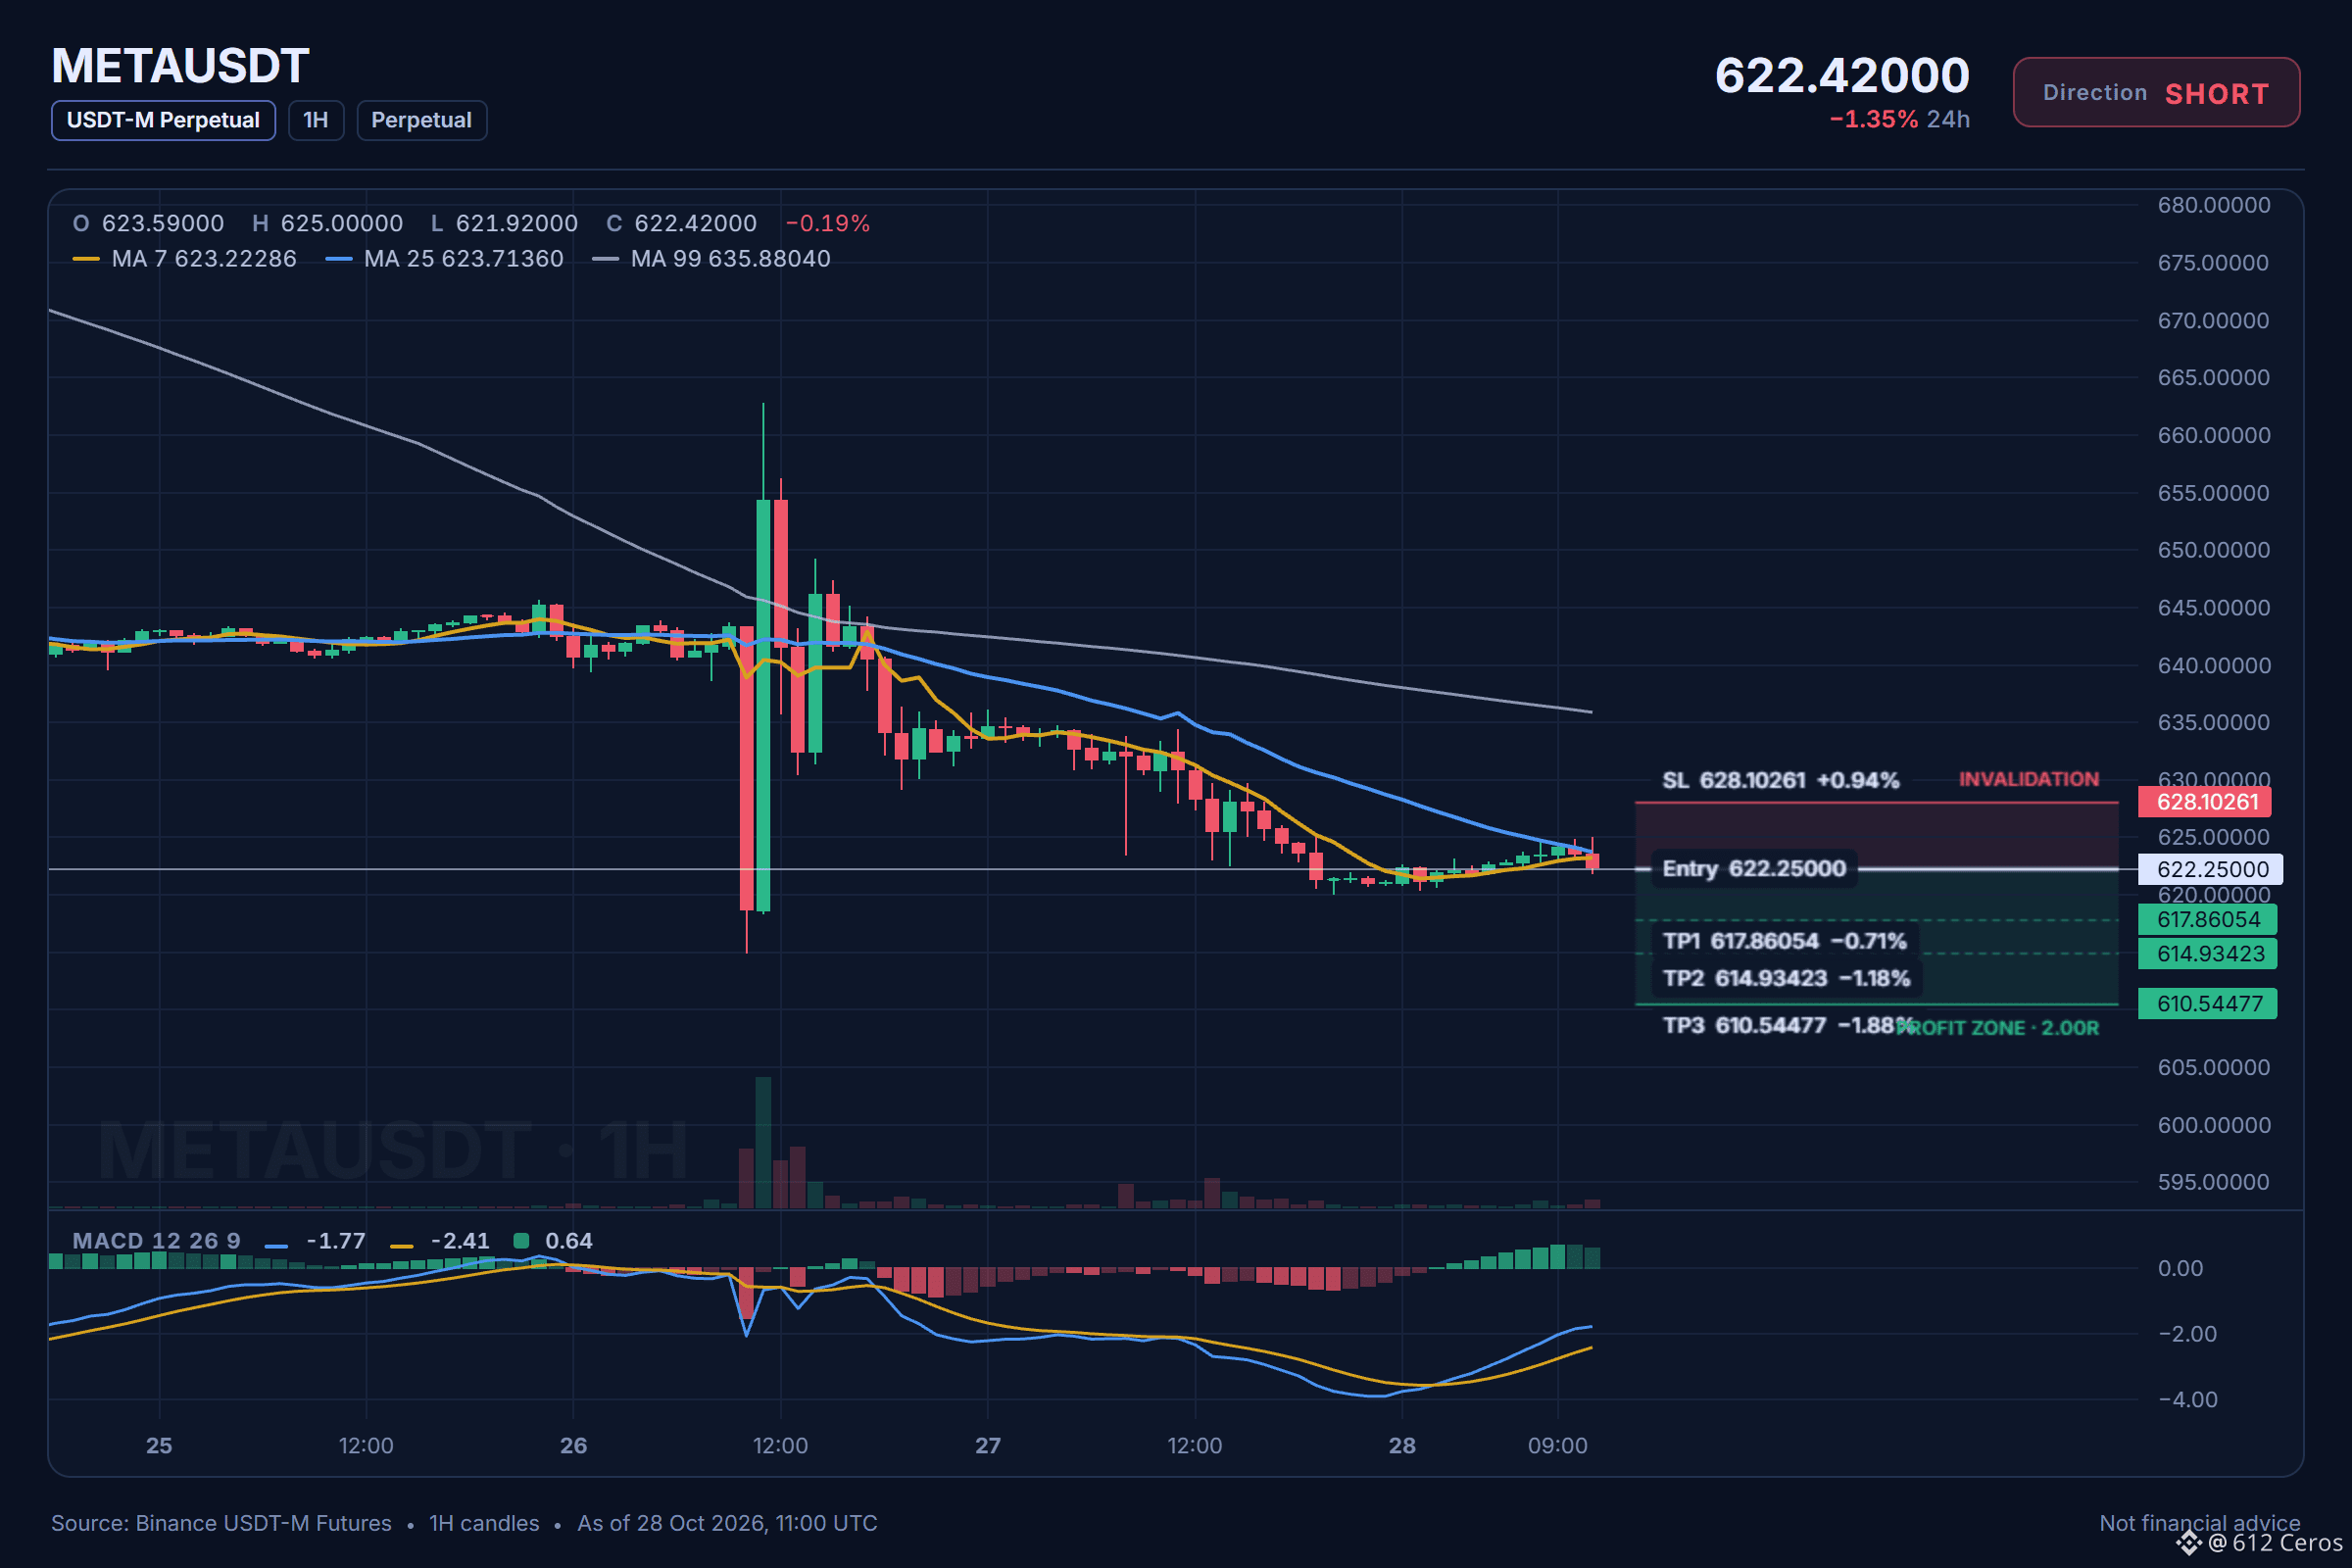
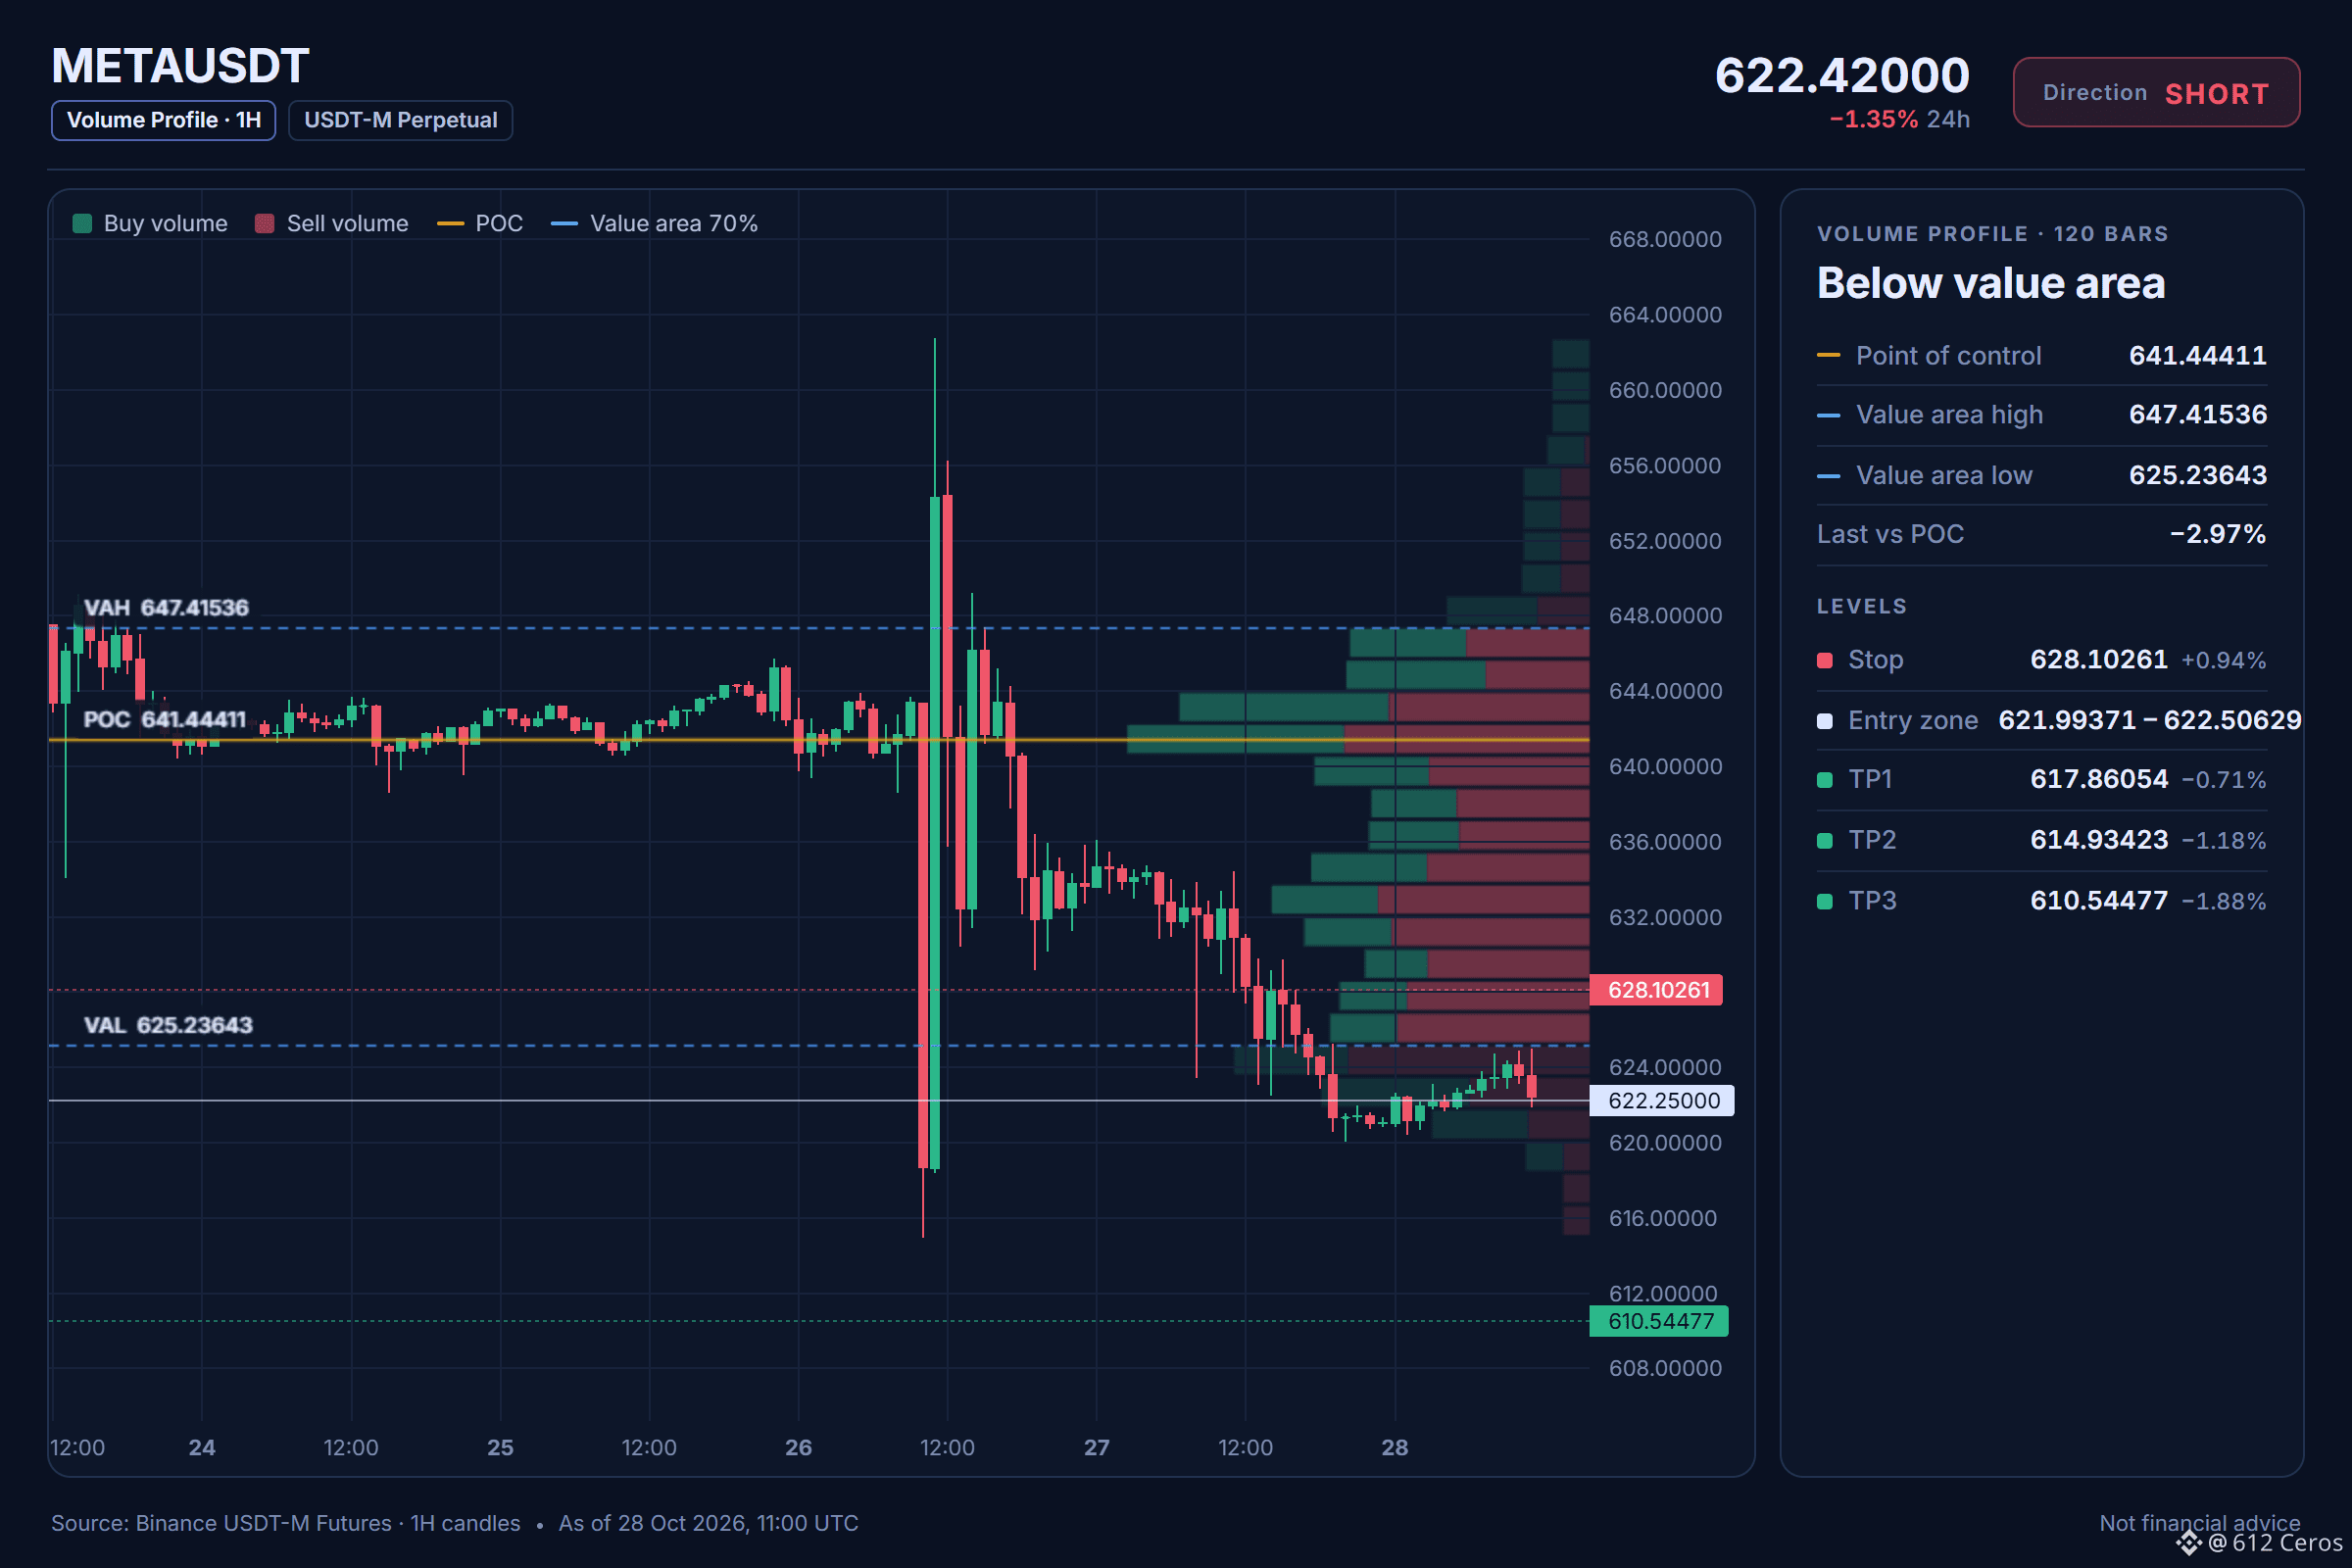
META is sliding in a clear bearish stack.
🔴 SHORT $META /USDT: expecting price to go DOWN
Bias: SHORT · Strong
Entry: 621.99371 – 622.50629
TP1: 617.86054 (-0.7%)
TP2: 614.93423 (-1.2%)
TP3: 610.54477 (-1.9%)
SL: 628.10261 (+0.9%)
Plan: enter only inside the zone, close 50% at TP1, 25% at TP2, 25% at TP3, and move the stop to entry after TP1.
Why SHORT? 6/12 signals agree, 1 against.
• 4h trend down (below EMA50 & EMA200)
• 1h trend down (below EMA50 & EMA200)
• Sellers have the momentum (4h RSI 29.6)
Risk: Buyers are driving the move (15m ADX 21.8)
Plan A:
Price should keep falling toward the first target, with the 4h trend showing sellers in control.
Plan B (invalidation):
A close back above the stop invalidates the short and proves the idea wrong, so I would exit.
Where do you want to enter the short?
Levels mapped on the chart below.
{future}(METAUSDT)
📲 Want more of my latest signals? Join me here:
[https://app.binance.com/uni-qr/D26WbL9t](https://app.binance.com/uni-qr/D26WbL9t)
⚠️ Personal market analysis only. NFA — manage risk and DYOR.
Educational content, not investment advice or a recommendation to buy, sell, deposit, or withdraw any asset. No paid promotion or referral/affiliate links.
META is sliding in a clear bearish stack.
🔴 SHORT $META /USDT: expecting price to go DOWN
Bias: SHORT · Strong
Entry: 621.99371 – 622.50629
TP1: 617.86054 (-0.7%)
TP2: 614.93423 (-1.2%)
TP3: 610.54477 (-1.9%)
SL: 628.10261 (+0.9%)
Plan: enter only inside the zone, close 50% at TP1, 25% at TP2, 25% at TP3, and move the stop to entry after TP1.
Why SHORT? 6/12 signals agree, 1 against.
• 4h trend down (below EMA50 & EMA200)
• 1h trend down (below EMA50 & EMA200)
• Sellers have the momentum (4h RSI 29.6)
Risk: Buyers are driving the move (15m ADX 21.8)
Plan A:
Price should keep falling toward the first target, with the 4h trend showing sellers in control.
Plan B (invalidation):
A close back above the stop invalidates the short and proves the idea wrong, so I would exit.
Where do you want to enter the short?
Levels mapped on the chart below.
📲 Want more of my latest signals? Join me here:
https://app.binance.com/uni-qr/D26WbL9t
⚠️ Personal market analysis only. NFA — manage risk and DYOR.
Educational content, not investment advice or a recommendation to buy, sell, deposit, or withdraw any asset. No paid promotion or referral/affiliate links.
1
414
·
--
Haussier
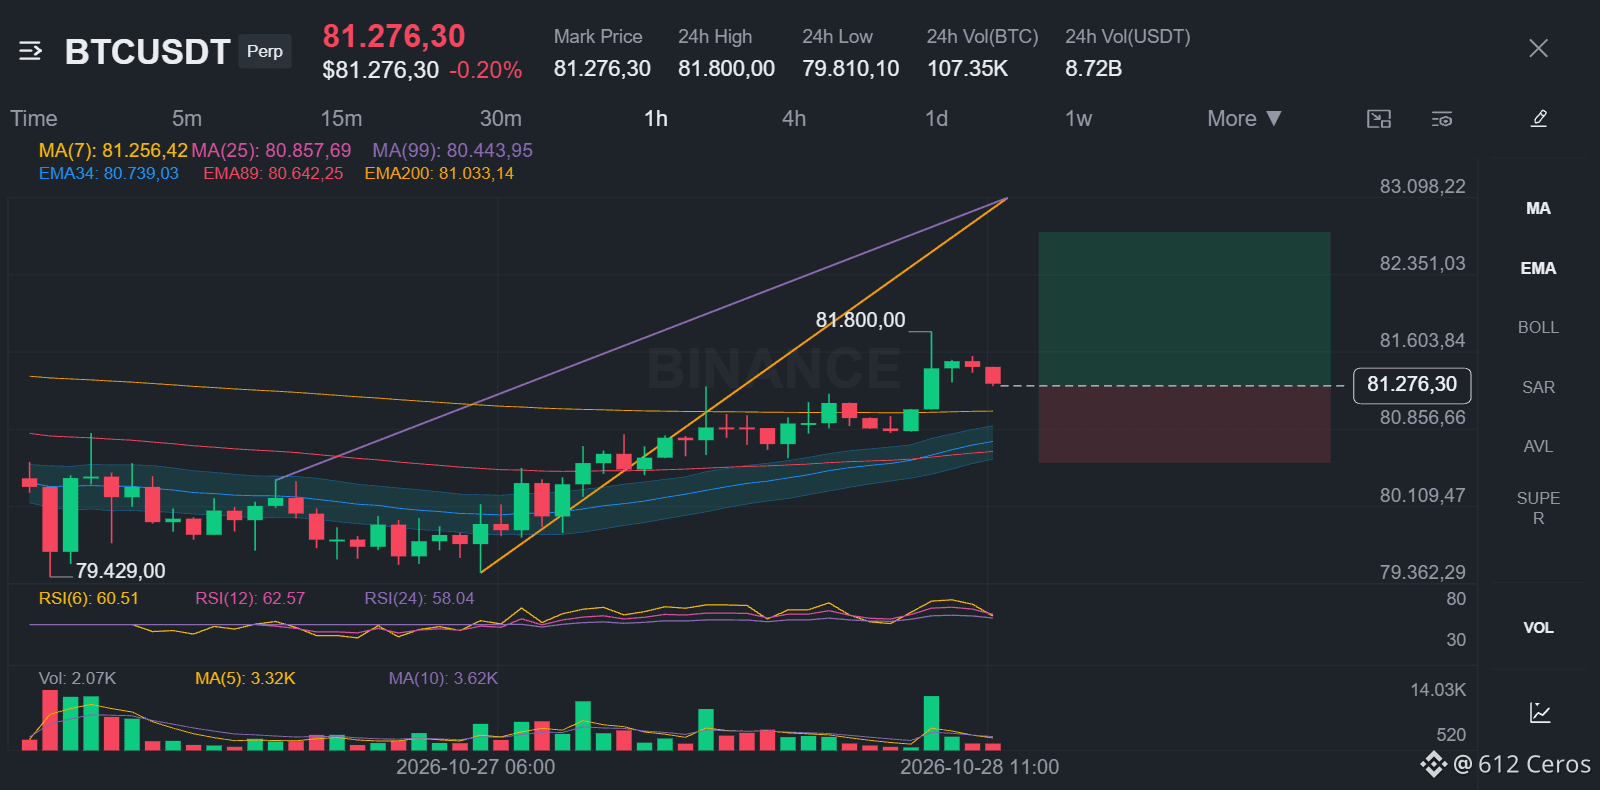
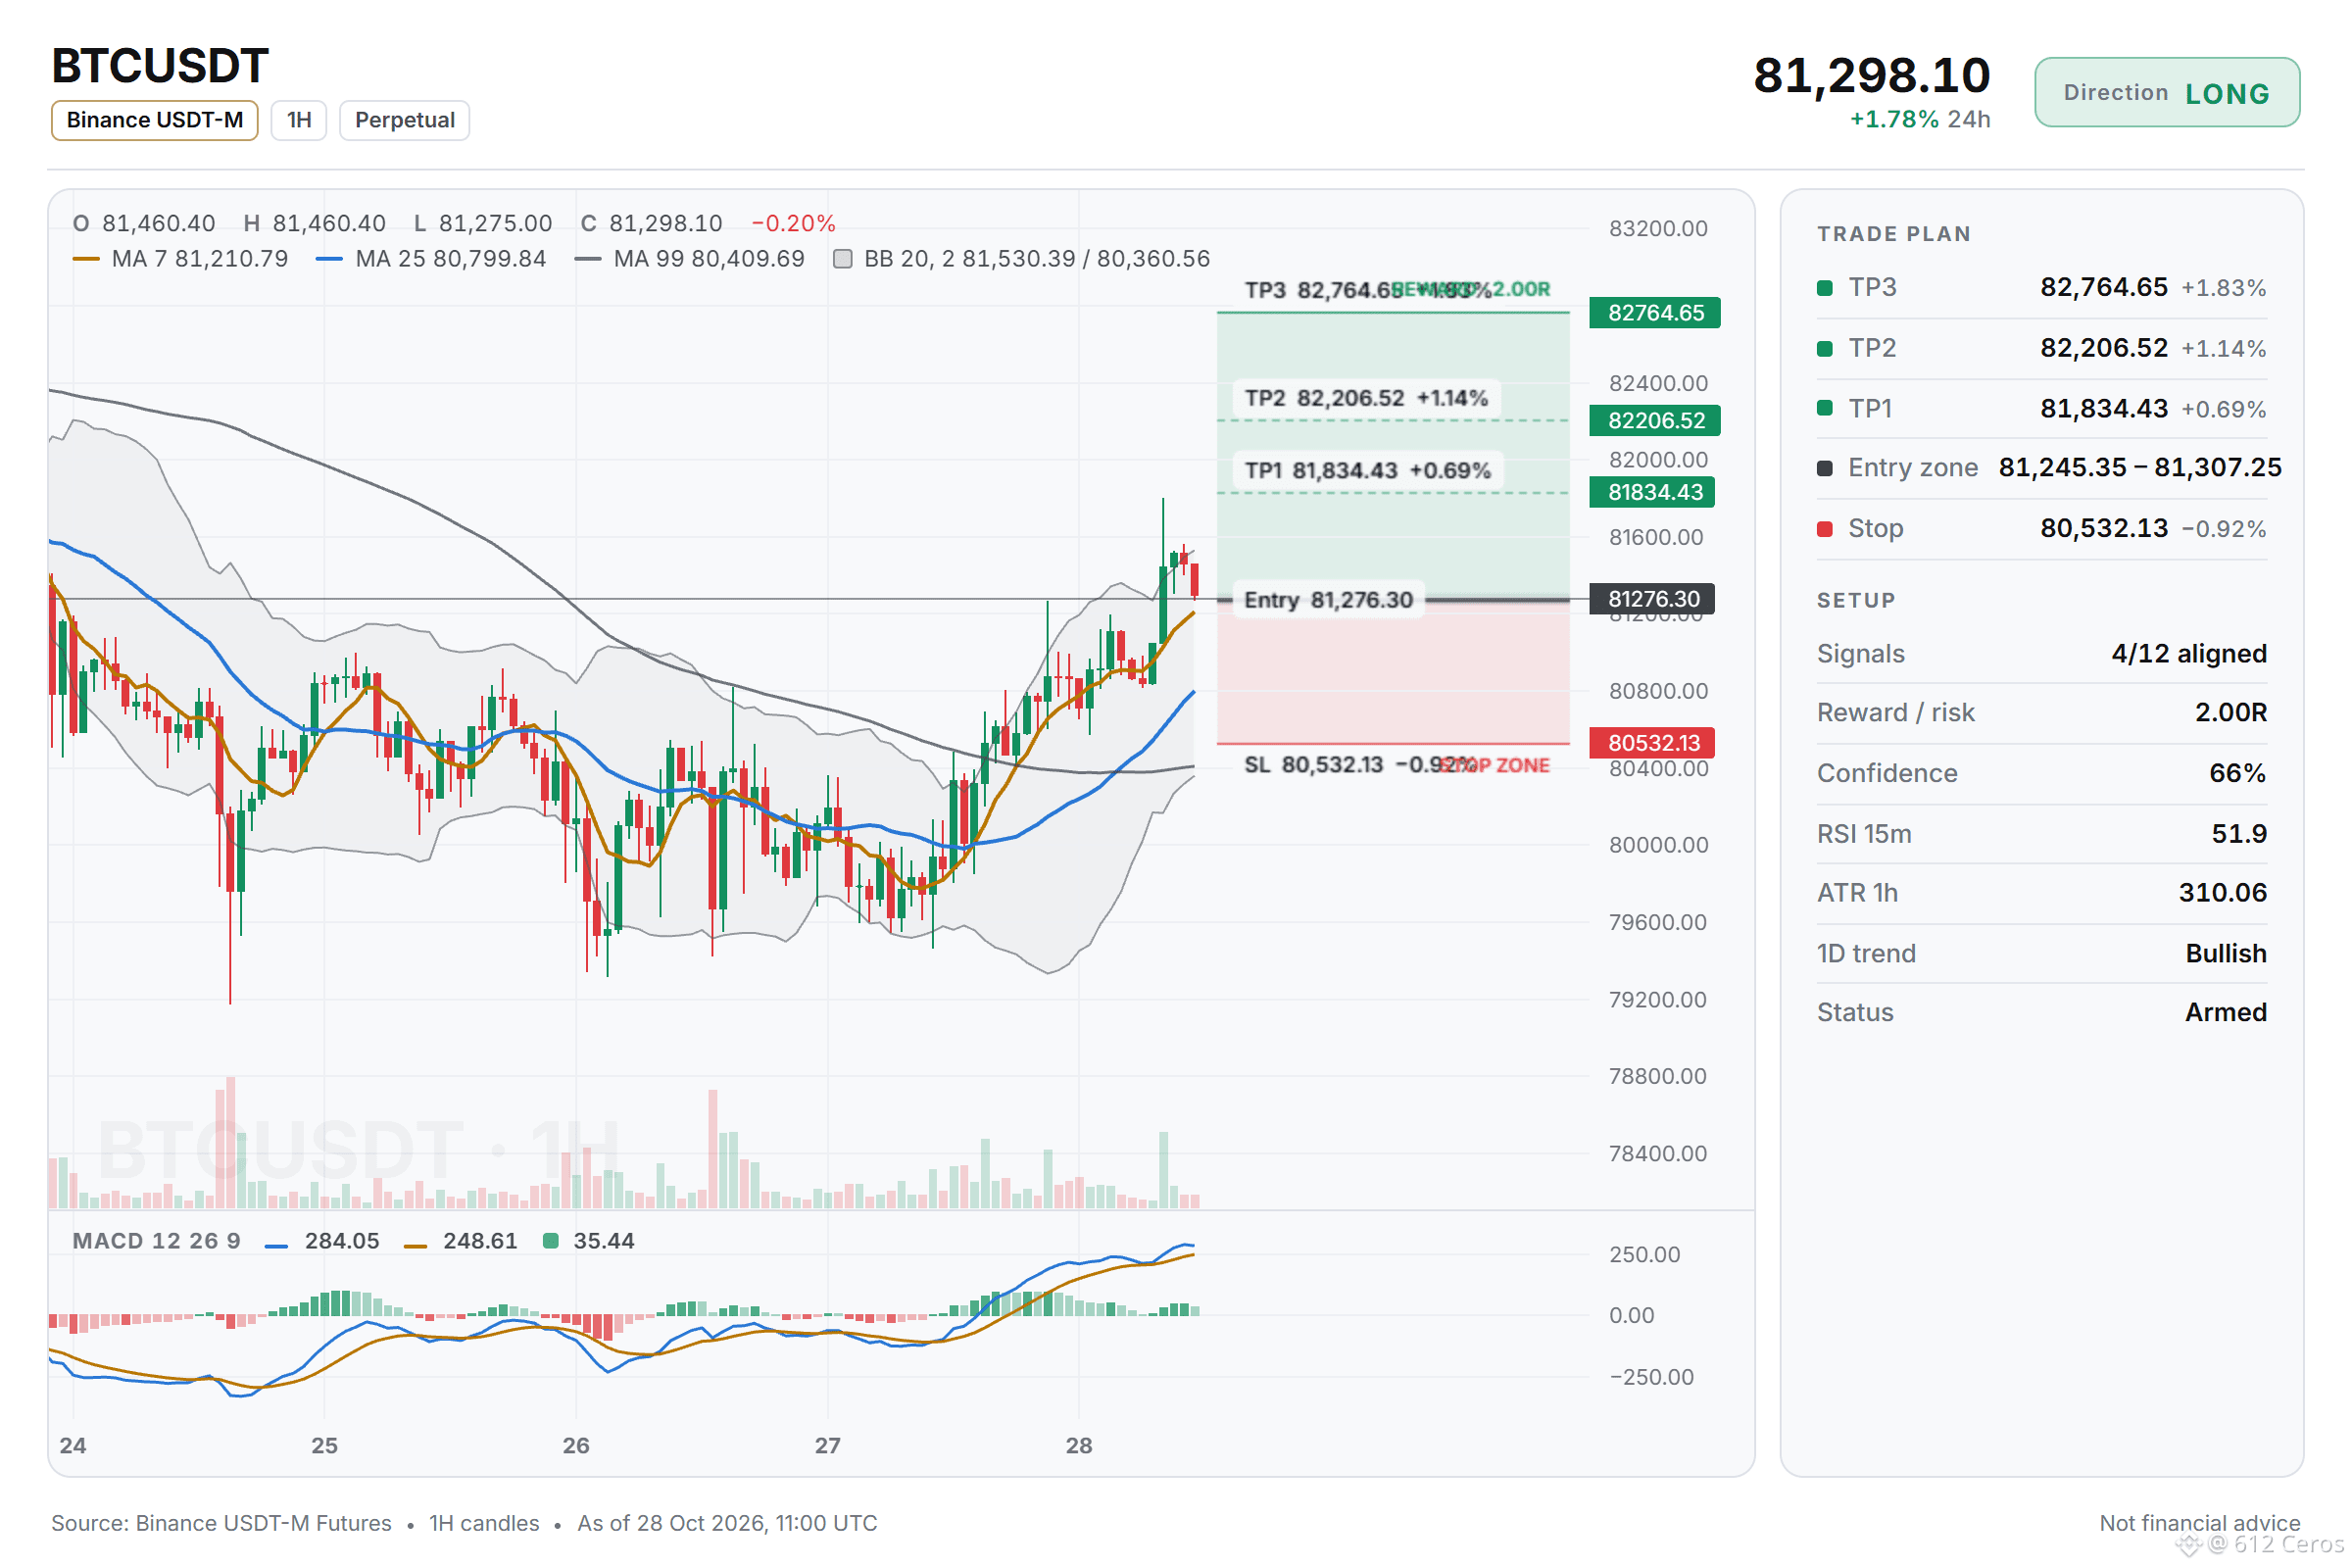
🟢 LONG $BTC /USDT: expecting price to go UP
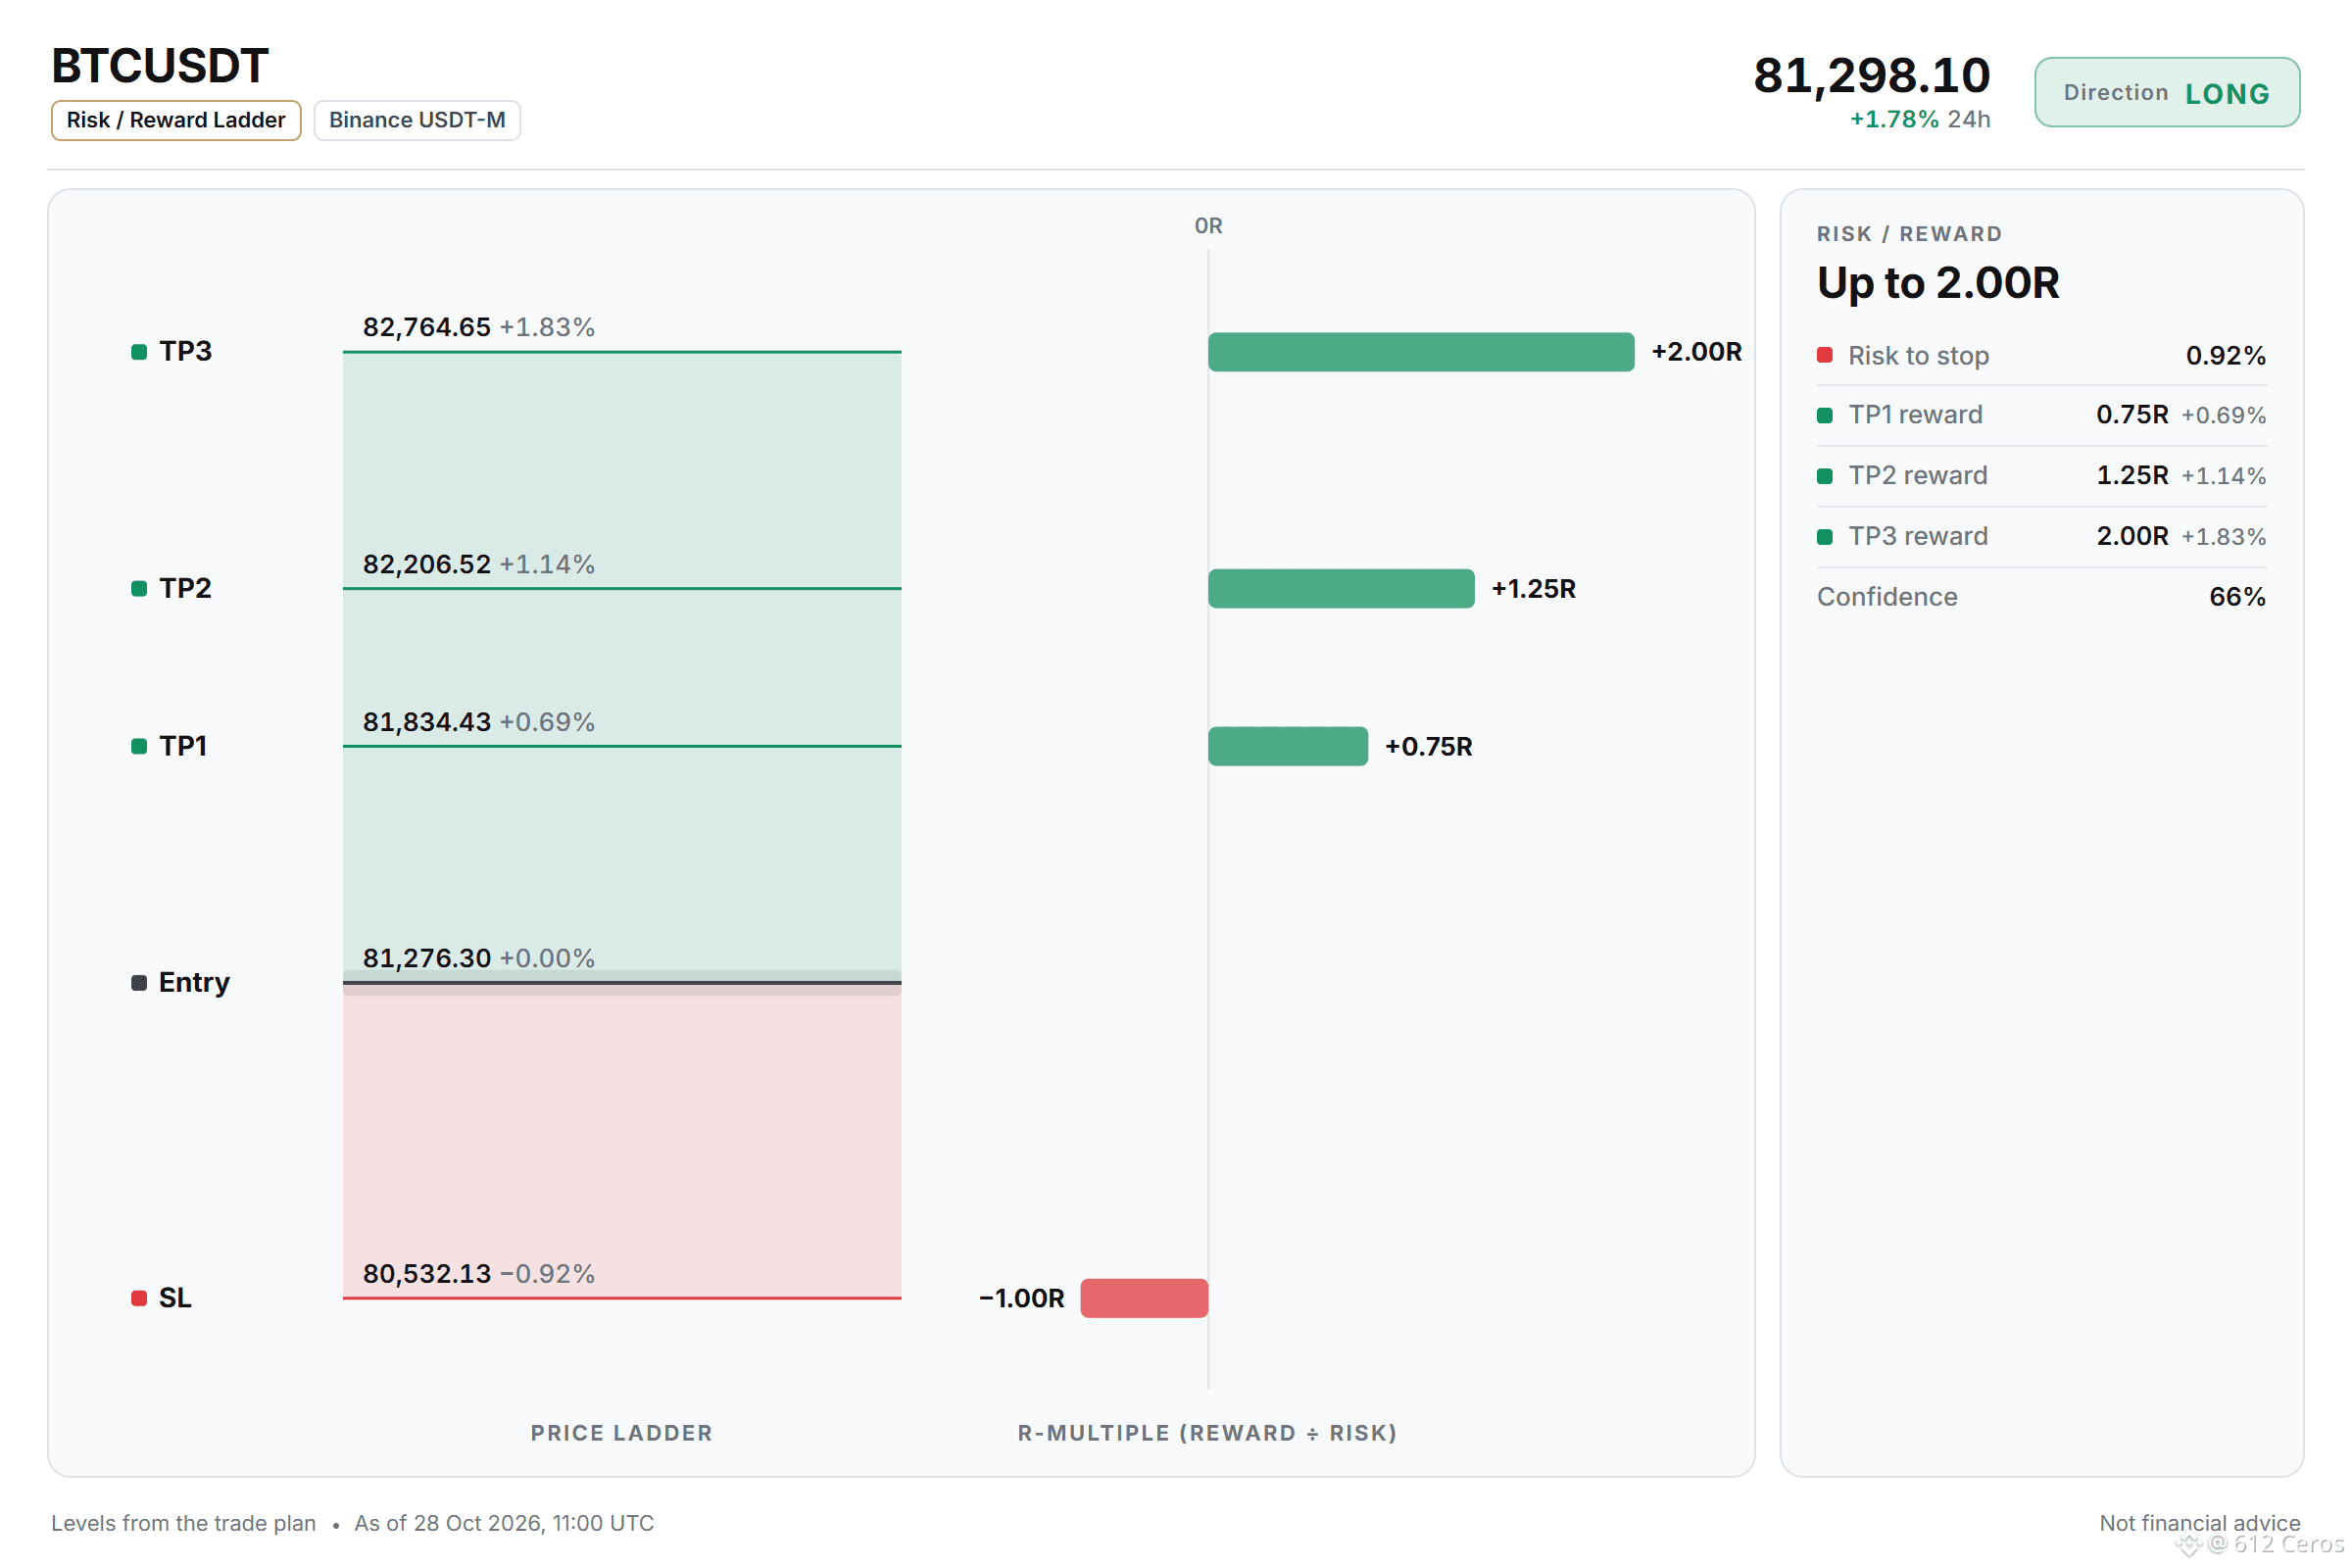
Bias: LONG · Leaning
Entry: 81245.35 – 81307.25
TP1: 81834.43 (+0.7%)
TP2: 82206.52 (+1.1%)
TP3: 82764.65 (+1.8%)
SL: 80532.13 (-0.9%)
Plan: enter only inside the zone, close 50% at TP1, 25% at TP2, 25% at TP3, and move the stop to entry after TP1.
Note: moderate conviction only, keep size light.
Price holding above the stacked averages
Why LONG? 4/12 signals agree, 0 against.
• Daily trend up (above EMA50 & EMA200)
• Buyers are driving the move (15m ADX 38.0)
• Buyers have the momentum (4h RSI 58.6)
The daily trend is bullish and the 1h price sits just 2.1 ATR above its EMA50, so a long is not stretched.
Where would you place your stop on this level?
Full setup on the chart below.
{future}(BTCUSDT)
📲 Want more of my latest signals? Join me here:
[https://app.binance.com/uni-qr/D26WbL9t](https://app.binance.com/uni-qr/D26WbL9t)
⚠️ Personal market analysis only. NFA — manage risk and DYOR.
Educational content, not investment advice or a recommendation to buy, sell, deposit, or withdraw any asset. No paid promotion or referral/affiliate links.
🟢 LONG $BTC /USDT: expecting price to go UP
Bias: LONG · Leaning
Entry: 81245.35 – 81307.25
TP1: 81834.43 (+0.7%)
TP2: 82206.52 (+1.1%)
TP3: 82764.65 (+1.8%)
SL: 80532.13 (-0.9%)
Plan: enter only inside the zone, close 50% at TP1, 25% at TP2, 25% at TP3, and move the stop to entry after TP1.
Note: moderate conviction only, keep size light.
Price holding above the stacked averages
Why LONG? 4/12 signals agree, 0 against.
• Daily trend up (above EMA50 & EMA200)
• Buyers are driving the move (15m ADX 38.0)
• Buyers have the momentum (4h RSI 58.6)
The daily trend is bullish and the 1h price sits just 2.1 ATR above its EMA50, so a long is not stretched.
Where would you place your stop on this level?
Full setup on the chart below.
📲 Want more of my latest signals? Join me here:
https://app.binance.com/uni-qr/D26WbL9t
⚠️ Personal market analysis only. NFA — manage risk and DYOR.
Educational content, not investment advice or a recommendation to buy, sell, deposit, or withdraw any asset. No paid promotion or referral/affiliate links.
4
3
921
·
--
Haussier
Is BNB stretching too far above its average?
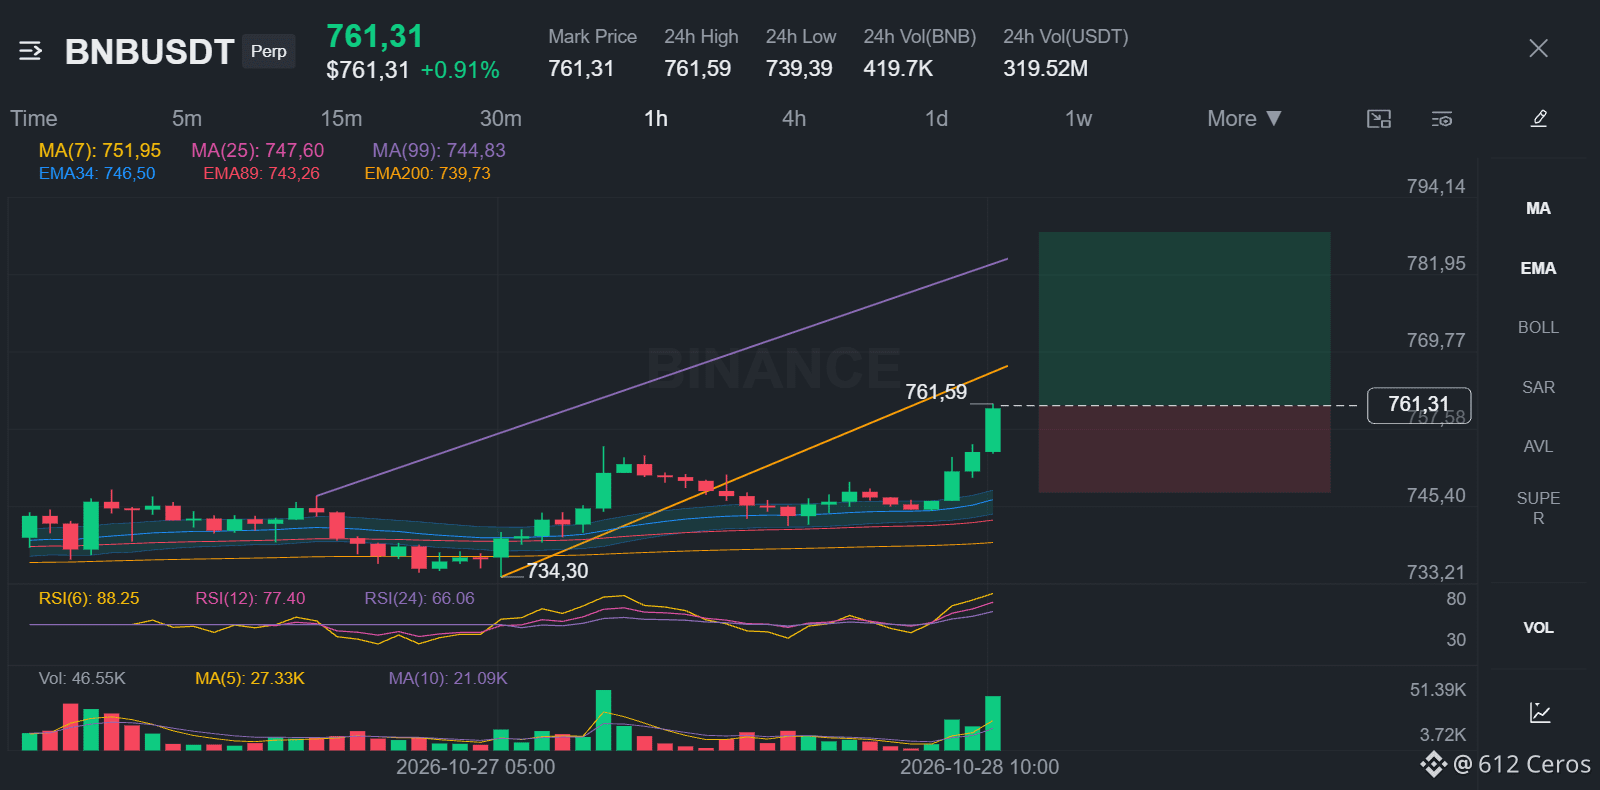
🟢 LONG $BNB /USDT: expecting price to go UP
Bias: LONG · Leaning
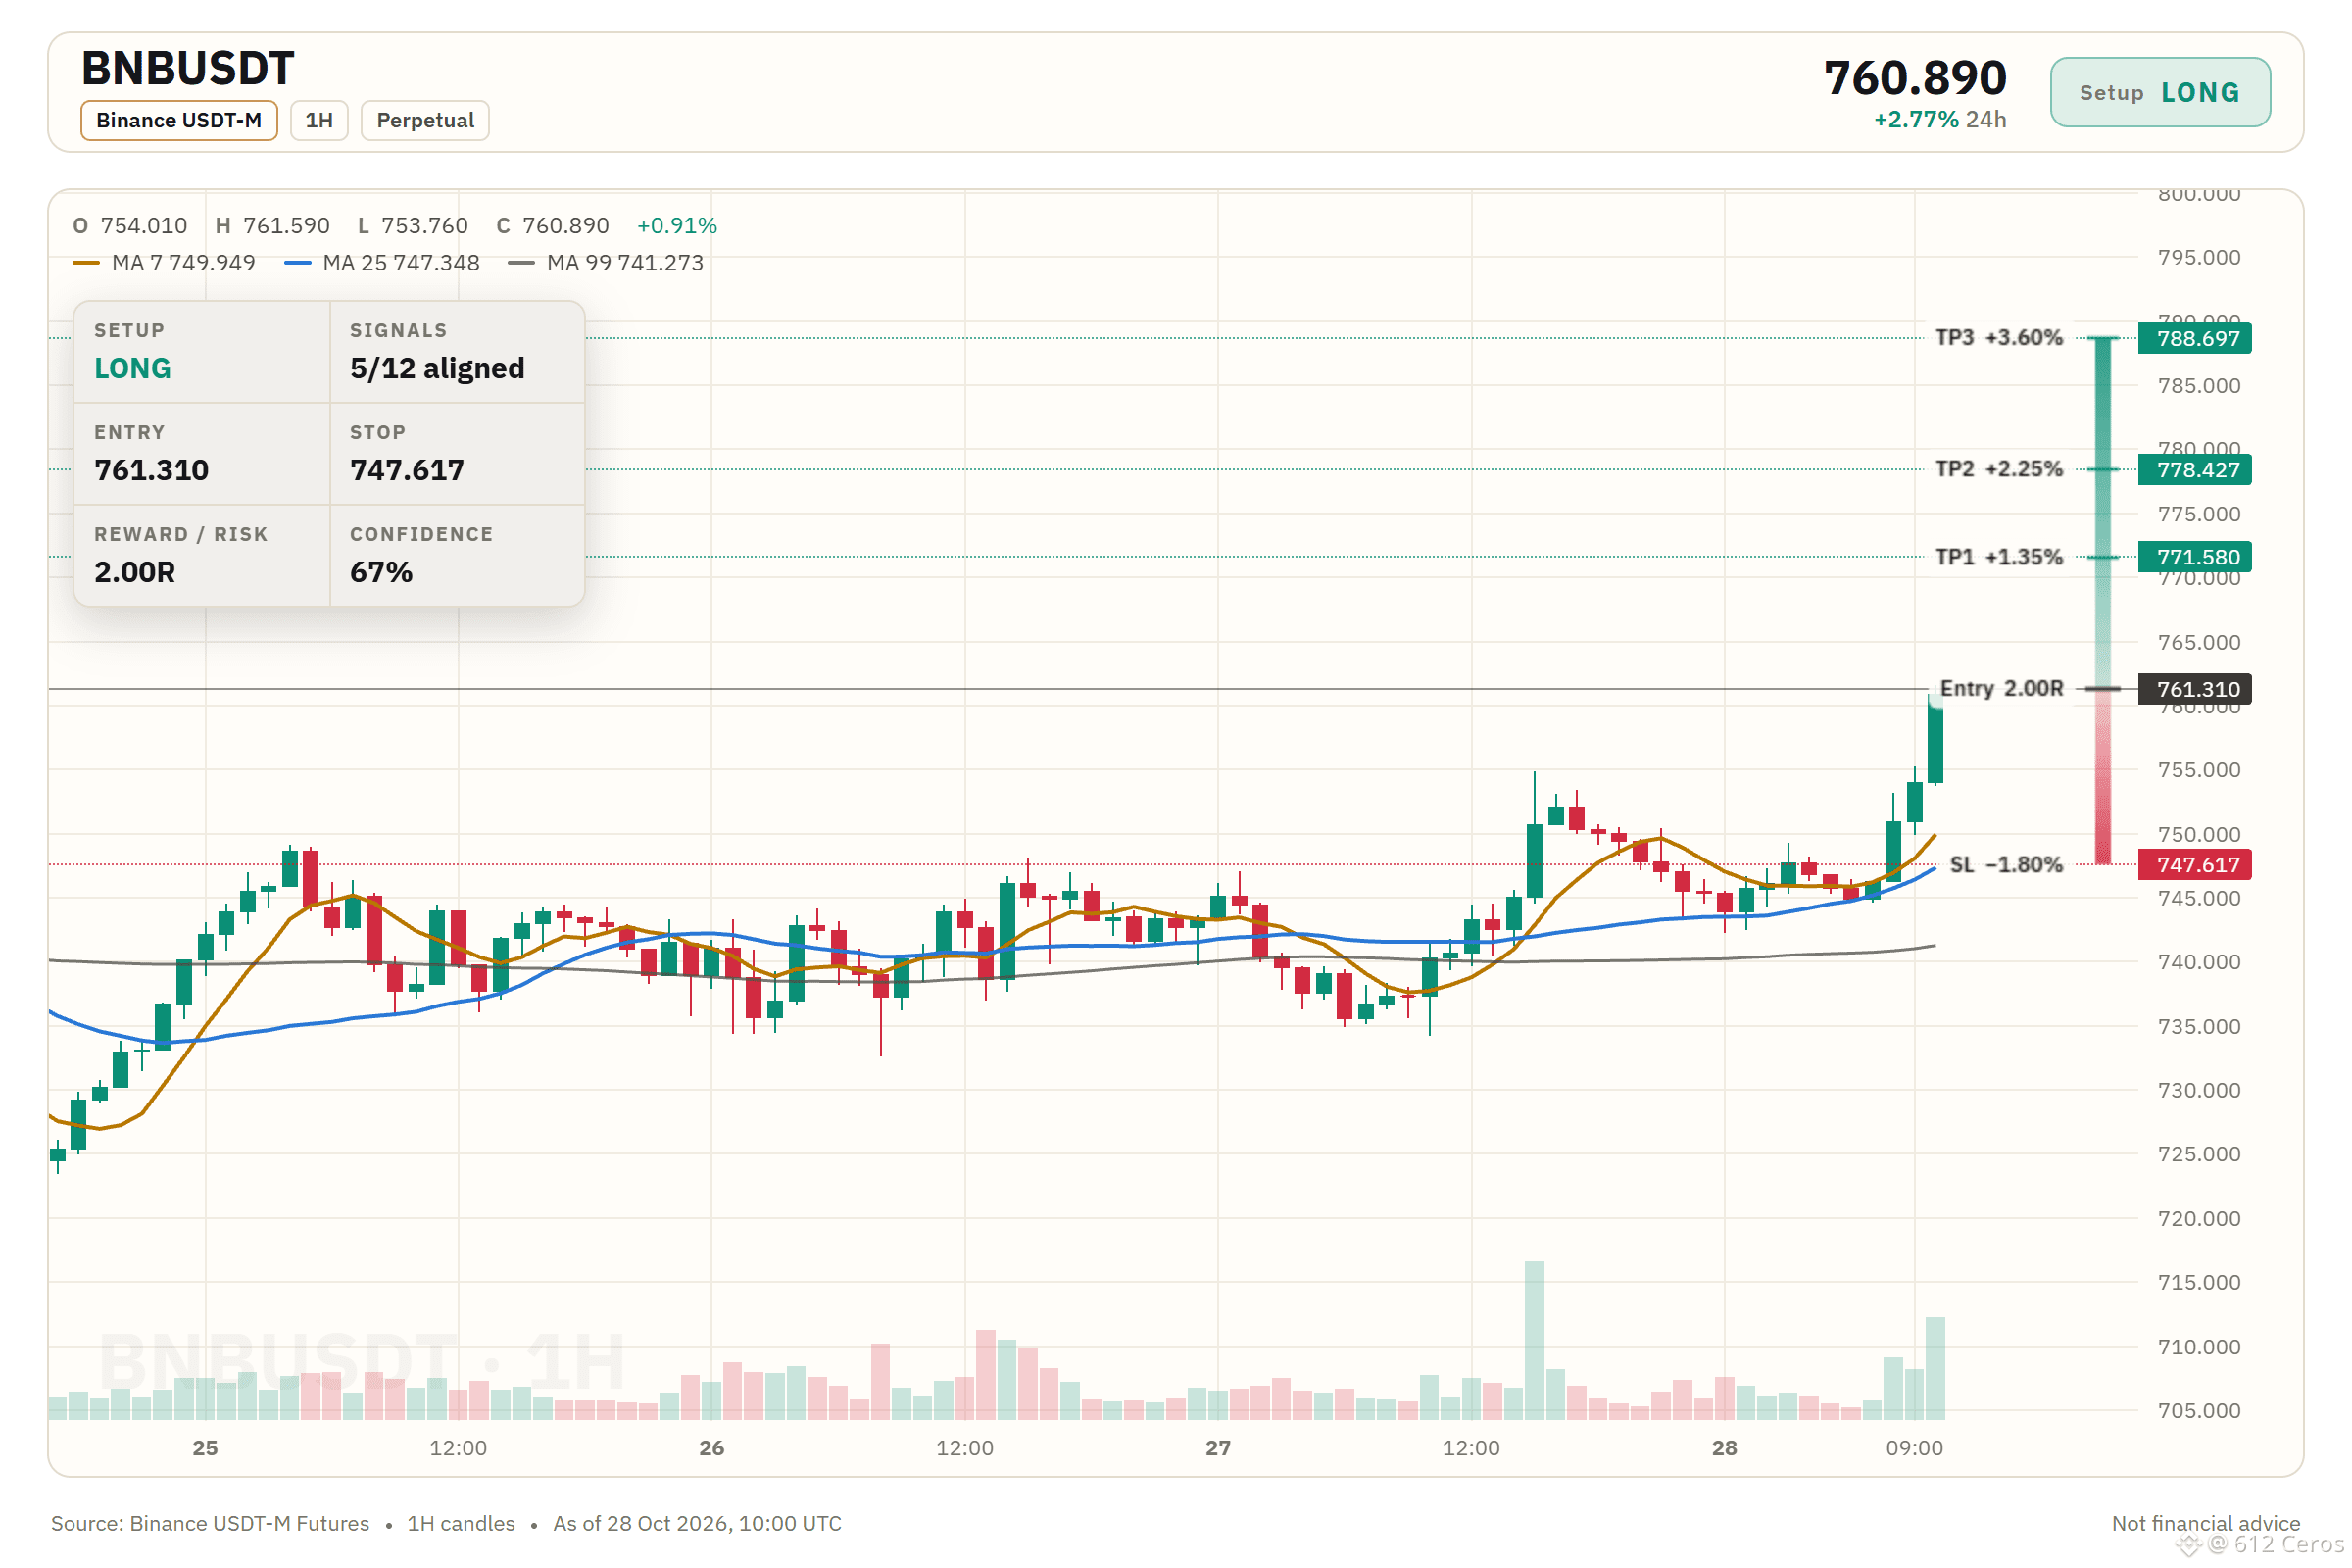
Entry: 760.800 – 761.820
TP1: 771.580 (+1.3%)
TP2: 778.427 (+2.2%)
TP3: 788.697 (+3.6%)
SL: 747.617 (-1.8%)
Plan: enter only inside the zone, close 50% at TP1, 25% at TP2, 25% at TP3, and move the stop to entry after TP1.
Note: moderate conviction only, keep size light.
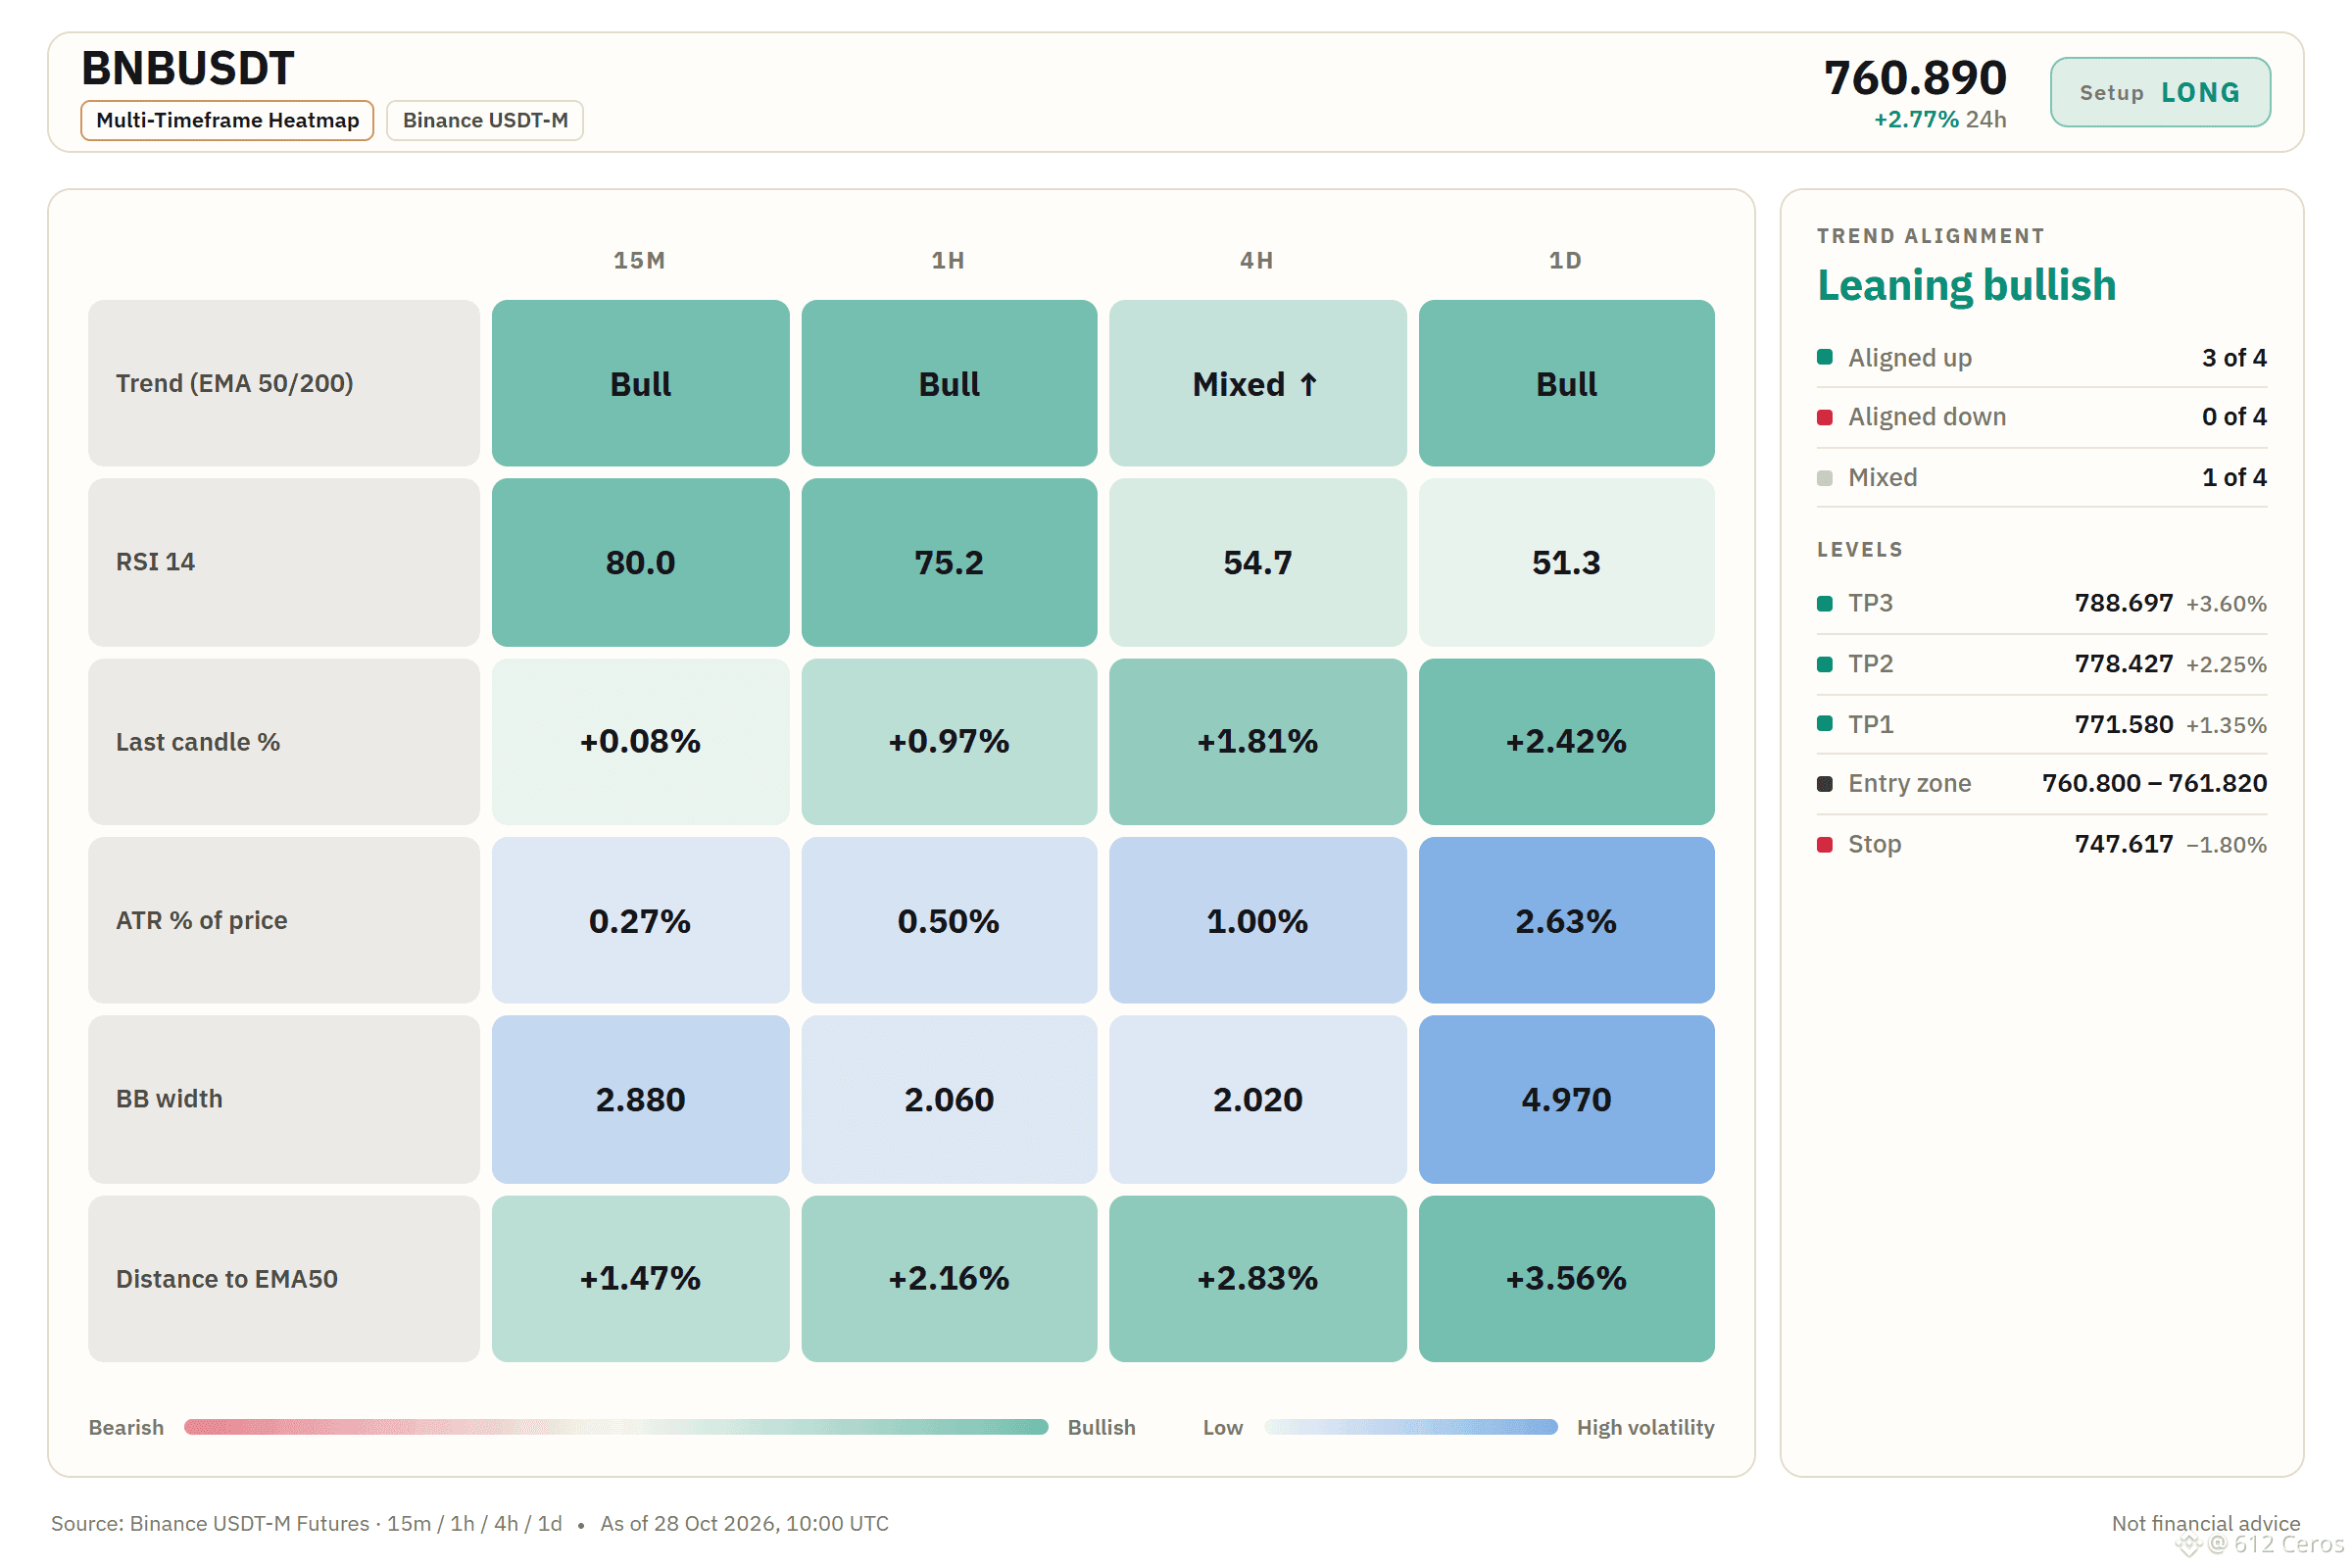
Why LONG? 5/12 signals agree, 1 against.
• Daily trend up (above EMA50 & EMA200)
• 1h trend up (above EMA50 & EMA200)
• Buyers are driving the move (15m ADX 46.0)
Risk: Price ran hot, pullbacks are common from here (1h RSI 75.2, overbought)
Q: Why go long with the daily trend up?
A: The daily trend is bullish with price above both key averages.
Q: When is this long wrong?
A: A pullback is likely because price is 4.2 ATR above its average.
Where would you place your level if you were short?
Full setup on the chart below.
{future}(BNBUSDT)
📲 Want more of my latest signals? Join me here:
[https://app.binance.com/uni-qr/D26WbL9t](https://app.binance.com/uni-qr/D26WbL9t)
⚠️ Personal market analysis only. NFA — manage risk and DYOR.
Educational content, not investment advice or a recommendation to buy, sell, deposit, or withdraw any asset. No paid promotion or referral/affiliate links.
Is BNB stretching too far above its average?
🟢 LONG $BNB /USDT: expecting price to go UP
Bias: LONG · Leaning
Entry: 760.800 – 761.820
TP1: 771.580 (+1.3%)
TP2: 778.427 (+2.2%)
TP3: 788.697 (+3.6%)
SL: 747.617 (-1.8%)
Plan: enter only inside the zone, close 50% at TP1, 25% at TP2, 25% at TP3, and move the stop to entry after TP1.
Note: moderate conviction only, keep size light.
Why LONG? 5/12 signals agree, 1 against.
• Daily trend up (above EMA50 & EMA200)
• 1h trend up (above EMA50 & EMA200)
• Buyers are driving the move (15m ADX 46.0)
Risk: Price ran hot, pullbacks are common from here (1h RSI 75.2, overbought)
Q: Why go long with the daily trend up?
A: The daily trend is bullish with price above both key averages.
Q: When is this long wrong?
A: A pullback is likely because price is 4.2 ATR above its average.
Where would you place your level if you were short?
Full setup on the chart below.
📲 Want more of my latest signals? Join me here:
https://app.binance.com/uni-qr/D26WbL9t
⚠️ Personal market analysis only. NFA — manage risk and DYOR.
Educational content, not investment advice or a recommendation to buy, sell, deposit, or withdraw any asset. No paid promotion or referral/affiliate links.
368
·
--
Haussier
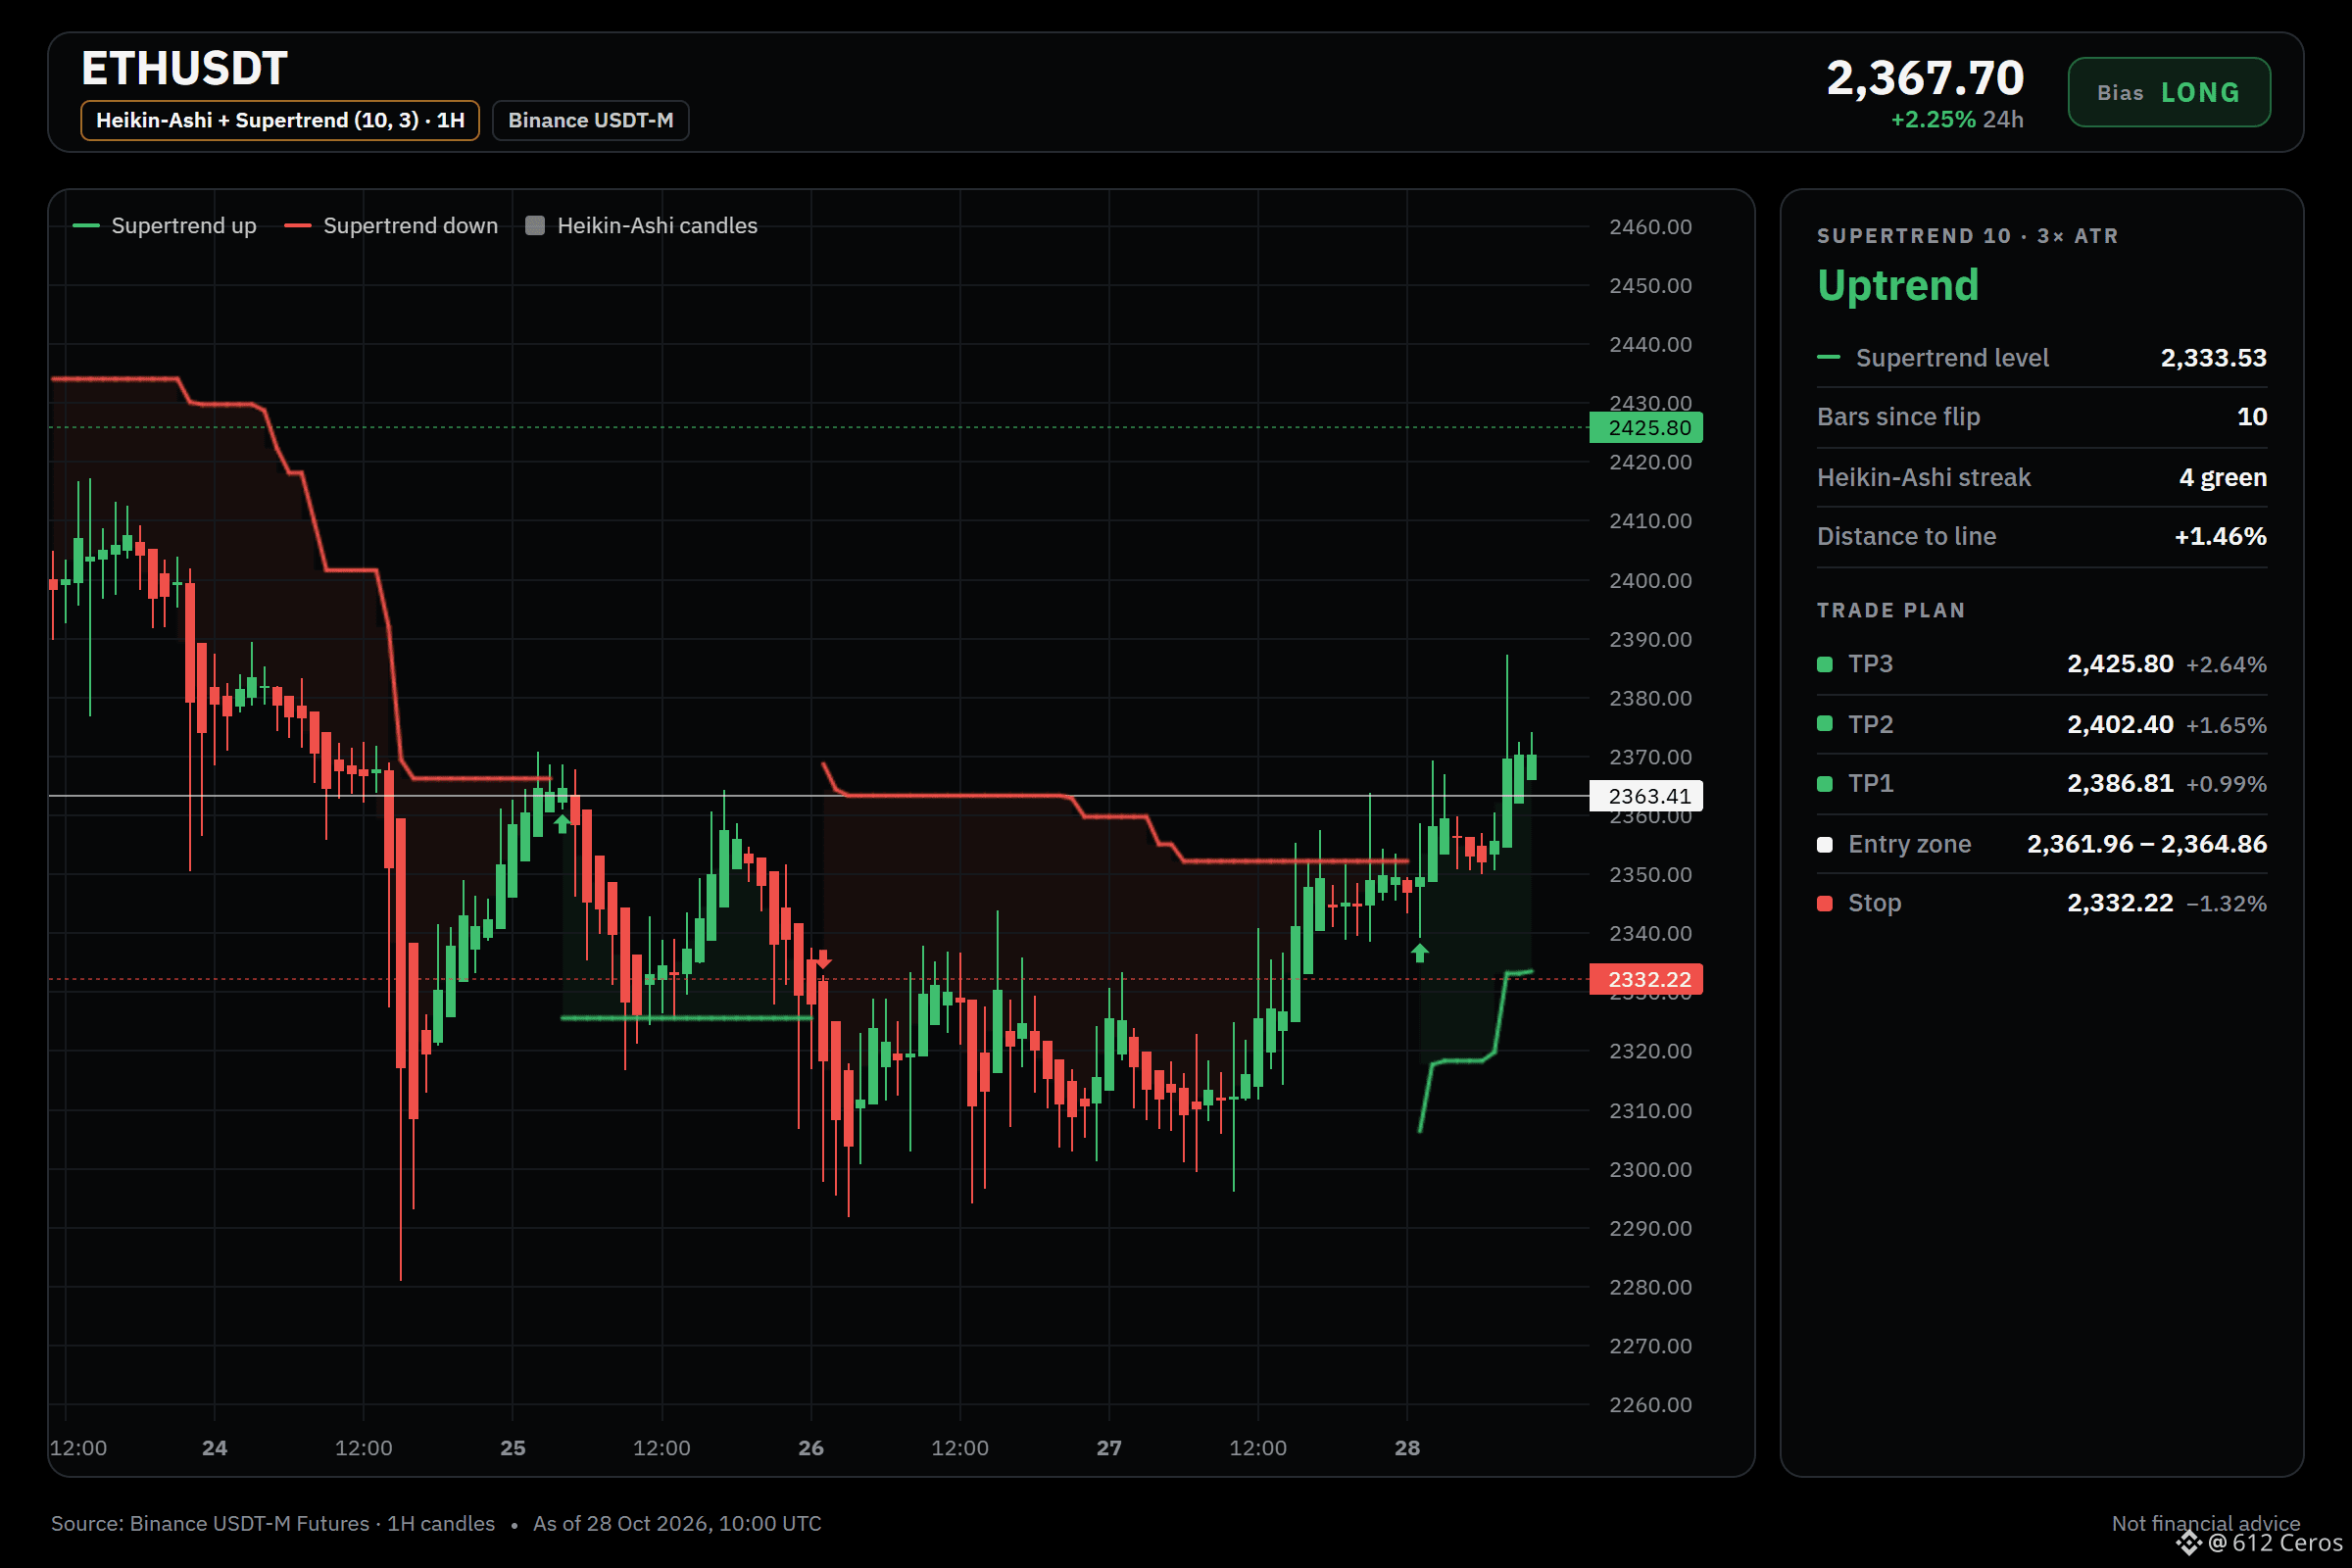
ETH buyers hold the short-term momentum
🟢 LONG $ETH /USDT: expecting price to go UP
Bias: LONG · Leaning
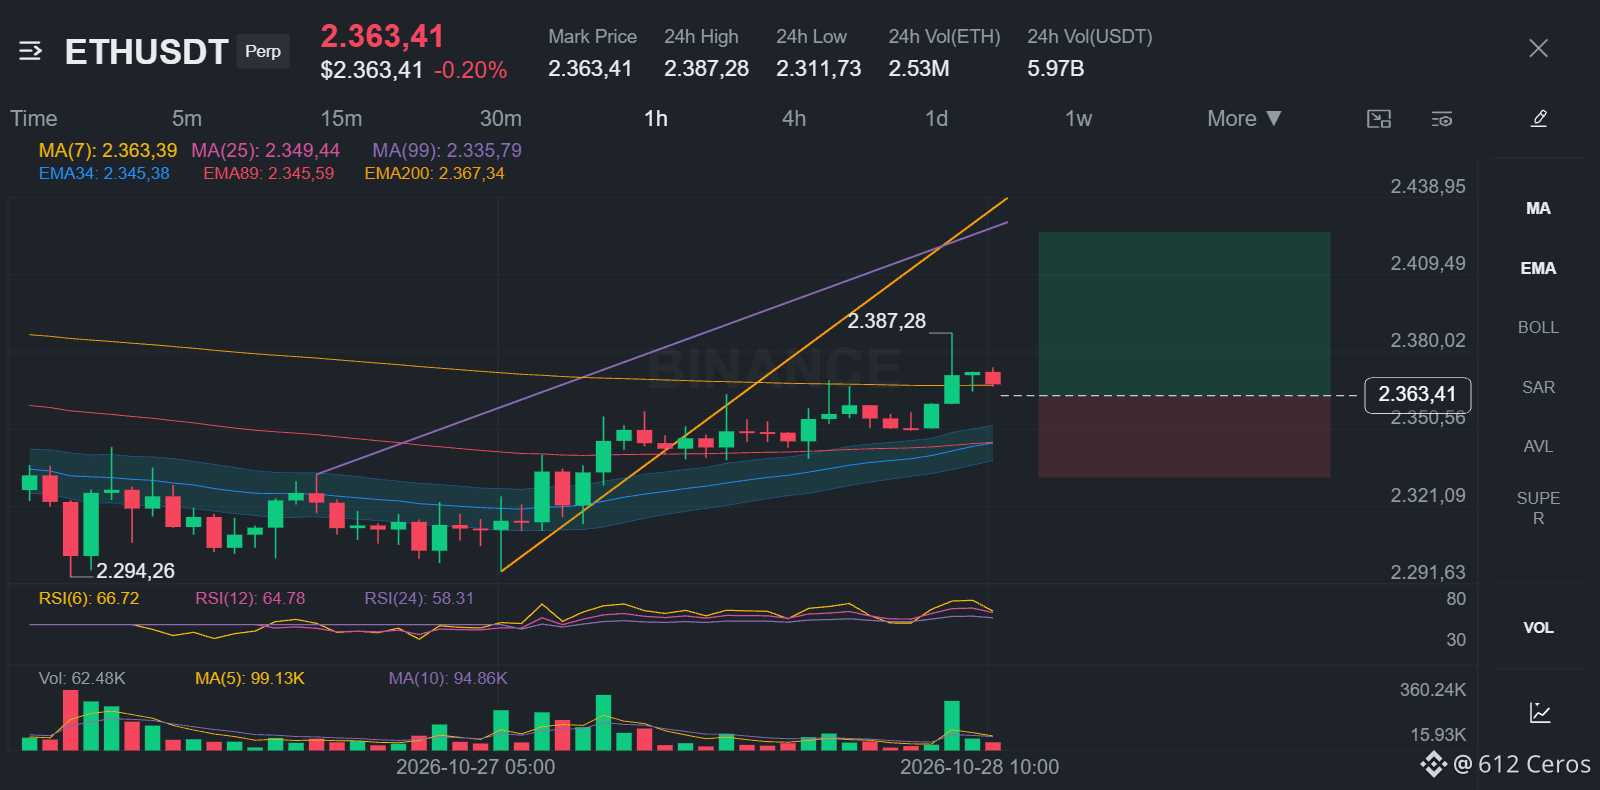
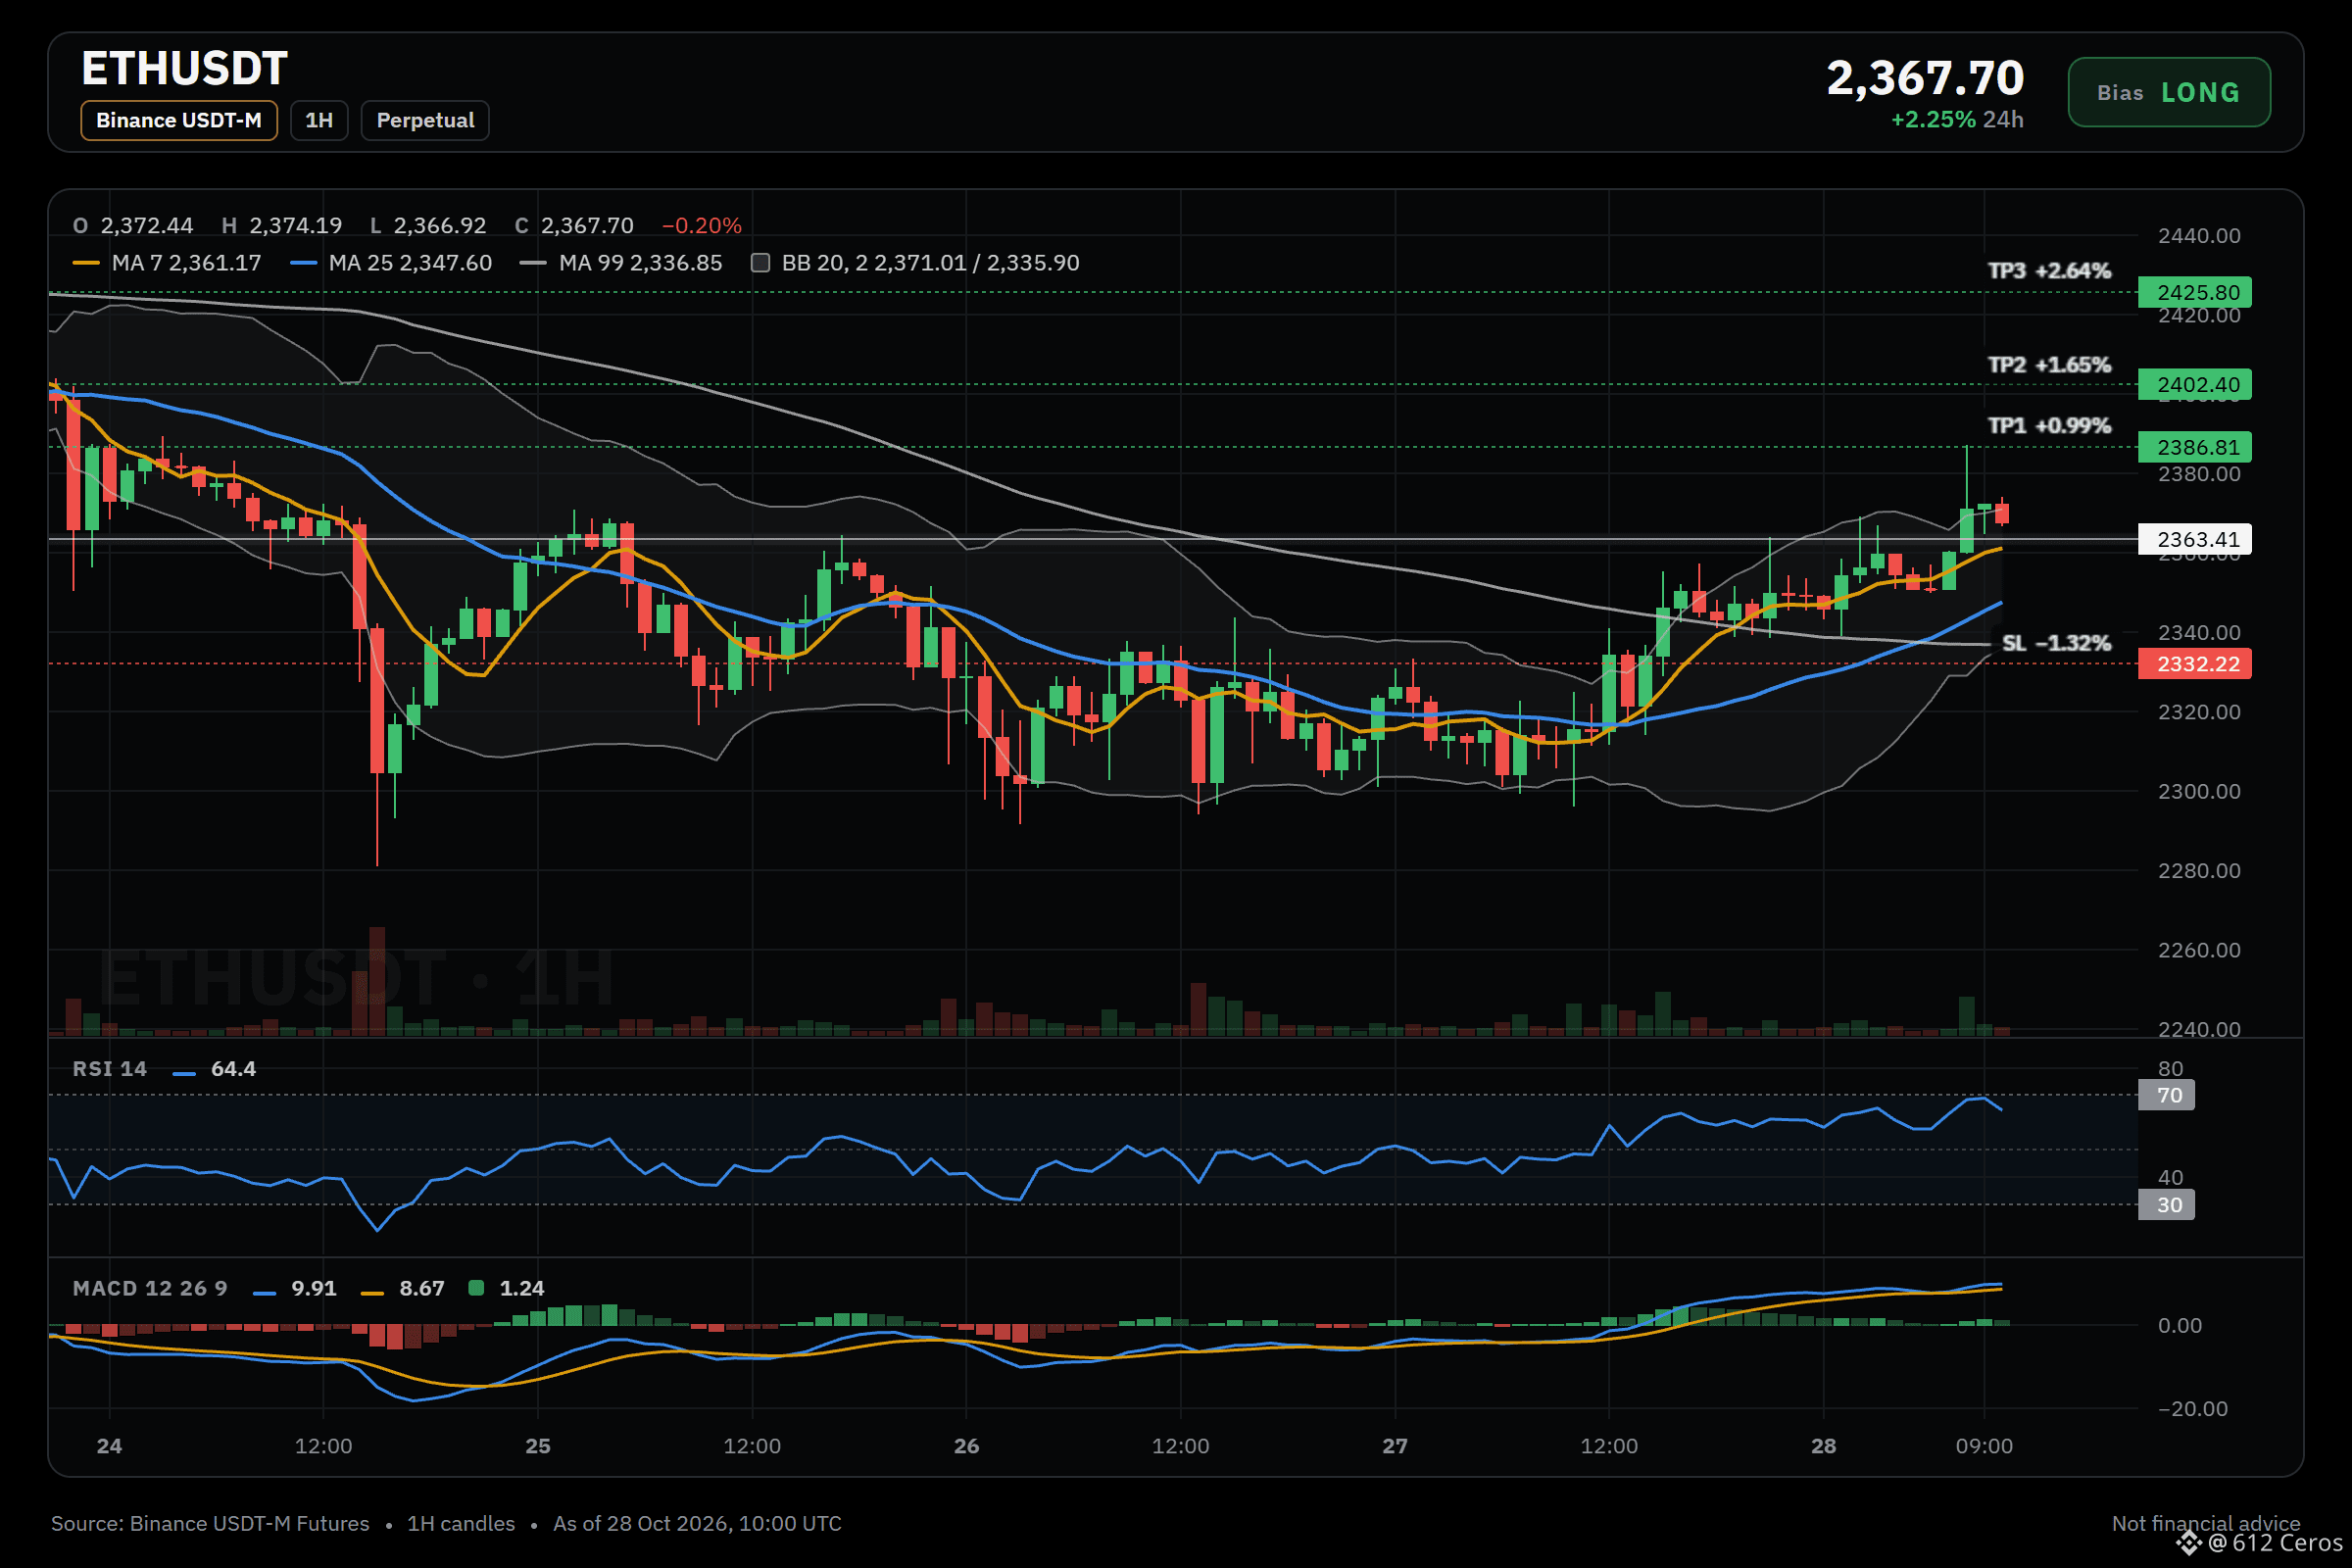
Entry: 2361.96 – 2364.86
TP1: 2386.81 (+1.0%)
TP2: 2402.40 (+1.6%)
TP3: 2425.80 (+2.6%)
SL: 2332.22 (-1.3%)
Plan: enter only inside the zone, close 50% at TP1, 25% at TP2, 25% at TP3, and move the stop to entry after TP1.
Note: moderate conviction only, keep size light.
Why LONG? 3/12 signals agree, 1 against.
• Buyers are driving the move (15m ADX 36.1)
• BTC is rising, this coin follows (corr 0.91)
• Buyers have the momentum (1h RSI 64.4)
Risk: 4h trend down (below EMA50 & EMA200)
Why I like it:
ETH is a long with a leaning conviction, because the 1h price shows buyers are in control with strong trend strength. The daily trend is range-bound, which means the swing trend is not yet in your favor. You are trading a short-term move inside a larger range.
Where do you place your invalidation level?
Full setup on the chart below.
{future}(ETHUSDT)
📲 Want more of my latest signals? Join me here:
[https://app.binance.com/uni-qr/D26WbL9t](https://app.binance.com/uni-qr/D26WbL9t)
⚠️ Personal market analysis only. NFA — manage risk and DYOR.
Educational content, not investment advice or a recommendation to buy, sell, deposit, or withdraw any asset. No paid promotion or referral/affiliate links.
ETH buyers hold the short-term momentum
🟢 LONG $ETH /USDT: expecting price to go UP
Bias: LONG · Leaning
Entry: 2361.96 – 2364.86
TP1: 2386.81 (+1.0%)
TP2: 2402.40 (+1.6%)
TP3: 2425.80 (+2.6%)
SL: 2332.22 (-1.3%)
Plan: enter only inside the zone, close 50% at TP1, 25% at TP2, 25% at TP3, and move the stop to entry after TP1.
Note: moderate conviction only, keep size light.
Why LONG? 3/12 signals agree, 1 against.
• Buyers are driving the move (15m ADX 36.1)
• BTC is rising, this coin follows (corr 0.91)
• Buyers have the momentum (1h RSI 64.4)
Risk: 4h trend down (below EMA50 & EMA200)
Why I like it:
ETH is a long with a leaning conviction, because the 1h price shows buyers are in control with strong trend strength. The daily trend is range-bound, which means the swing trend is not yet in your favor. You are trading a short-term move inside a larger range.
Where do you place your invalidation level?
Full setup on the chart below.
📲 Want more of my latest signals? Join me here:
https://app.binance.com/uni-qr/D26WbL9t
⚠️ Personal market analysis only. NFA — manage risk and DYOR.
Educational content, not investment advice or a recommendation to buy, sell, deposit, or withdraw any asset. No paid promotion or referral/affiliate links.
441
·
--
Haussier
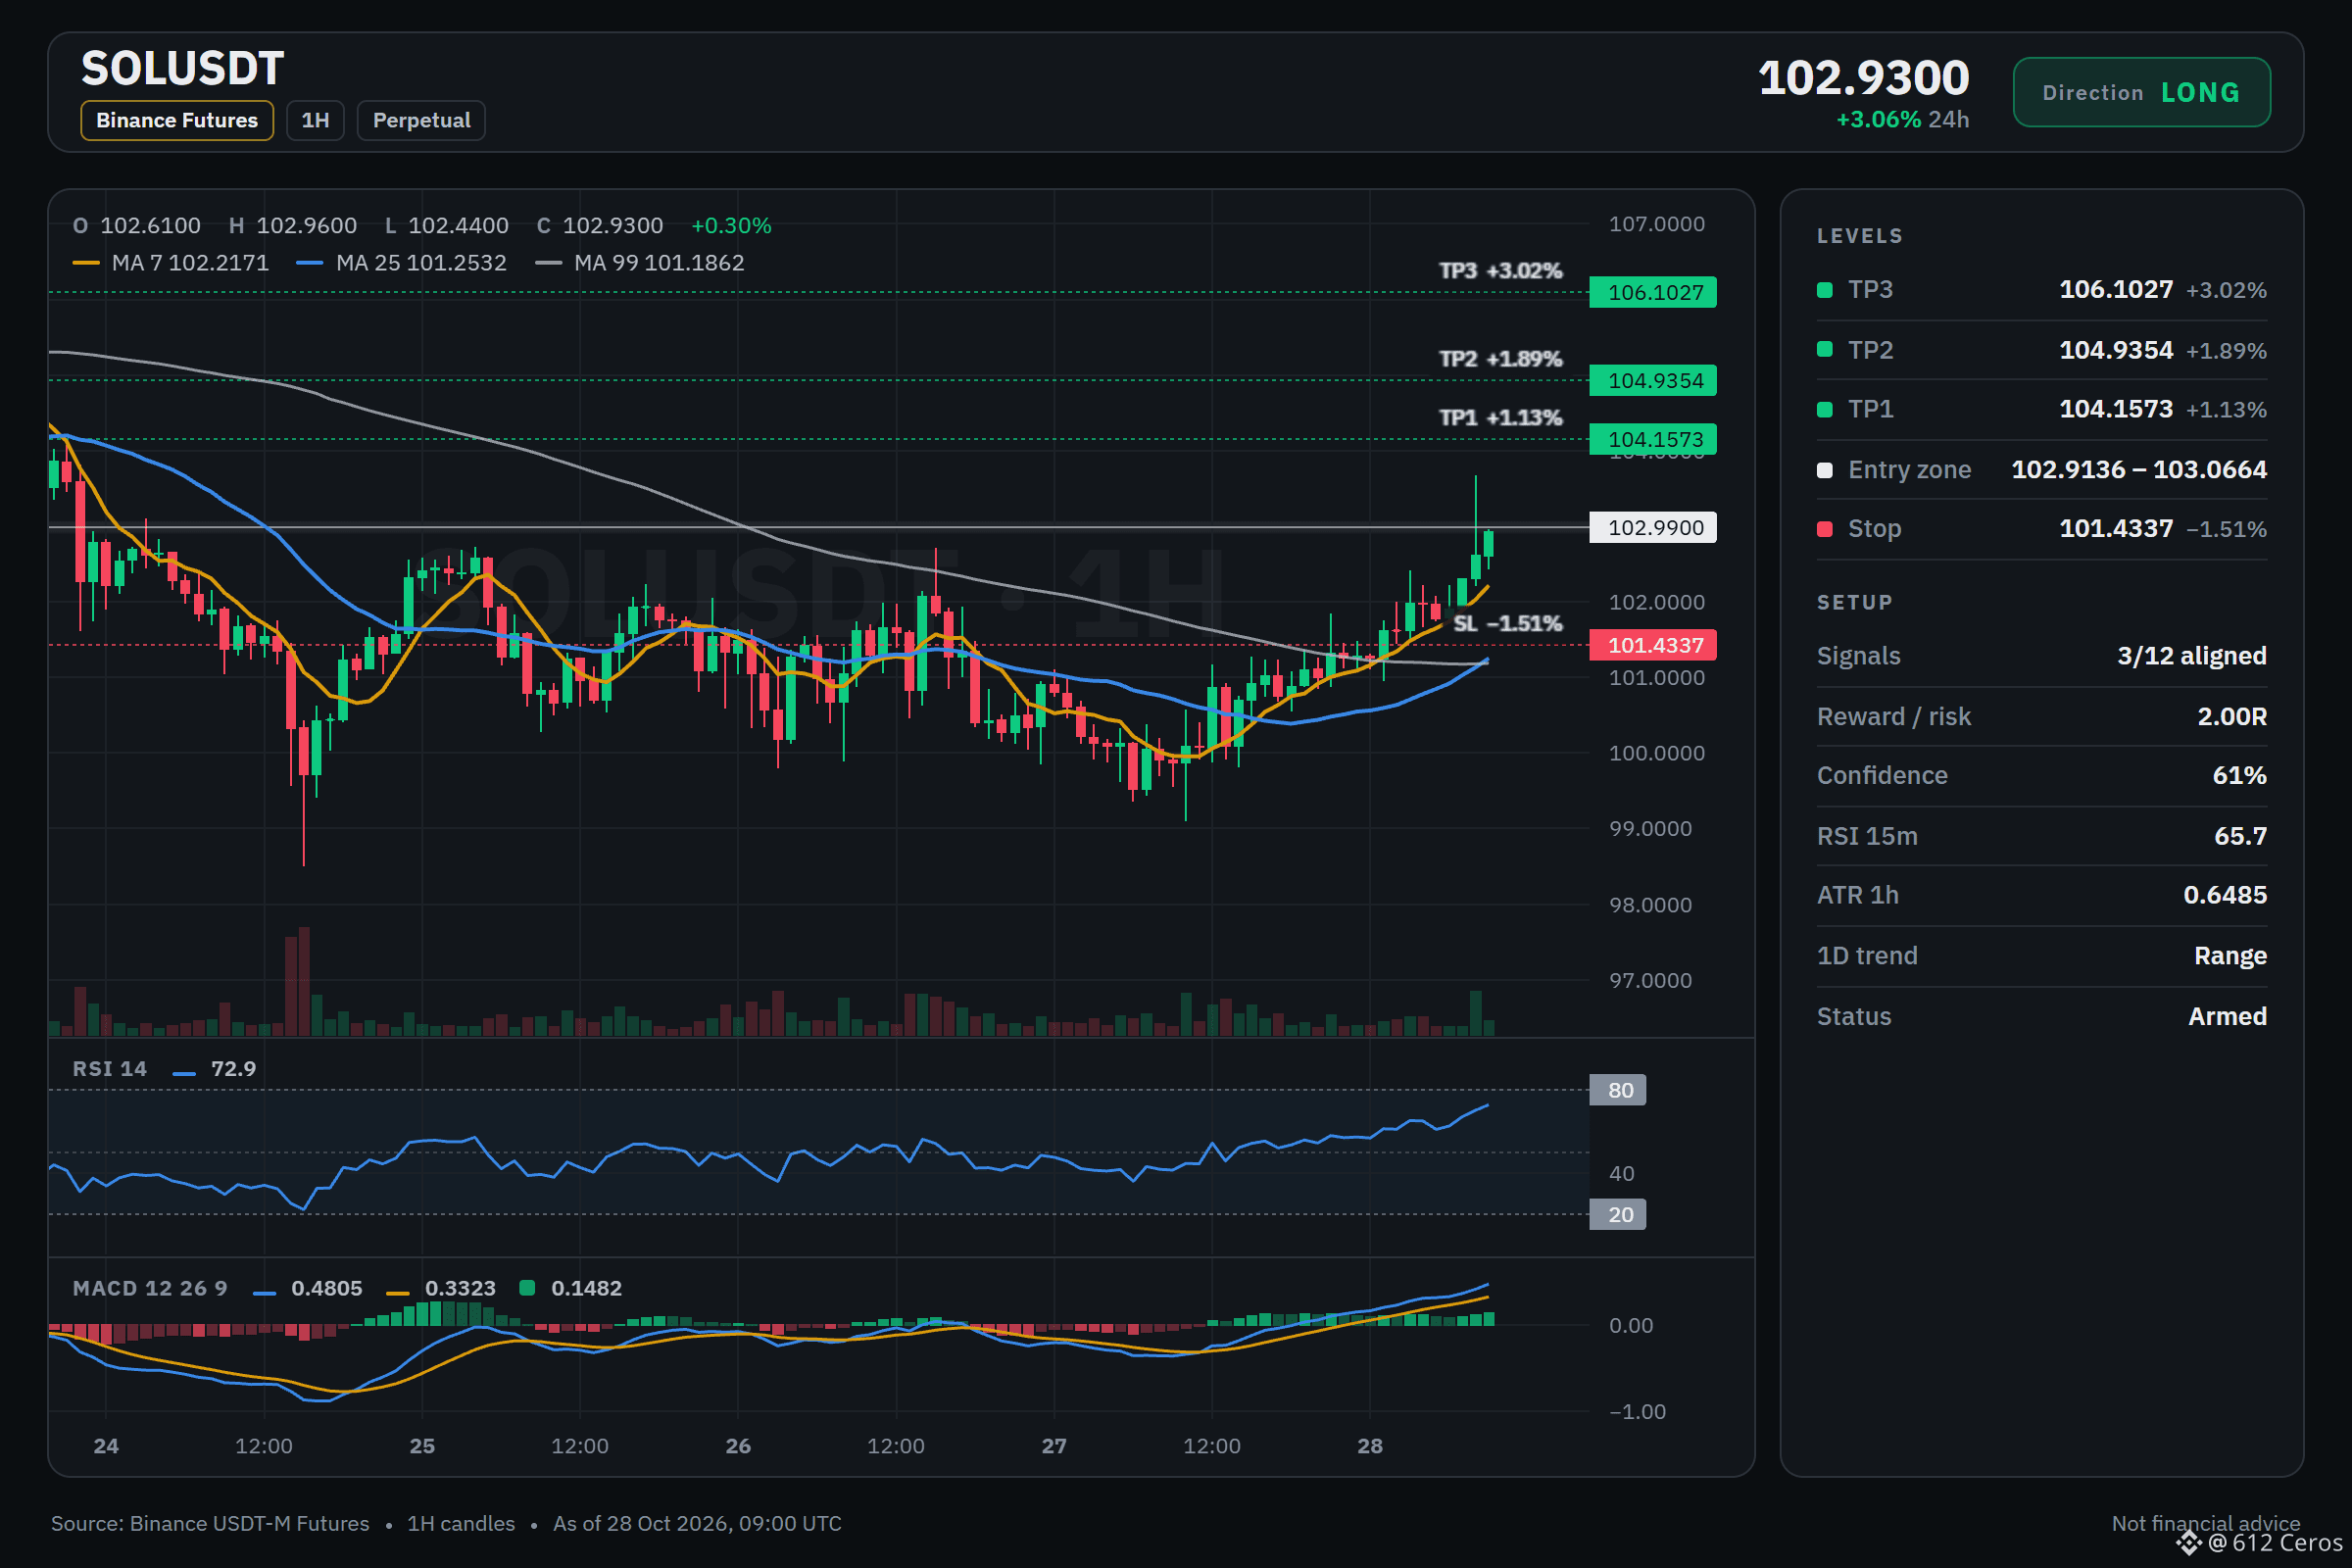
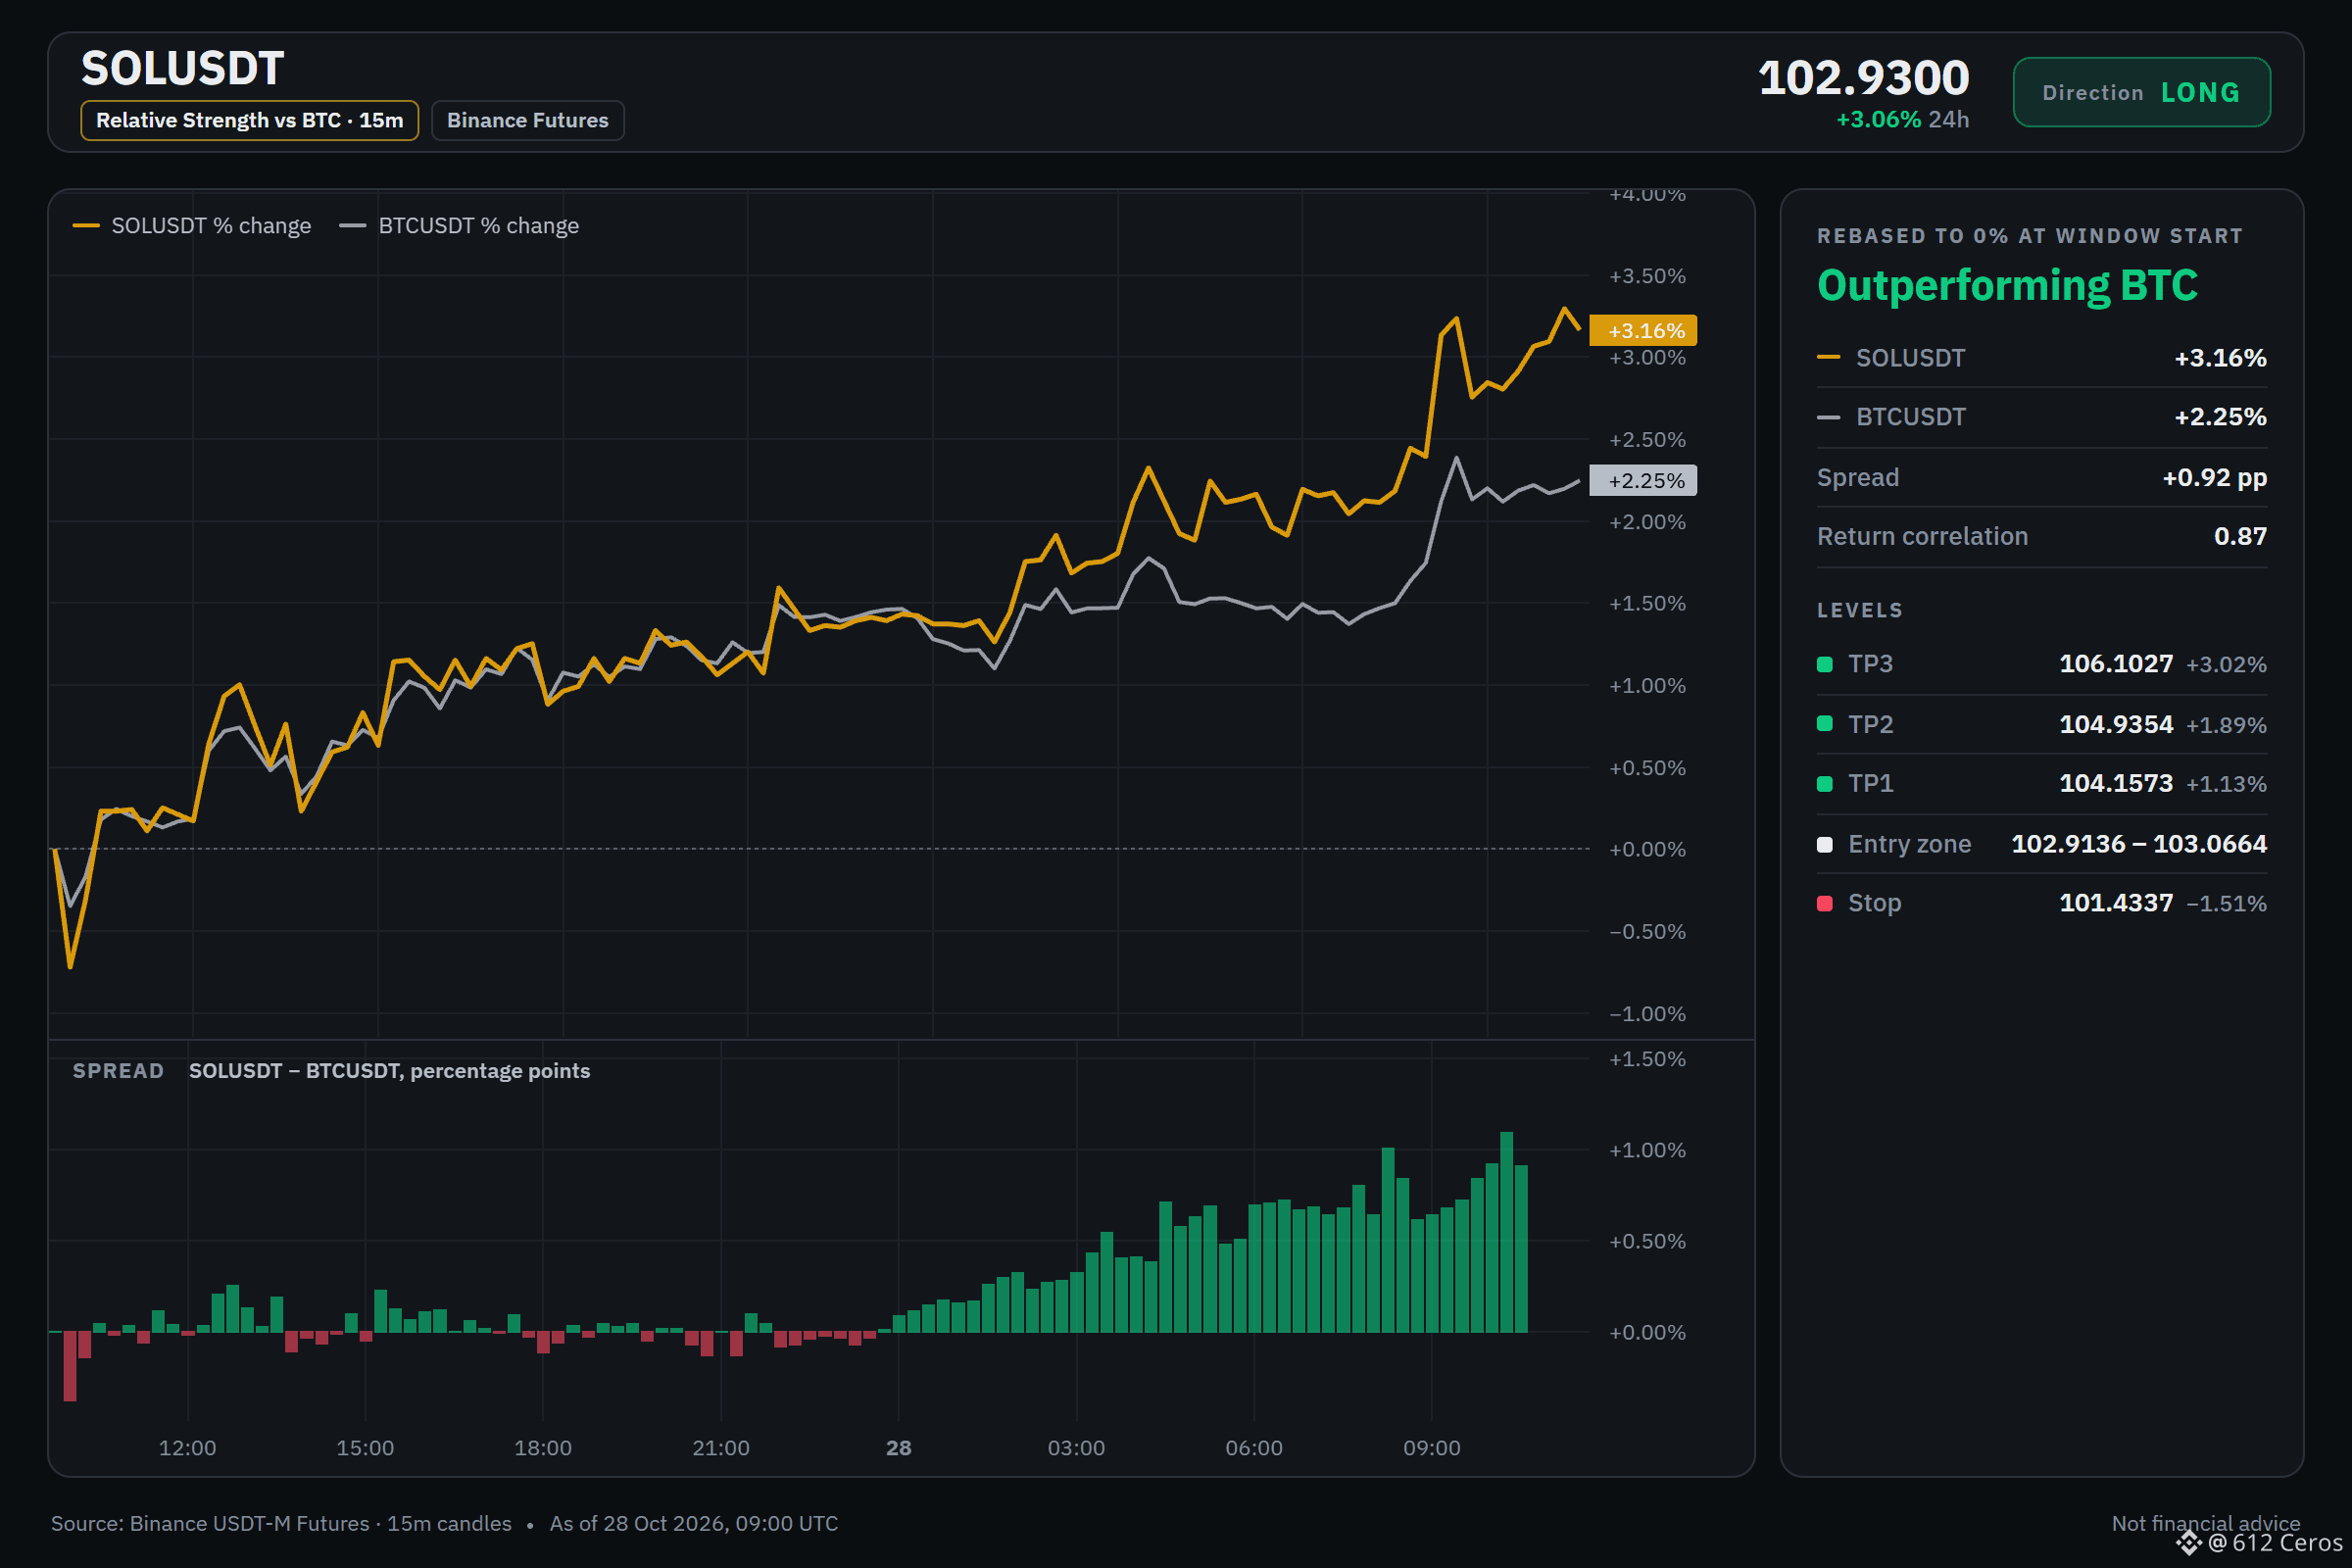
Range-bound daily trend does not rule out a long on SOL
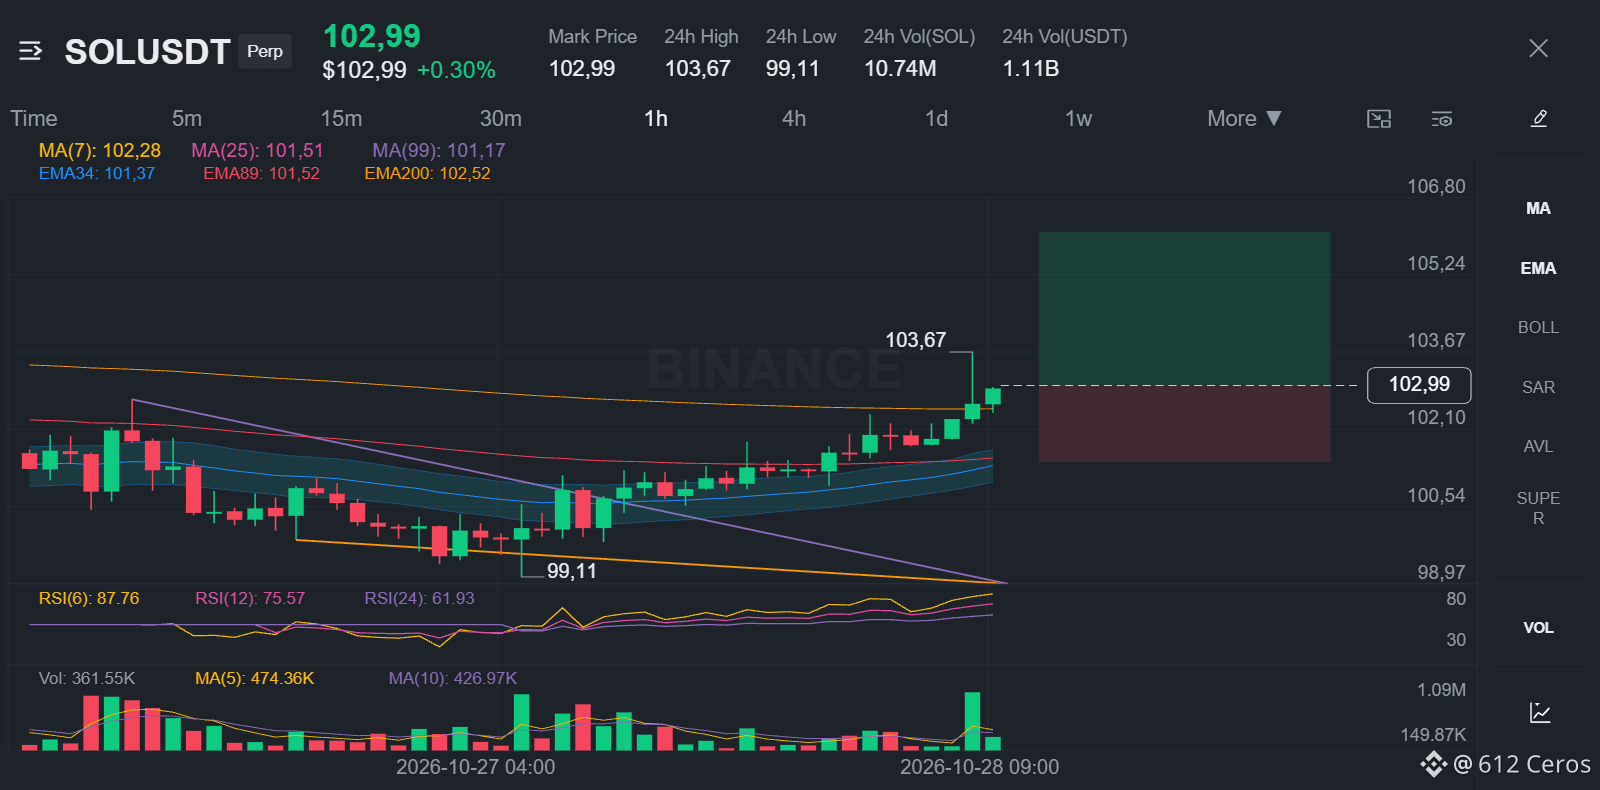
🟢 LONG $SOL /USDT: expecting price to go UP
Bias: LONG · Leaning
Entry: 102.9136 – 103.0664
TP1: 104.1573 (+1.1%)
TP2: 104.9354 (+1.9%)
TP3: 106.1027 (+3.0%)
SL: 101.4337 (-1.5%)
Plan: enter only inside the zone, close 50% at TP1, 25% at TP2, 25% at TP3, and move the stop to entry after TP1.
Note: moderate conviction only, keep size light.
Why LONG? 3/12 signals agree, 0 against.
• Buyers are driving the move (15m ADX 44.9)
• BTC is rising, this coin follows (corr 0.82)
• Buyers have the momentum (1h RSI 72.9)
If it plays out:
If the setup works, SOL should push toward the first target, supported by the 1h RSI showing buyers still have momentum.
If it fails:
A break below the stop invalidates the idea, and I would exit immediately.
What level would make you hesitant here?
Chart with every level below.
{future}(SOLUSDT)
📲 Want more of my latest signals? Join me here:
[https://app.binance.com/uni-qr/D26WbL9t](https://app.binance.com/uni-qr/D26WbL9t)
⚠️ Personal market analysis only. NFA — manage risk and DYOR.
Educational content, not investment advice or a recommendation to buy, sell, deposit, or withdraw any asset. No paid promotion or referral/affiliate links.
Range-bound daily trend does not rule out a long on SOL
🟢 LONG $SOL /USDT: expecting price to go UP
Bias: LONG · Leaning
Entry: 102.9136 – 103.0664
TP1: 104.1573 (+1.1%)
TP2: 104.9354 (+1.9%)
TP3: 106.1027 (+3.0%)
SL: 101.4337 (-1.5%)
Plan: enter only inside the zone, close 50% at TP1, 25% at TP2, 25% at TP3, and move the stop to entry after TP1.
Note: moderate conviction only, keep size light.
Why LONG? 3/12 signals agree, 0 against.
• Buyers are driving the move (15m ADX 44.9)
• BTC is rising, this coin follows (corr 0.82)
• Buyers have the momentum (1h RSI 72.9)
If it plays out:
If the setup works, SOL should push toward the first target, supported by the 1h RSI showing buyers still have momentum.
If it fails:
A break below the stop invalidates the idea, and I would exit immediately.
What level would make you hesitant here?
Chart with every level below.
📲 Want more of my latest signals? Join me here:
https://app.binance.com/uni-qr/D26WbL9t
⚠️ Personal market analysis only. NFA — manage risk and DYOR.
Educational content, not investment advice or a recommendation to buy, sell, deposit, or withdraw any asset. No paid promotion or referral/affiliate links.
3
1.3k
·
--
Haussier
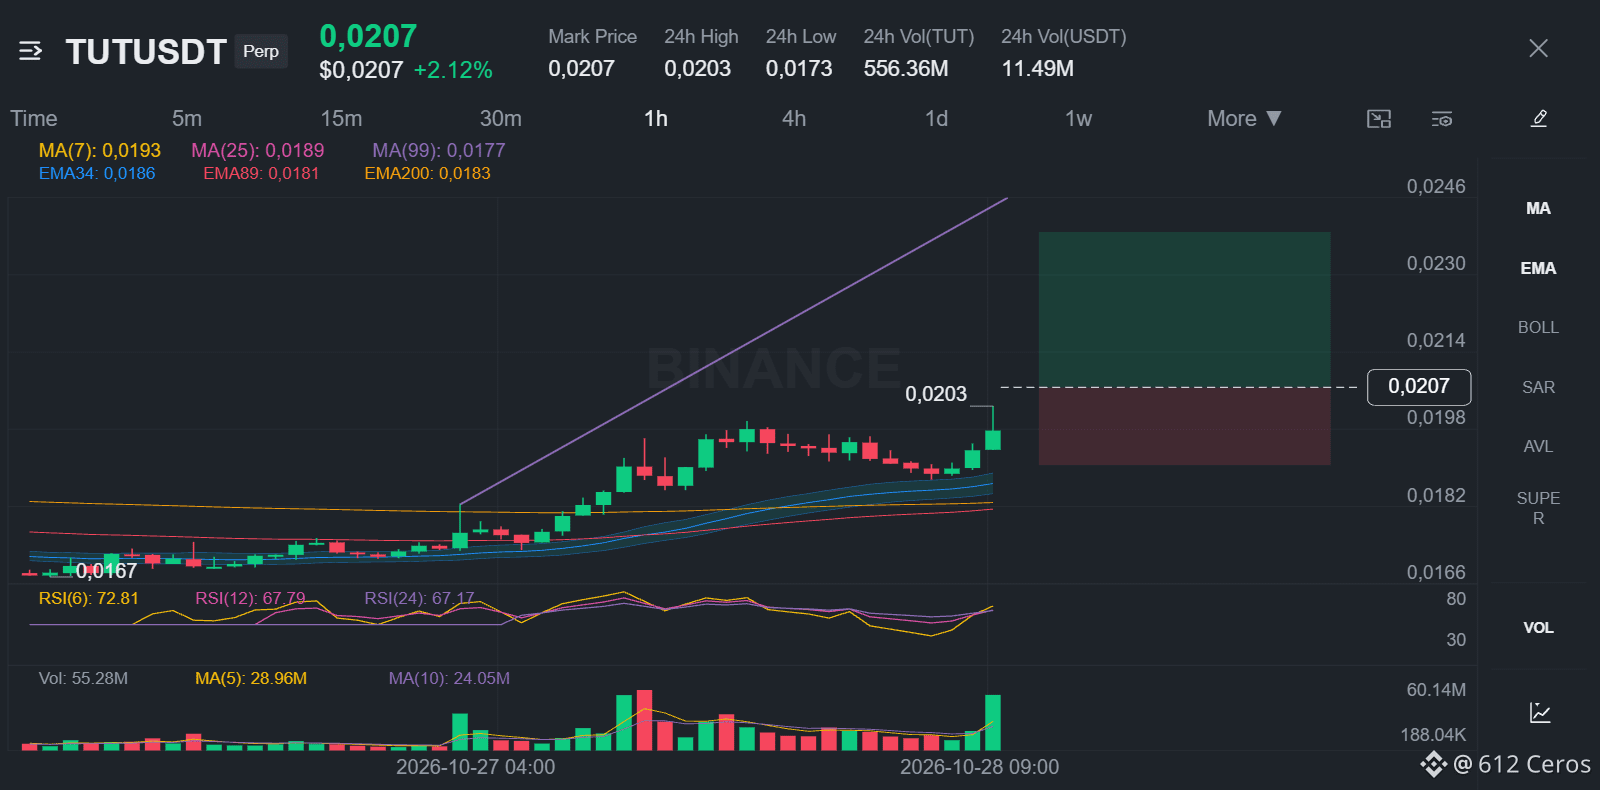
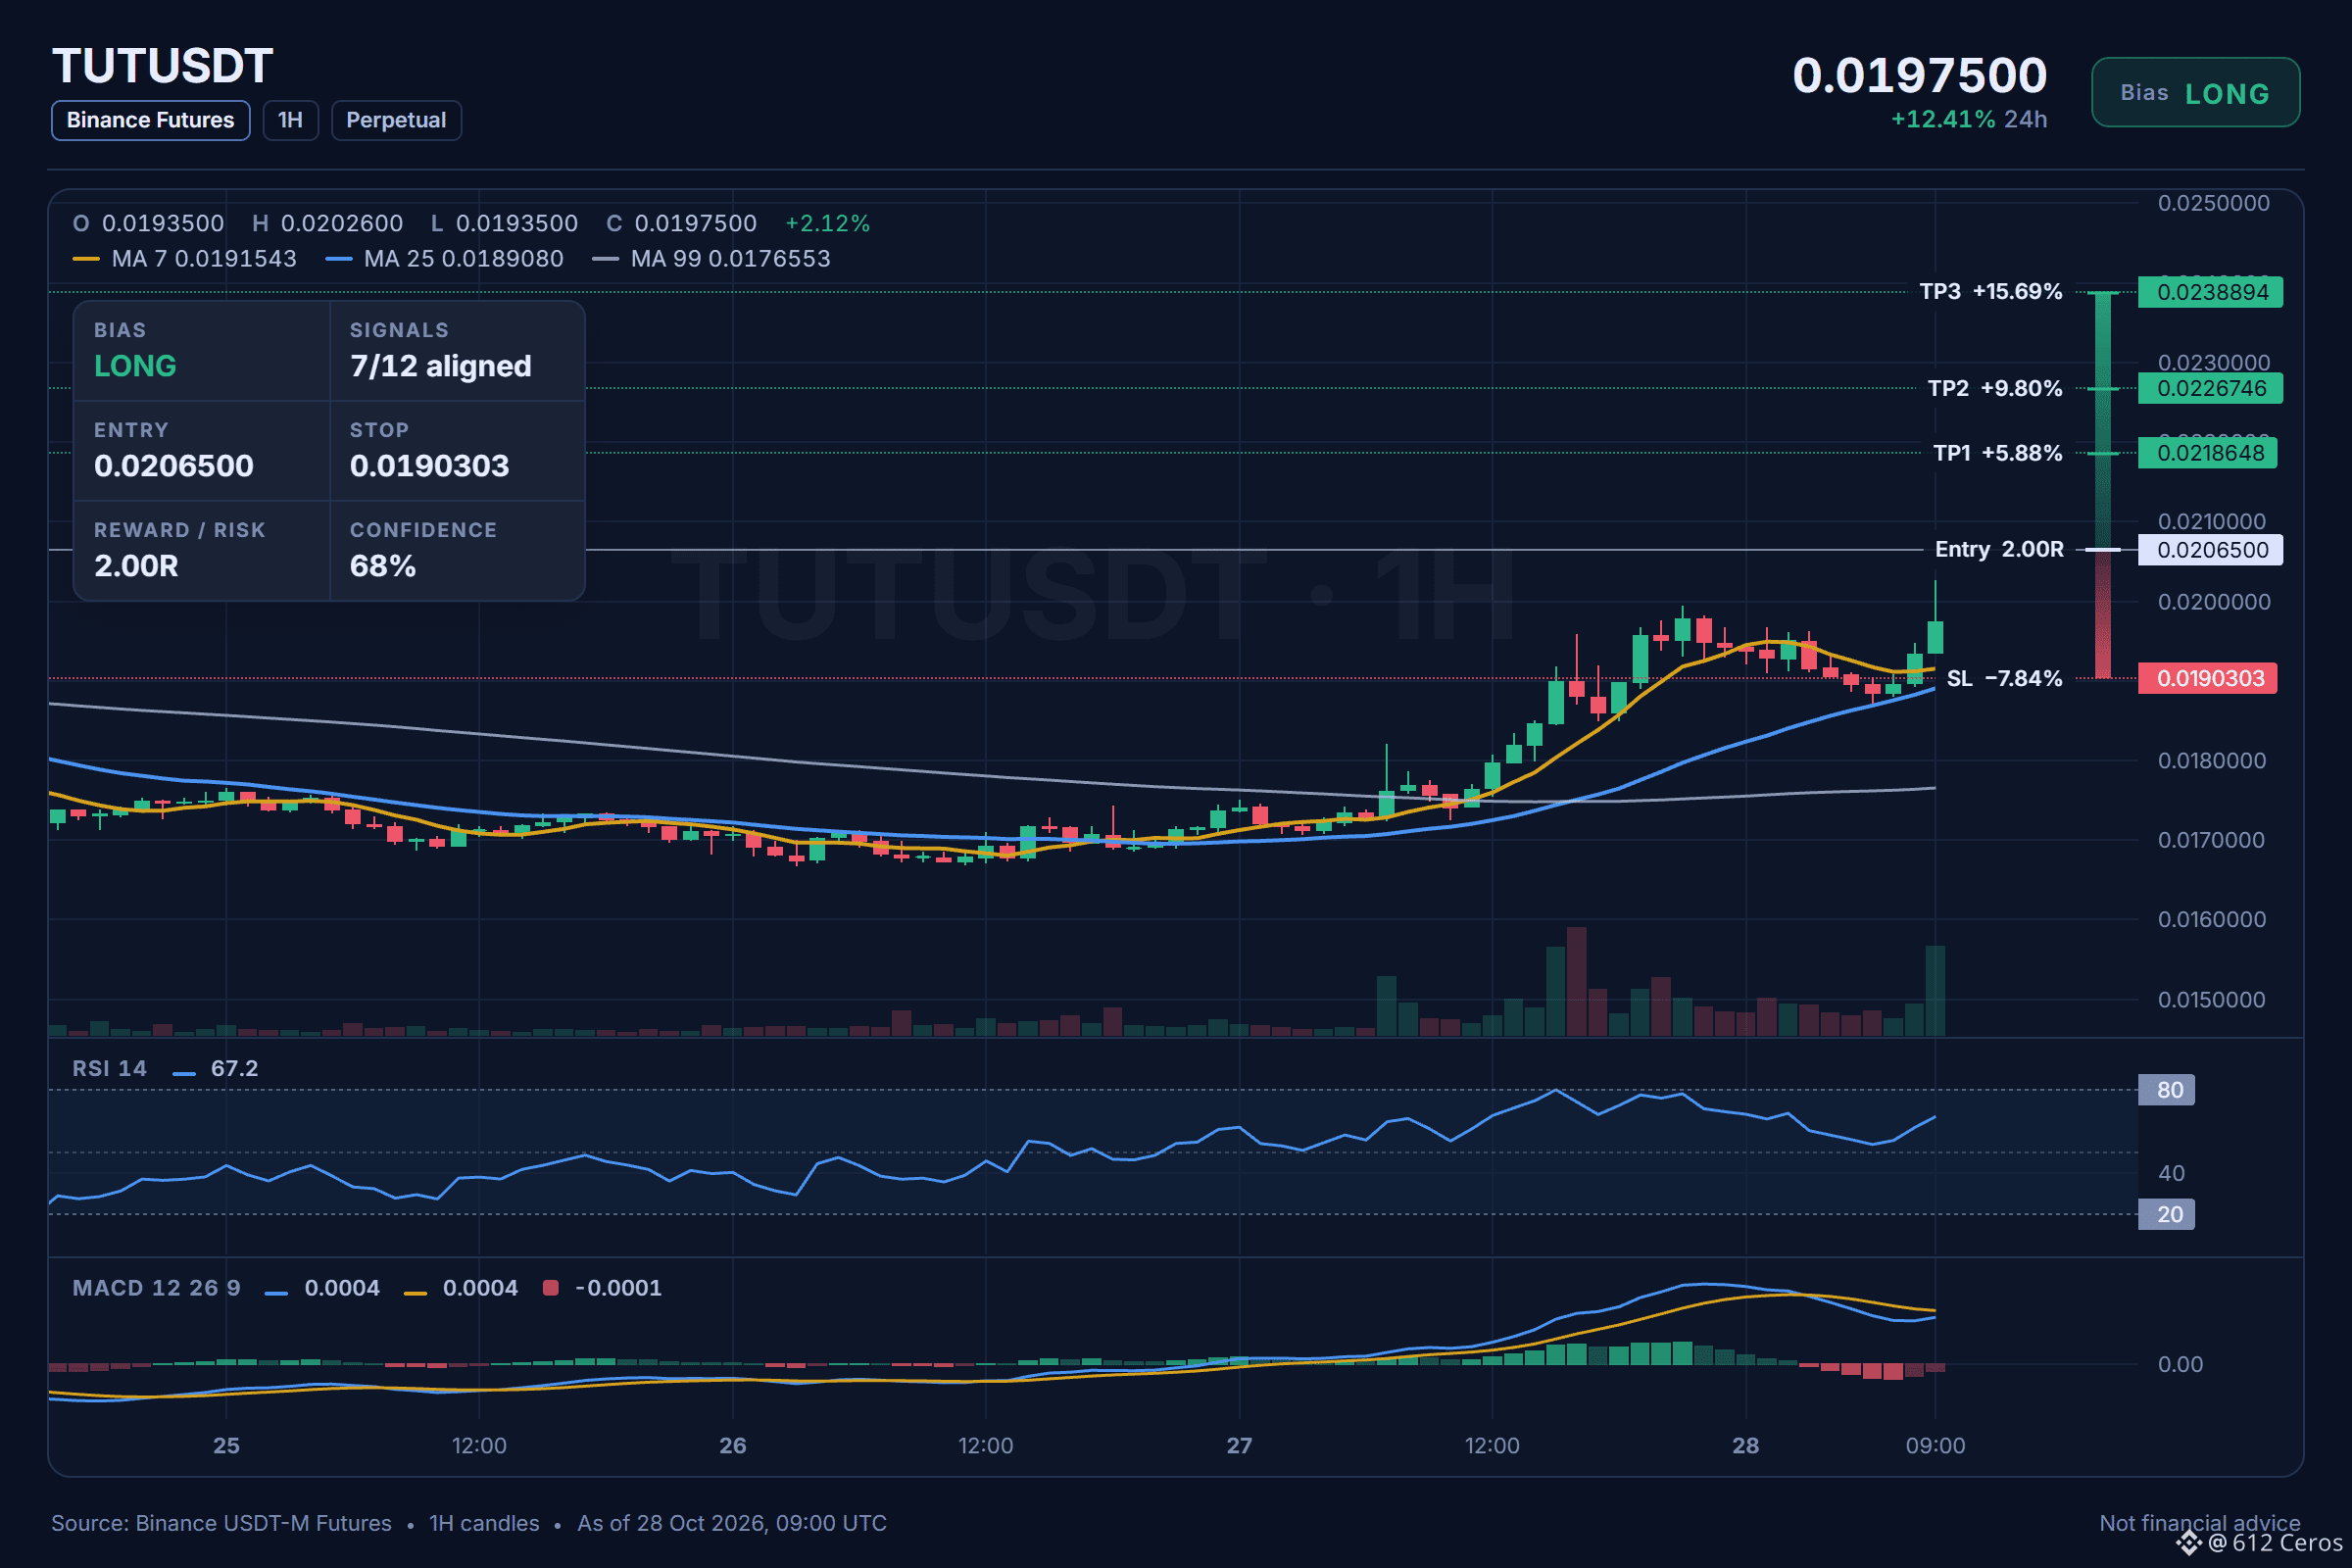
🟢 LONG $TUT /USDT: expecting price to go UP
Bias: LONG · Strong
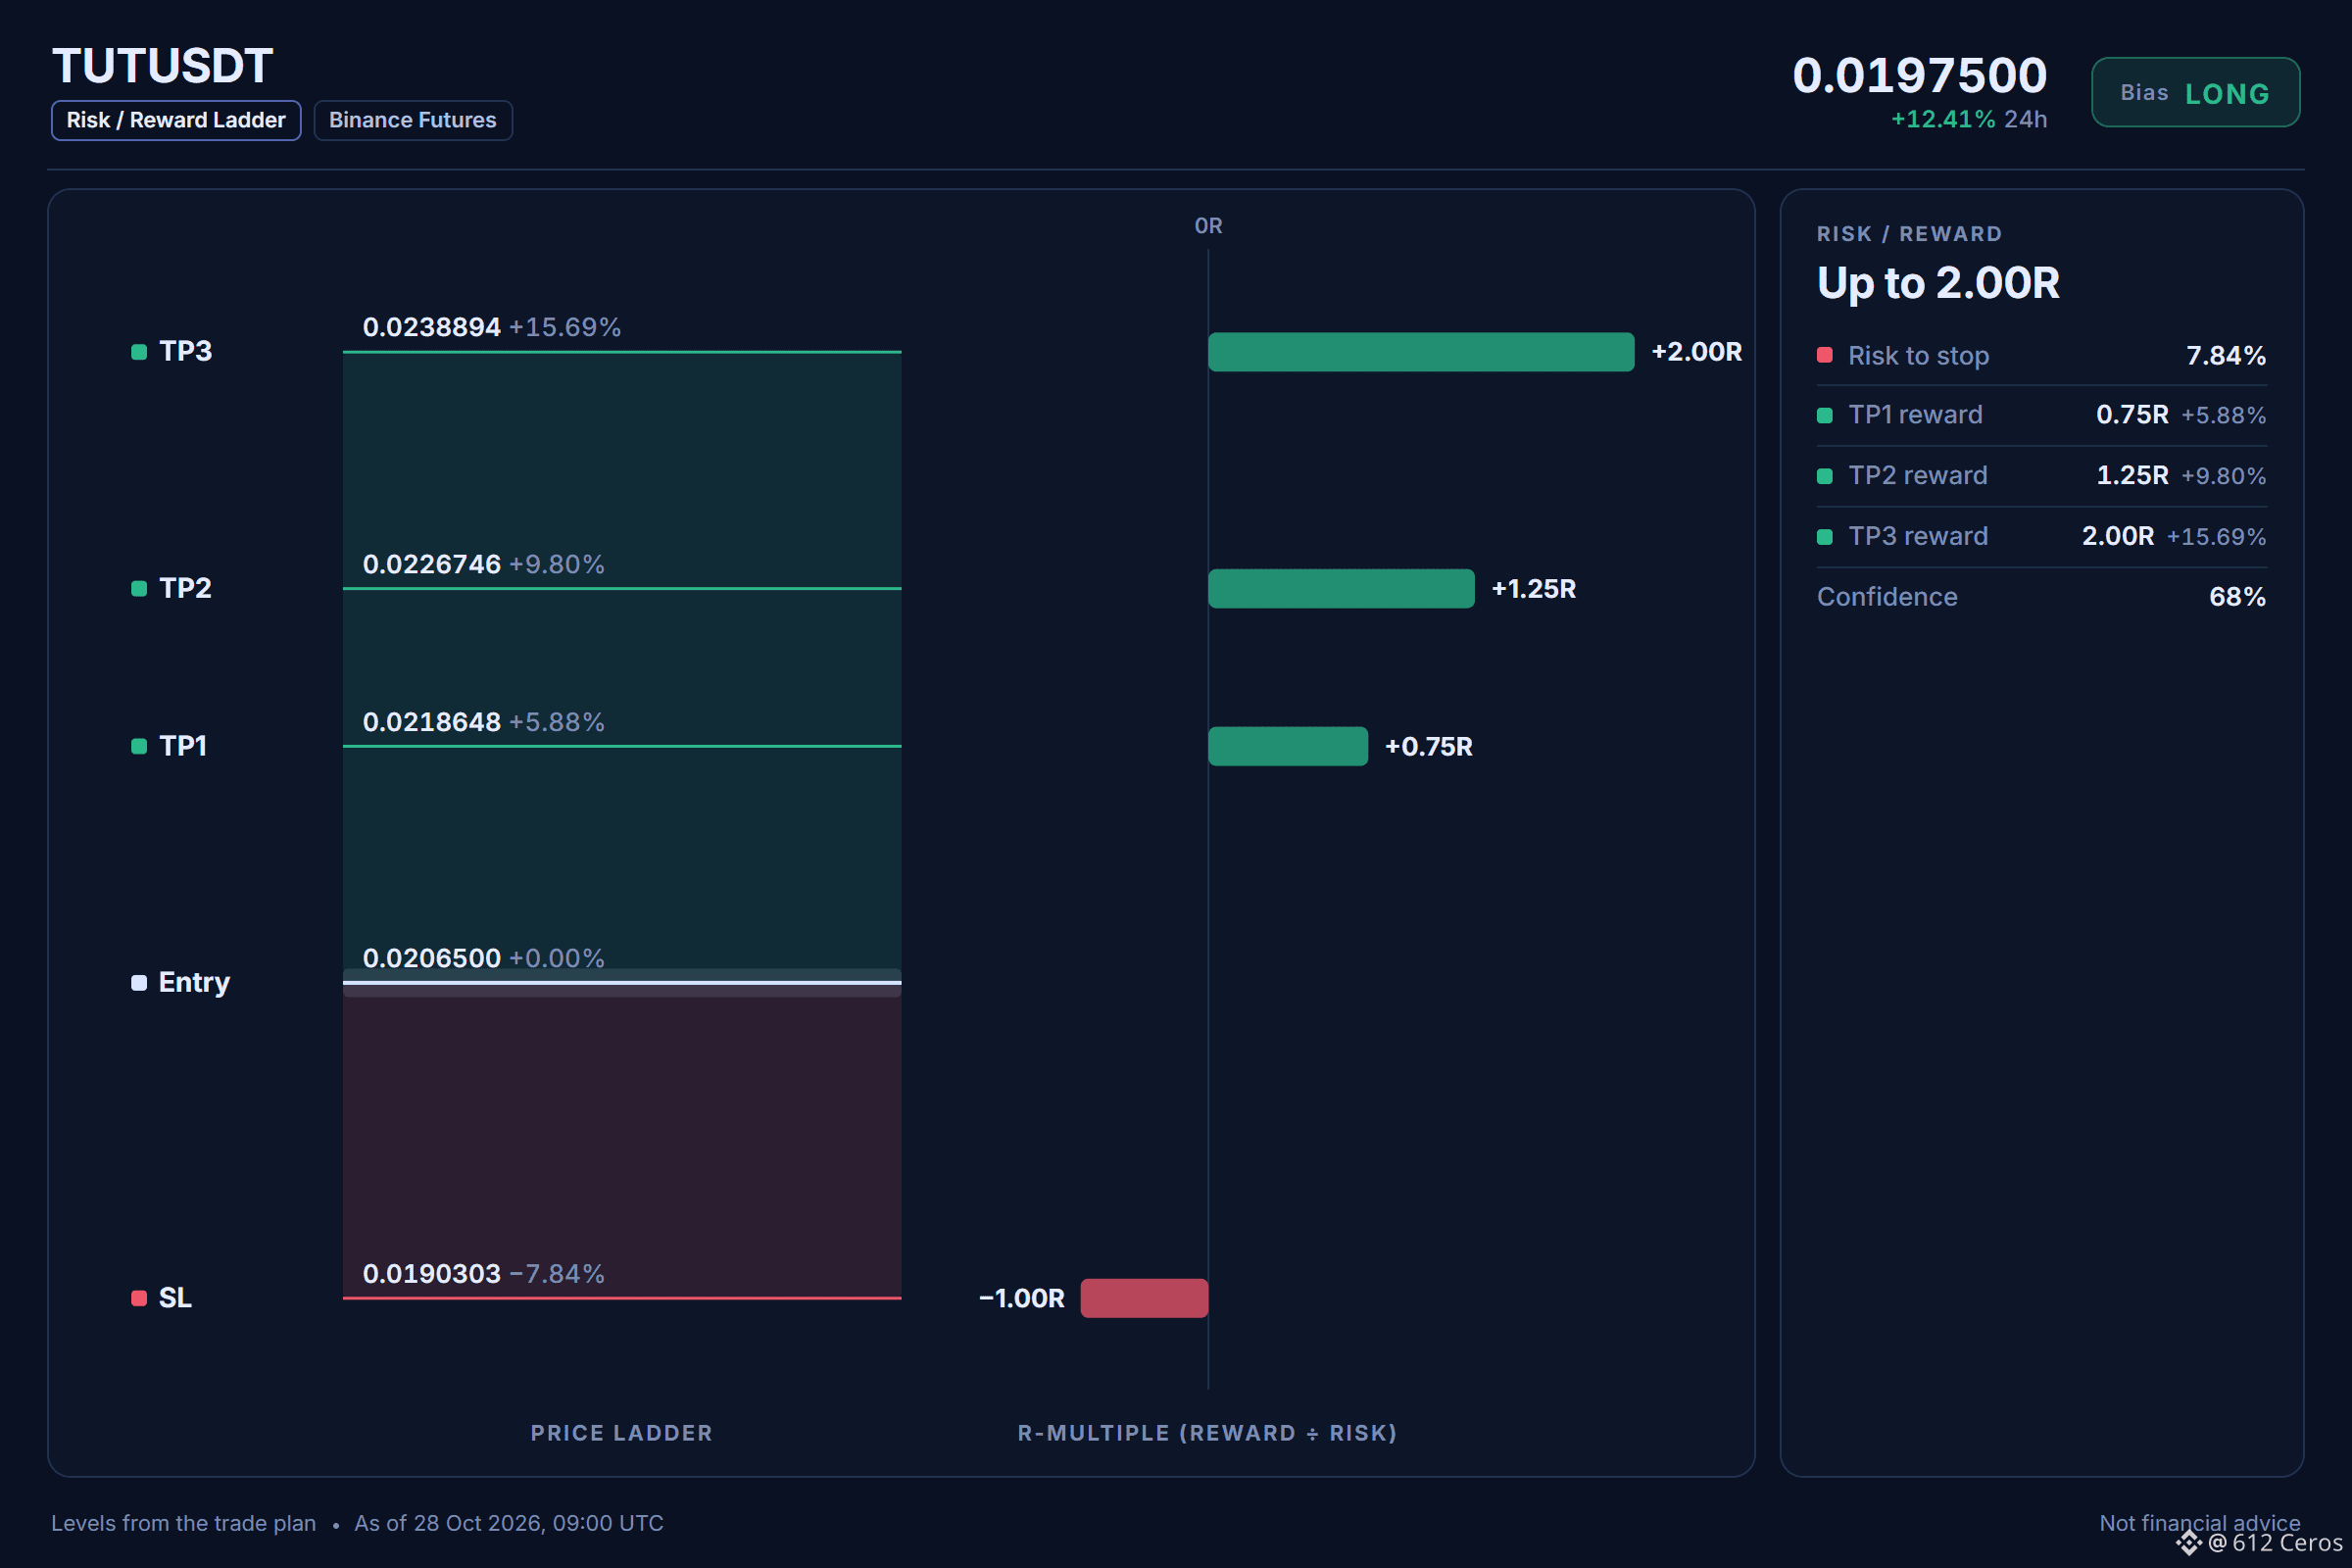
Entry: 0.0205765 – 0.0207235
TP1: 0.0218648 (+5.9%)
TP2: 0.0226746 (+9.8%)
TP3: 0.0238894 (+15.7%)
SL: 0.0190303 (-7.8%)
Plan: enter only inside the zone, close 50% at TP1, 25% at TP2, 25% at TP3, and move the stop to entry after TP1.
1h trend is up with buyers in control
Why LONG? 7/12 signals agree, 1 against.
• 1h trend up (above EMA50 & EMA200)
• Buyers are driving the move (15m ADX 32.5)
• Buyers have the momentum (4h RSI 61.5)
Risk: Far above its average, pullback likely (+5.1 ATR from 1h EMA50)
TUT is 5.1 ATR above its 1h EMA50, which means a pullback is likely. The 1h price is above the EMA50 and EMA200 in a bullish stack.
Where would you set your stop?
Levels mapped on the chart below.
{future}(TUTUSDT)
📲 Want more of my latest signals? Join me here:
[https://app.binance.com/uni-qr/D26WbL9t](https://app.binance.com/uni-qr/D26WbL9t)
⚠️ Personal market analysis only. NFA — manage risk and DYOR.
Educational content, not investment advice or a recommendation to buy, sell, deposit, or withdraw any asset. No paid promotion or referral/affiliate links.
🟢 LONG $TUT /USDT: expecting price to go UP
Bias: LONG · Strong
Entry: 0.0205765 – 0.0207235
TP1: 0.0218648 (+5.9%)
TP2: 0.0226746 (+9.8%)
TP3: 0.0238894 (+15.7%)
SL: 0.0190303 (-7.8%)
Plan: enter only inside the zone, close 50% at TP1, 25% at TP2, 25% at TP3, and move the stop to entry after TP1.
1h trend is up with buyers in control
Why LONG? 7/12 signals agree, 1 against.
• 1h trend up (above EMA50 & EMA200)
• Buyers are driving the move (15m ADX 32.5)
• Buyers have the momentum (4h RSI 61.5)
Risk: Far above its average, pullback likely (+5.1 ATR from 1h EMA50)
TUT is 5.1 ATR above its 1h EMA50, which means a pullback is likely. The 1h price is above the EMA50 and EMA200 in a bullish stack.
Where would you set your stop?
Levels mapped on the chart below.
📲 Want more of my latest signals? Join me here:
https://app.binance.com/uni-qr/D26WbL9t
⚠️ Personal market analysis only. NFA — manage risk and DYOR.
Educational content, not investment advice or a recommendation to buy, sell, deposit, or withdraw any asset. No paid promotion or referral/affiliate links.
1
611
·
--
Haussier
Range-bound daily trend makes me cautious.
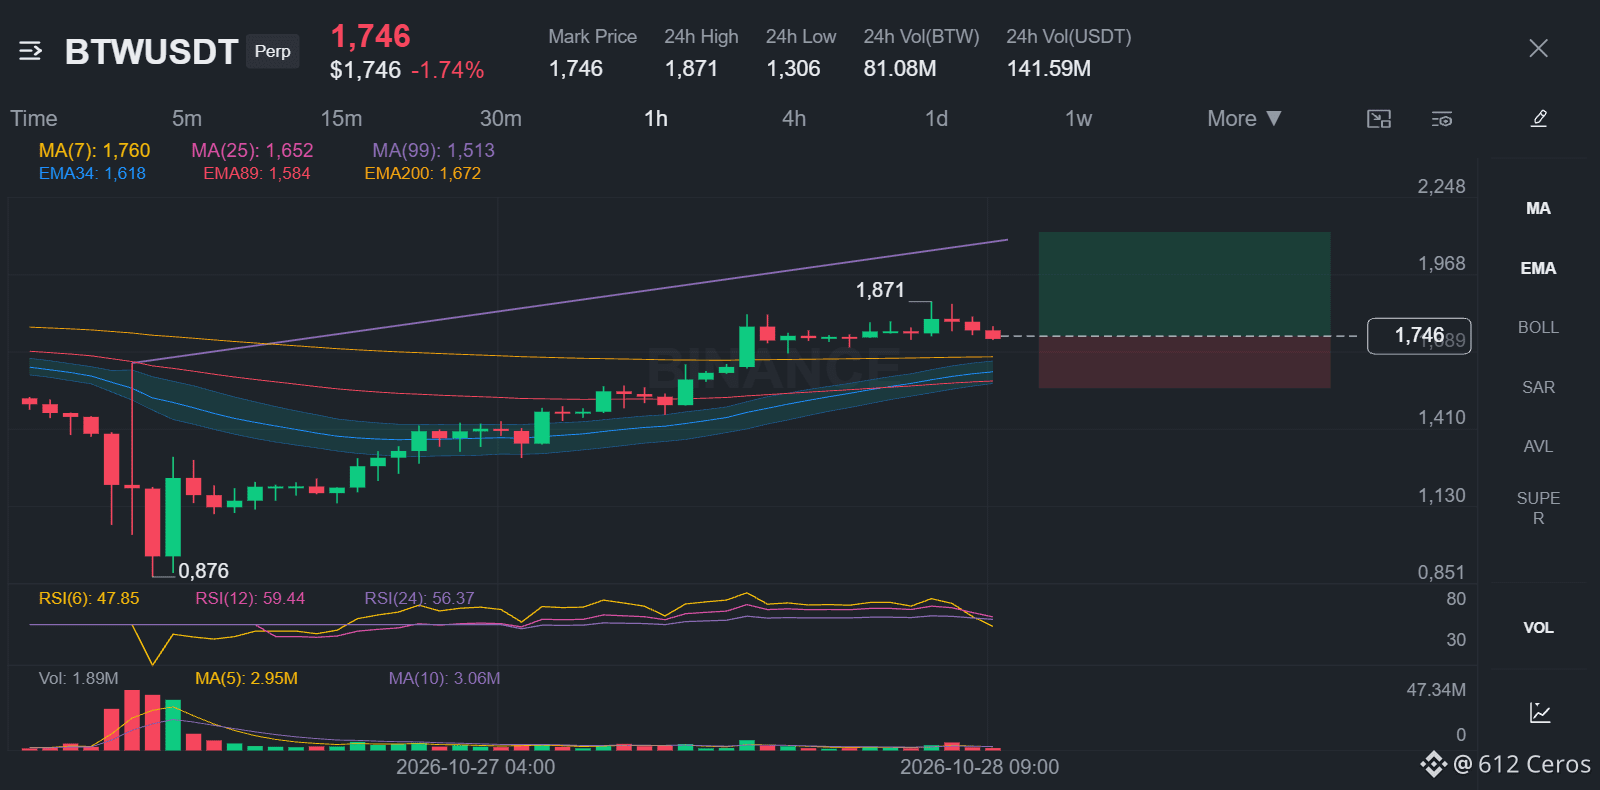
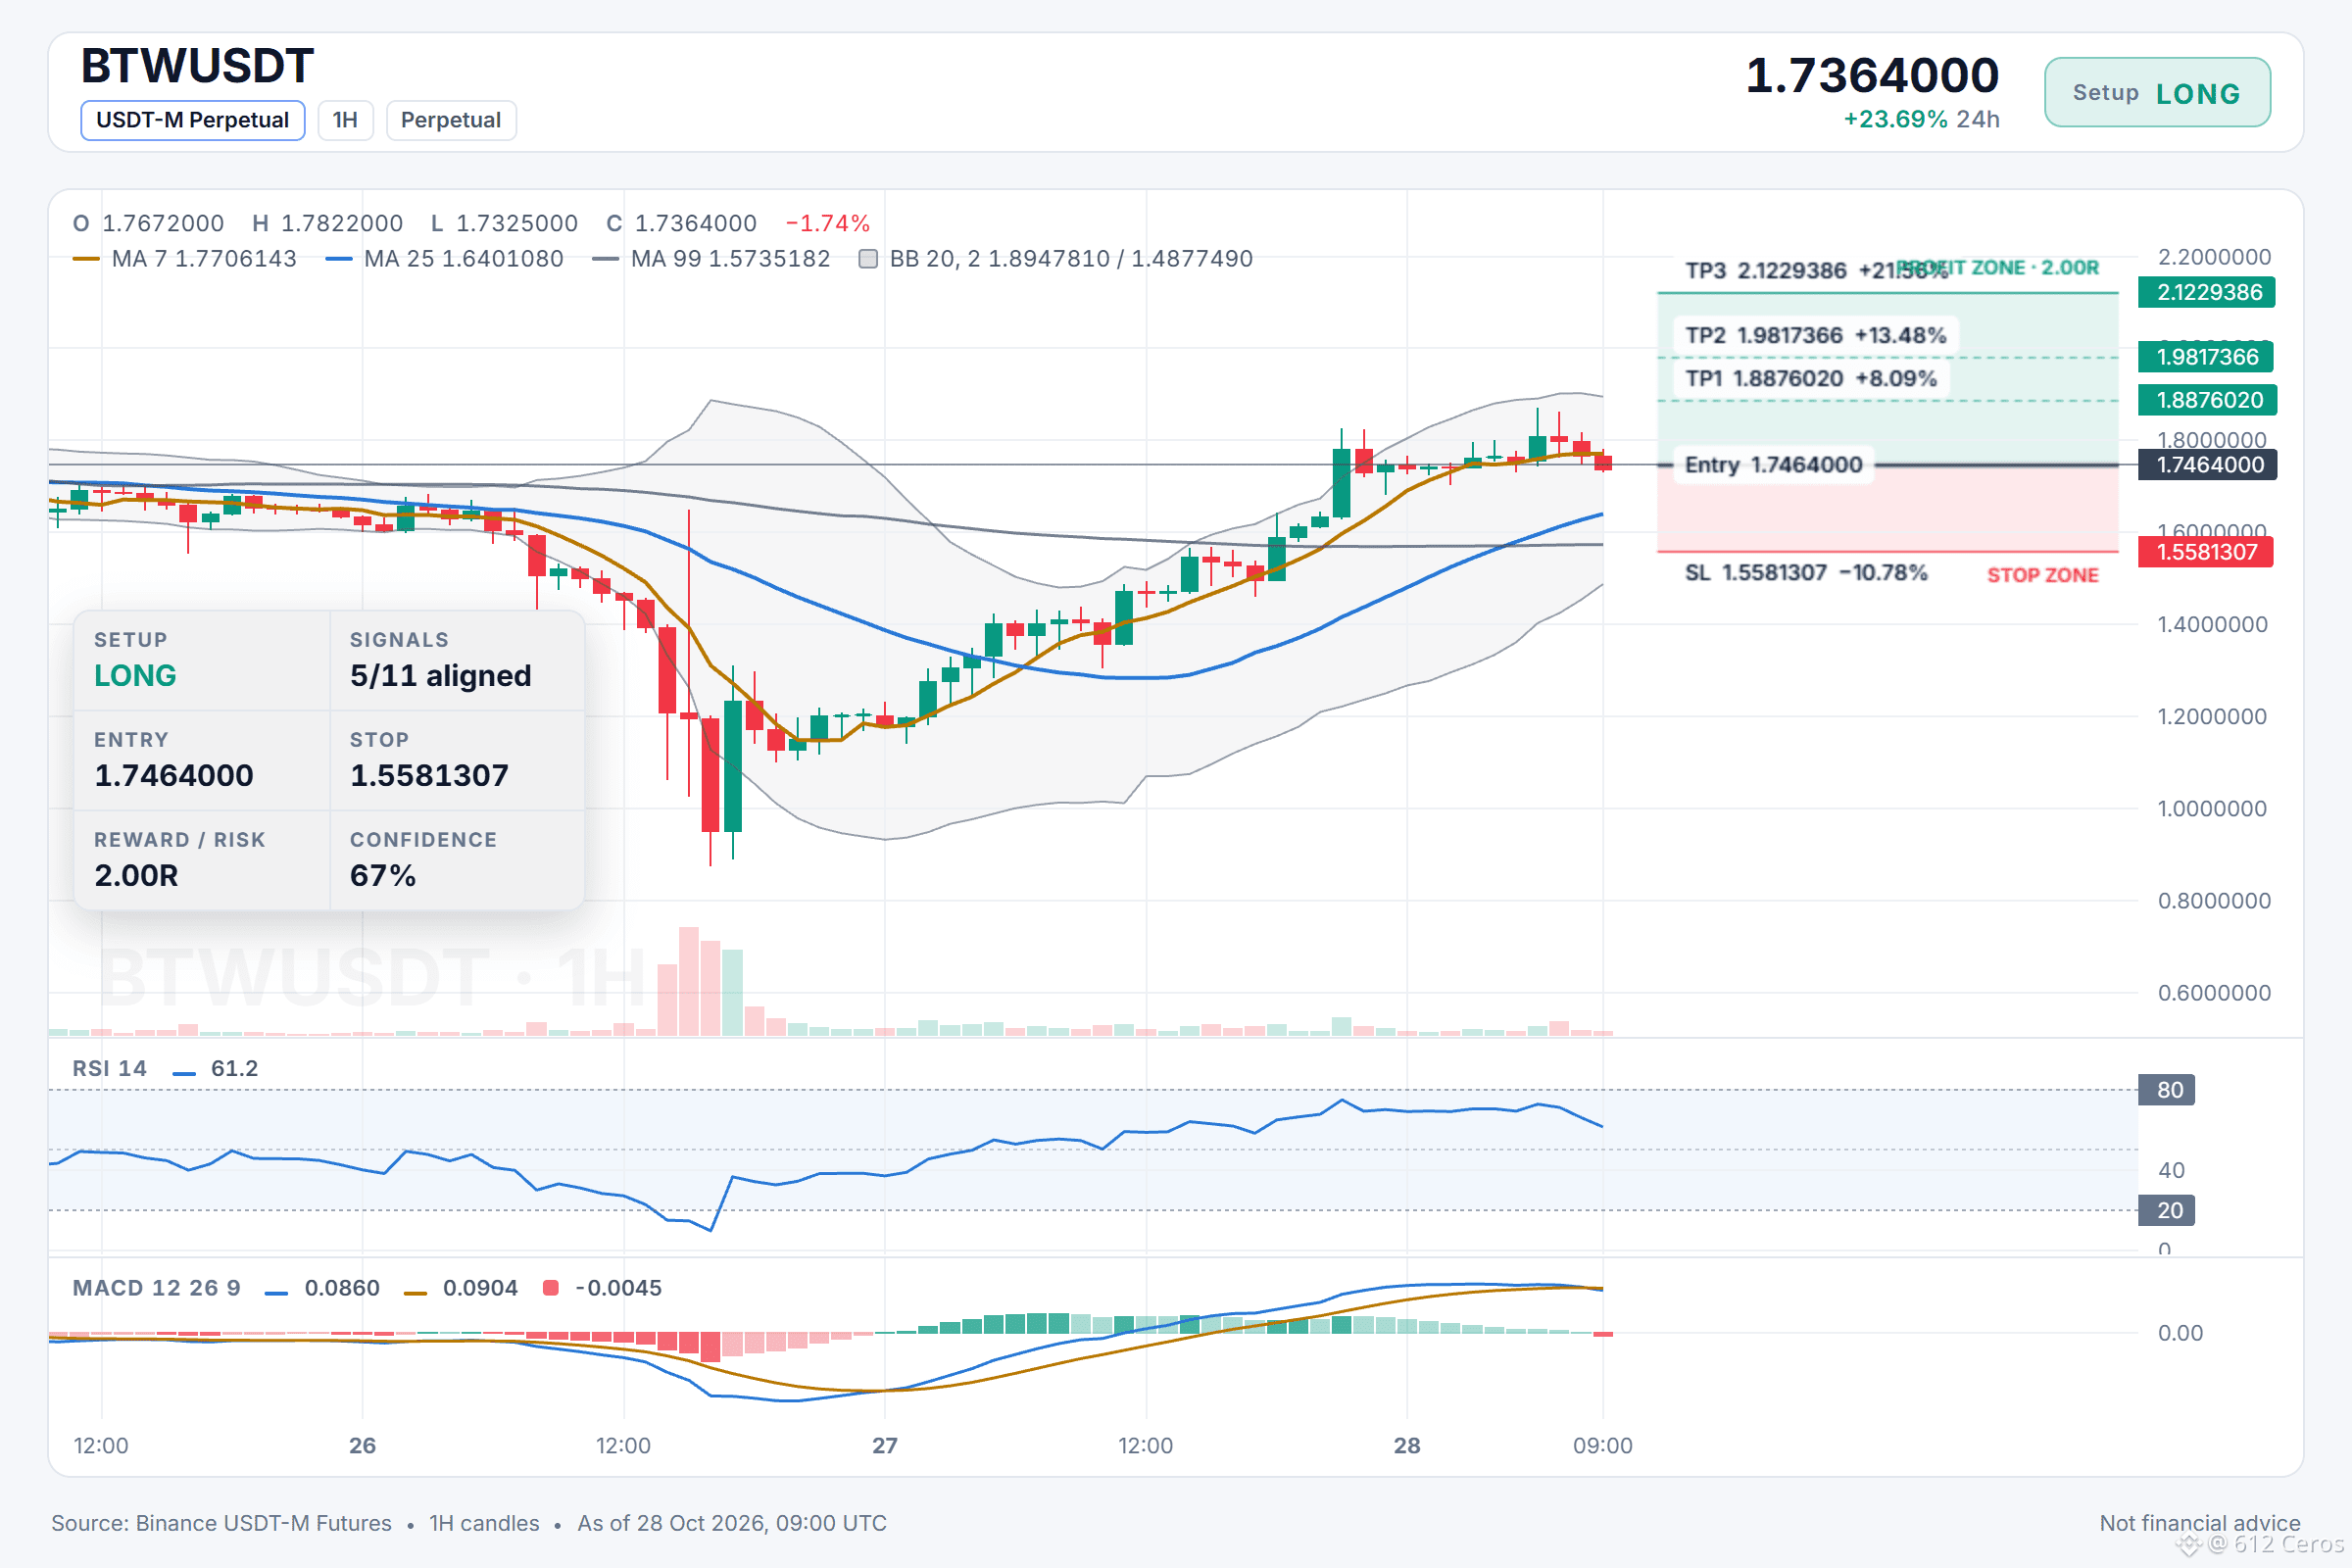
🟢 LONG $BTW /USDT: expecting price to go UP
Bias: LONG · Leaning
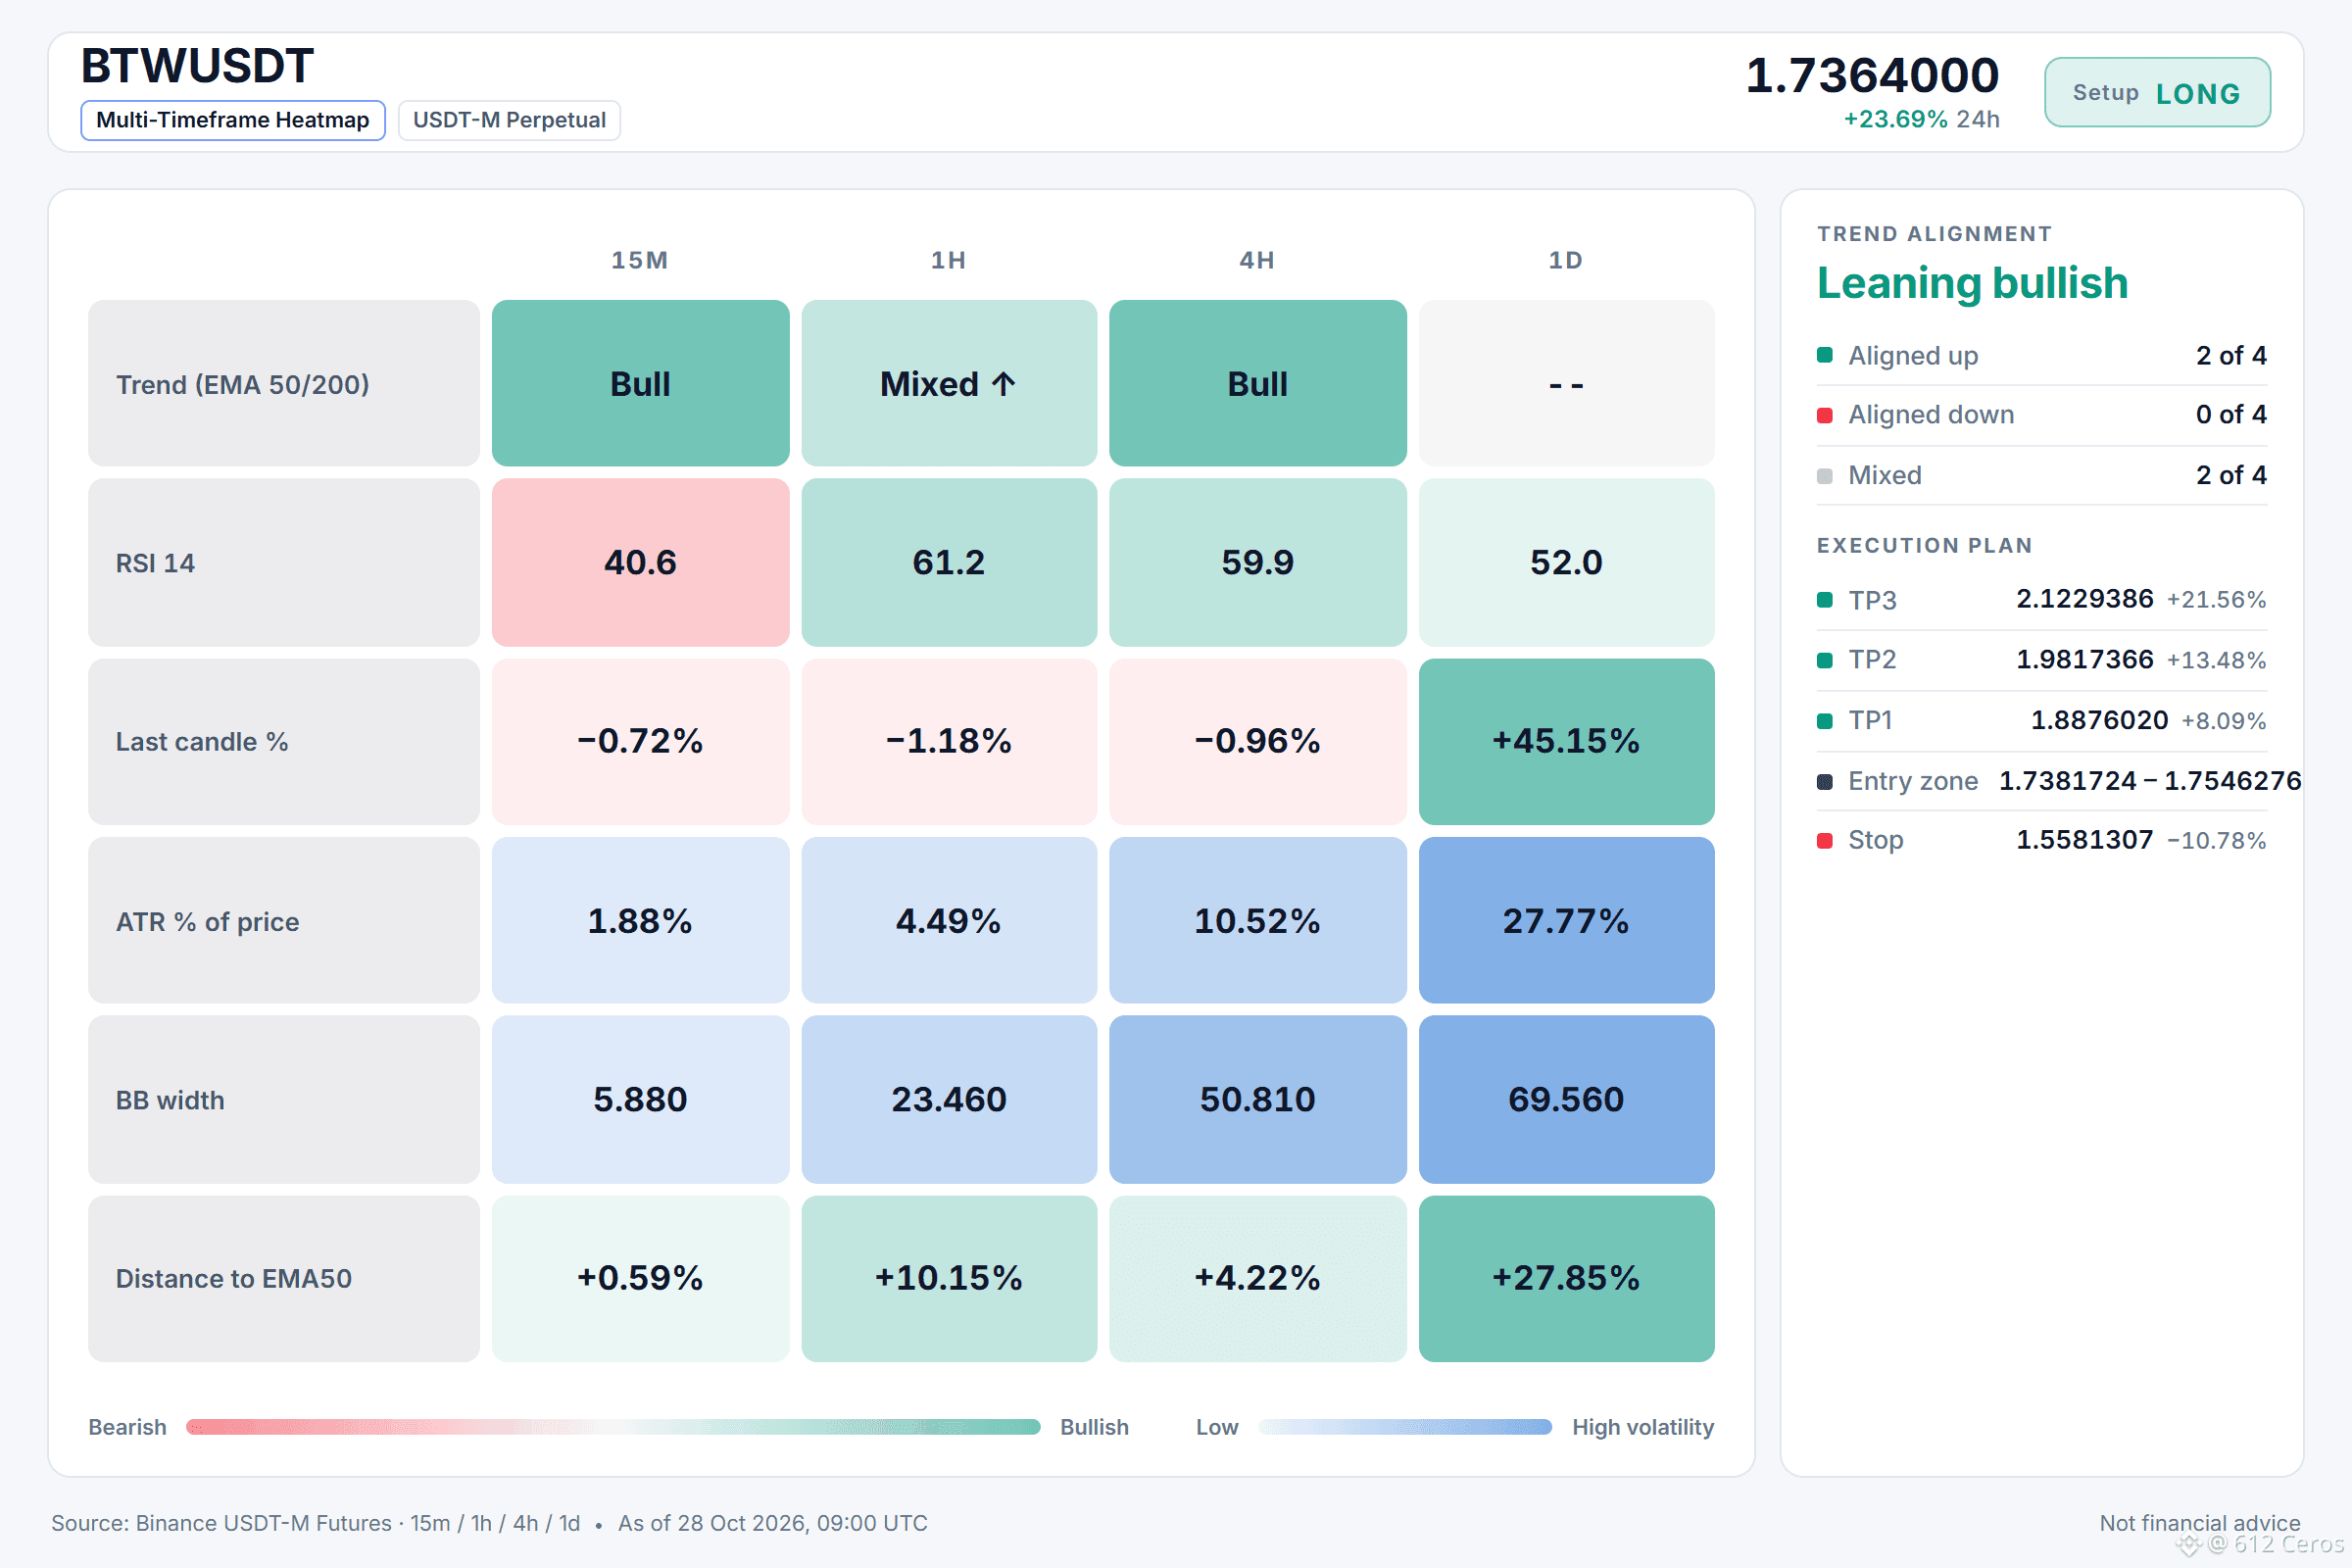
Entry: 1.7381724 – 1.7546276
TP1: 1.8876020 (+8.1%)
TP2: 1.9817366 (+13.5%)
TP3: 2.1229386 (+21.6%)
SL: 1.5581307 (-10.8%)
Plan: enter only inside the zone, close 50% at TP1, 25% at TP2, 25% at TP3, and move the stop to entry after TP1.
Note: moderate conviction only, keep size light.
Why LONG? BTW checklist: 5/11 agree, 1 against.
• 4h trend up (above EMA50 & EMA200)
• Buyers have the momentum (4h RSI 59.9)
• Buyers have the momentum (1h RSI 61.2)
Watch: Sellers are pushing right now (−0.72% 15m candle)
Watch: The idea is wrong if price reaches the stop at 1.5581307
Verdict: The 4h bullish stack and outperformance vs BTC support a long, but the 15m RSI z-score of -3.49 with a last candle down 0.72% shows sellers are pressing right now, so conviction is moderate.
Are you long or waiting for a better level?
Levels mapped on the chart below.
{future}(BTWUSDT)
📲 Want more of my latest signals? Join me here:
[https://app.binance.com/uni-qr/D26WbL9t](https://app.binance.com/uni-qr/D26WbL9t)
⚠️ Personal market analysis only. NFA — manage risk and DYOR.
Educational content, not investment advice or a recommendation to buy, sell, deposit, or withdraw any asset. No paid promotion or referral/affiliate links.
Range-bound daily trend makes me cautious.
🟢 LONG $BTW /USDT: expecting price to go UP
Bias: LONG · Leaning
Entry: 1.7381724 – 1.7546276
TP1: 1.8876020 (+8.1%)
TP2: 1.9817366 (+13.5%)
TP3: 2.1229386 (+21.6%)
SL: 1.5581307 (-10.8%)
Plan: enter only inside the zone, close 50% at TP1, 25% at TP2, 25% at TP3, and move the stop to entry after TP1.
Note: moderate conviction only, keep size light.
Why LONG? BTW checklist: 5/11 agree, 1 against.
• 4h trend up (above EMA50 & EMA200)
• Buyers have the momentum (4h RSI 59.9)
• Buyers have the momentum (1h RSI 61.2)
Watch: Sellers are pushing right now (−0.72% 15m candle)
Watch: The idea is wrong if price reaches the stop at 1.5581307
Verdict: The 4h bullish stack and outperformance vs BTC support a long, but the 15m RSI z-score of -3.49 with a last candle down 0.72% shows sellers are pressing right now, so conviction is moderate.
Are you long or waiting for a better level?
Levels mapped on the chart below.
📲 Want more of my latest signals? Join me here:
https://app.binance.com/uni-qr/D26WbL9t
⚠️ Personal market analysis only. NFA — manage risk and DYOR.
Educational content, not investment advice or a recommendation to buy, sell, deposit, or withdraw any asset. No paid promotion or referral/affiliate links.
2
1
617
·
--
Baissier
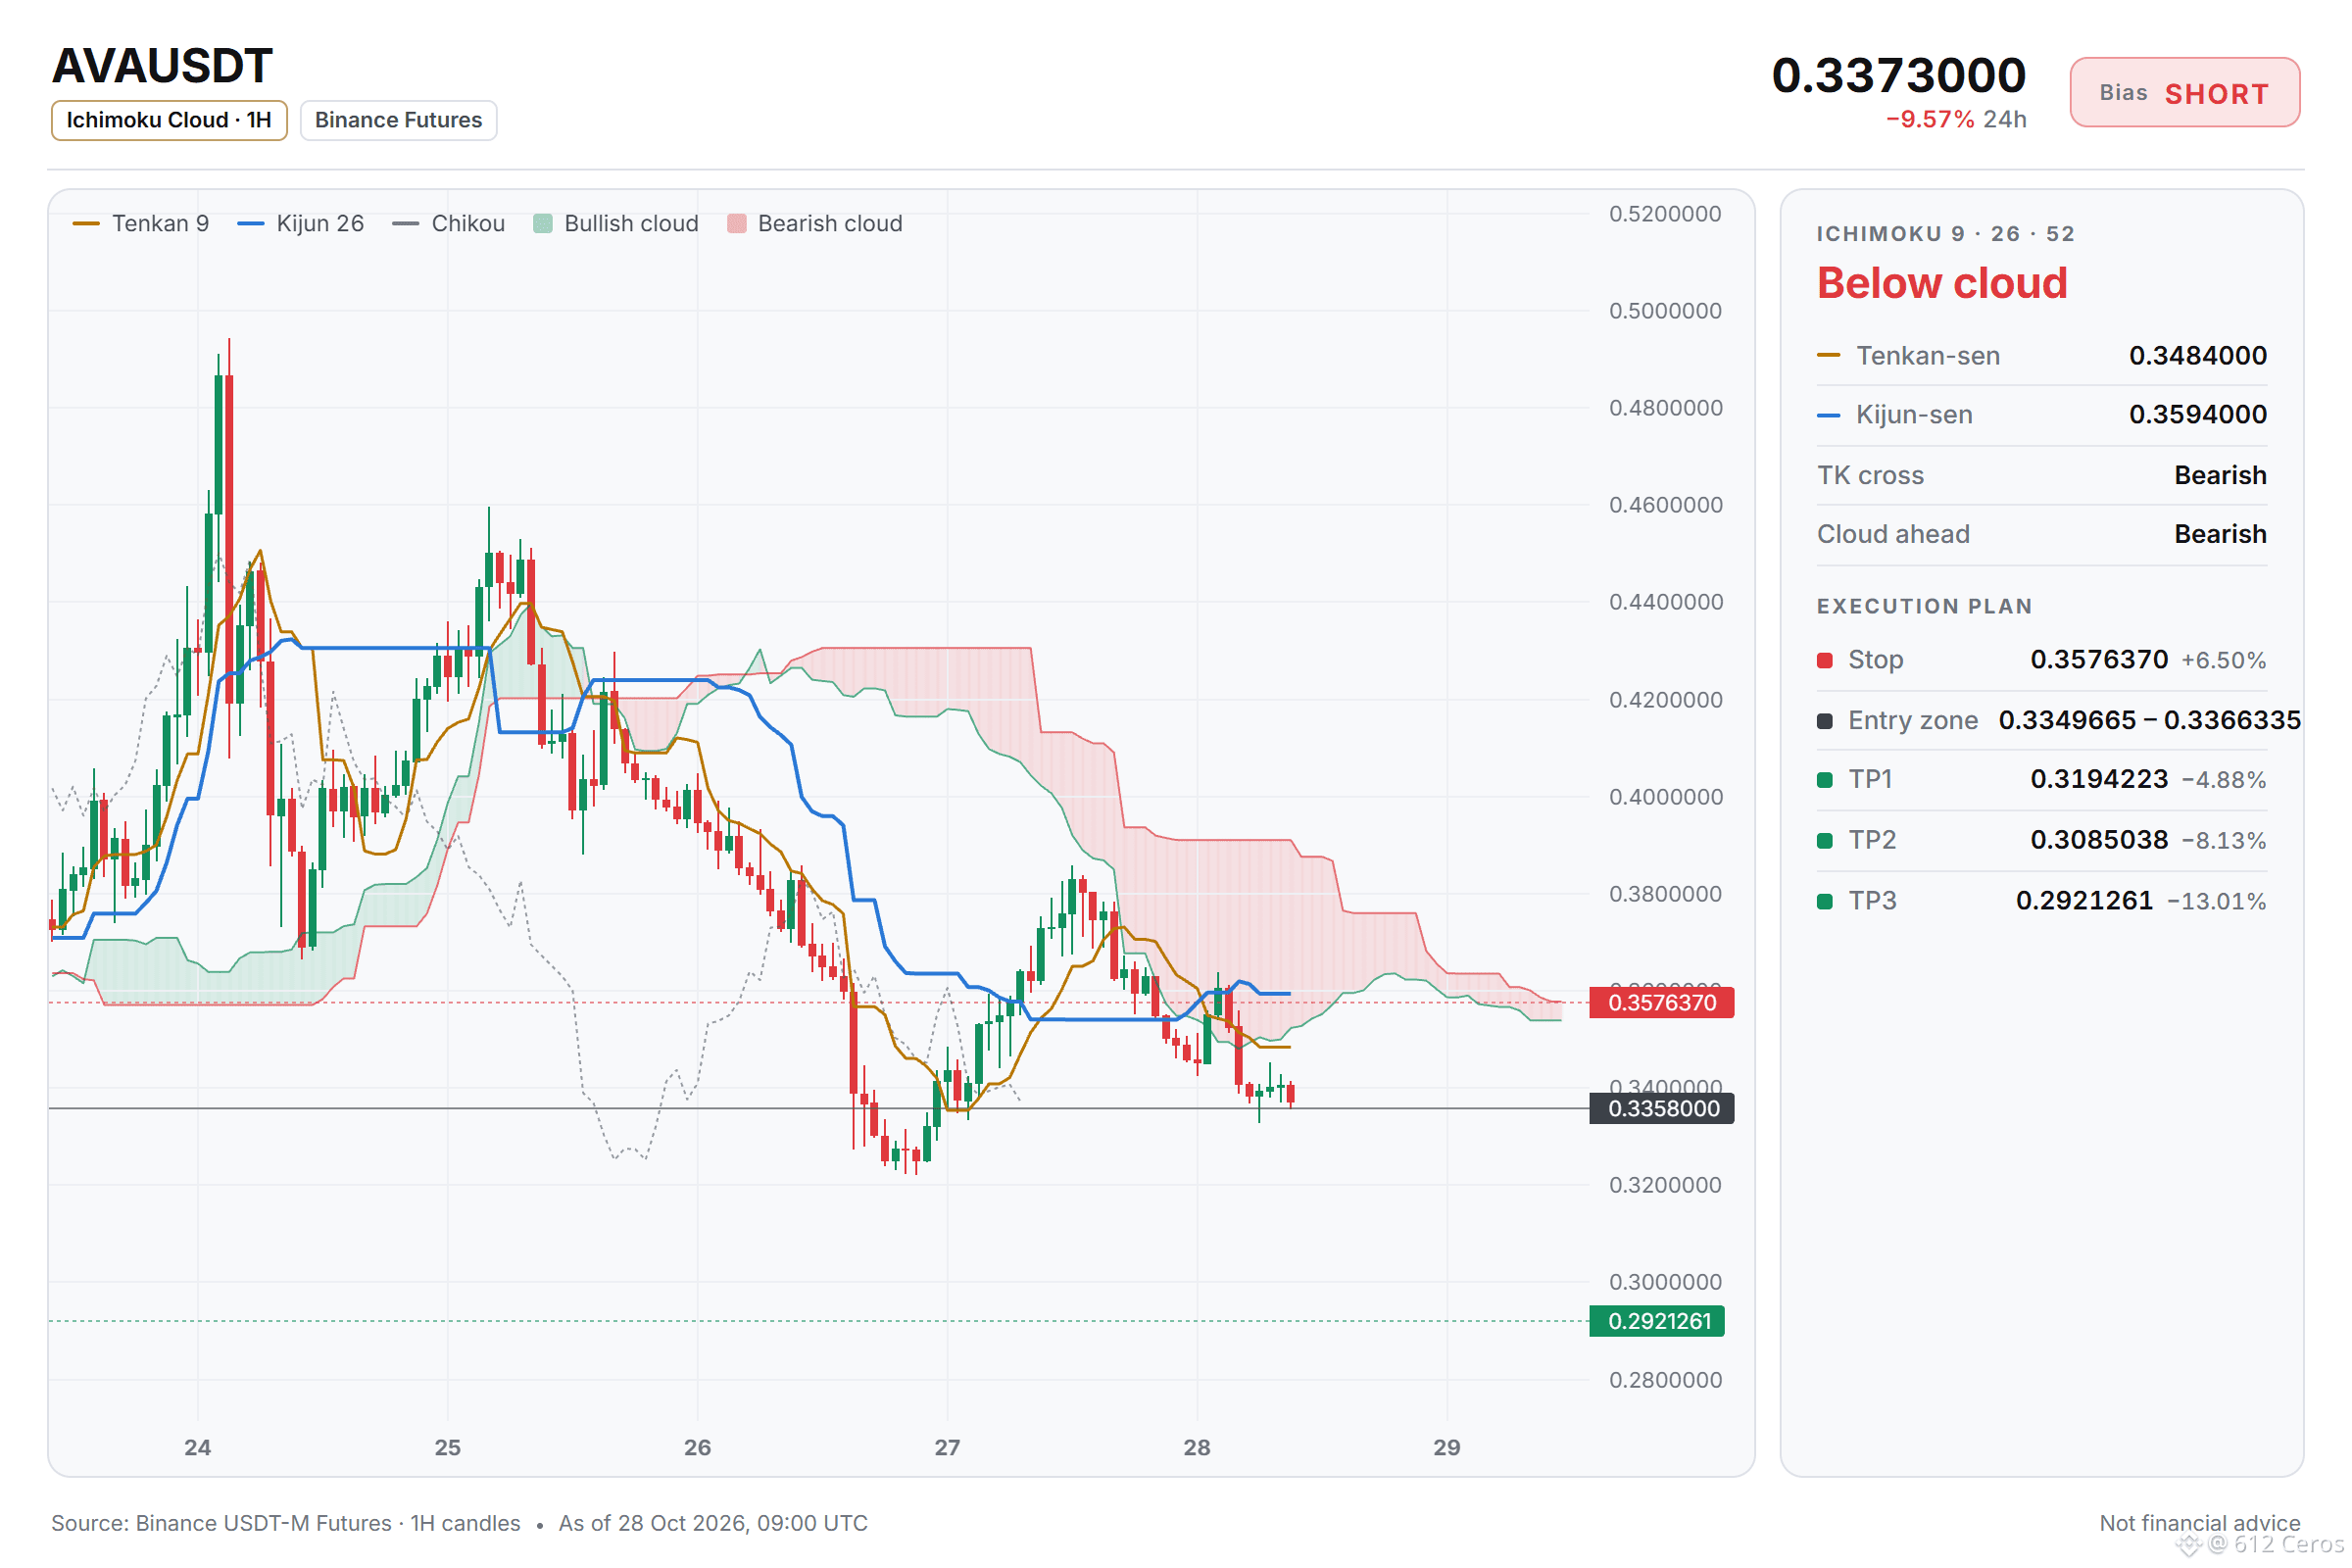
AVA short setup: the levels I'm watching
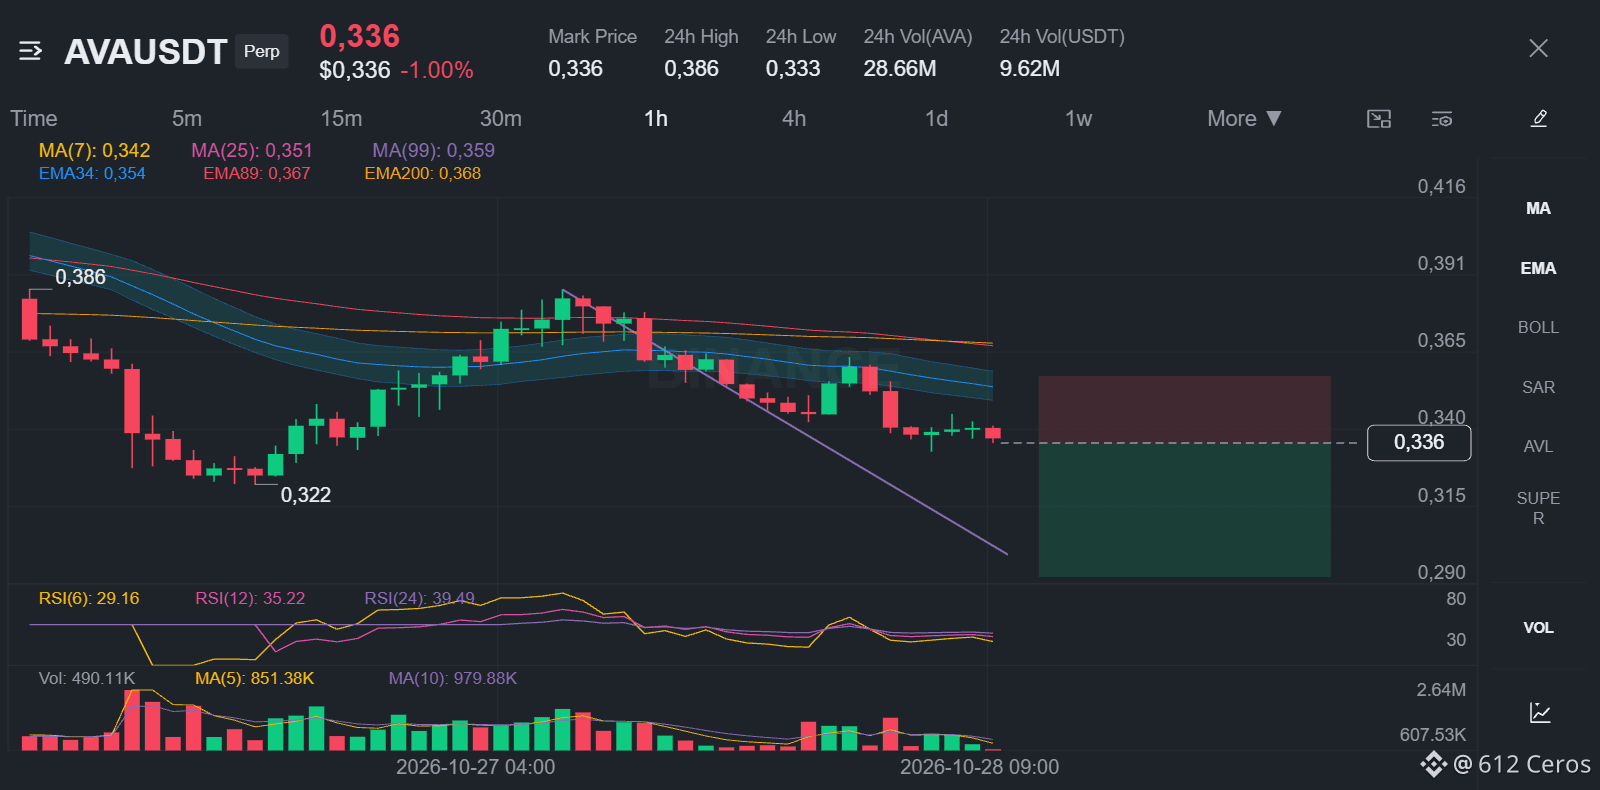
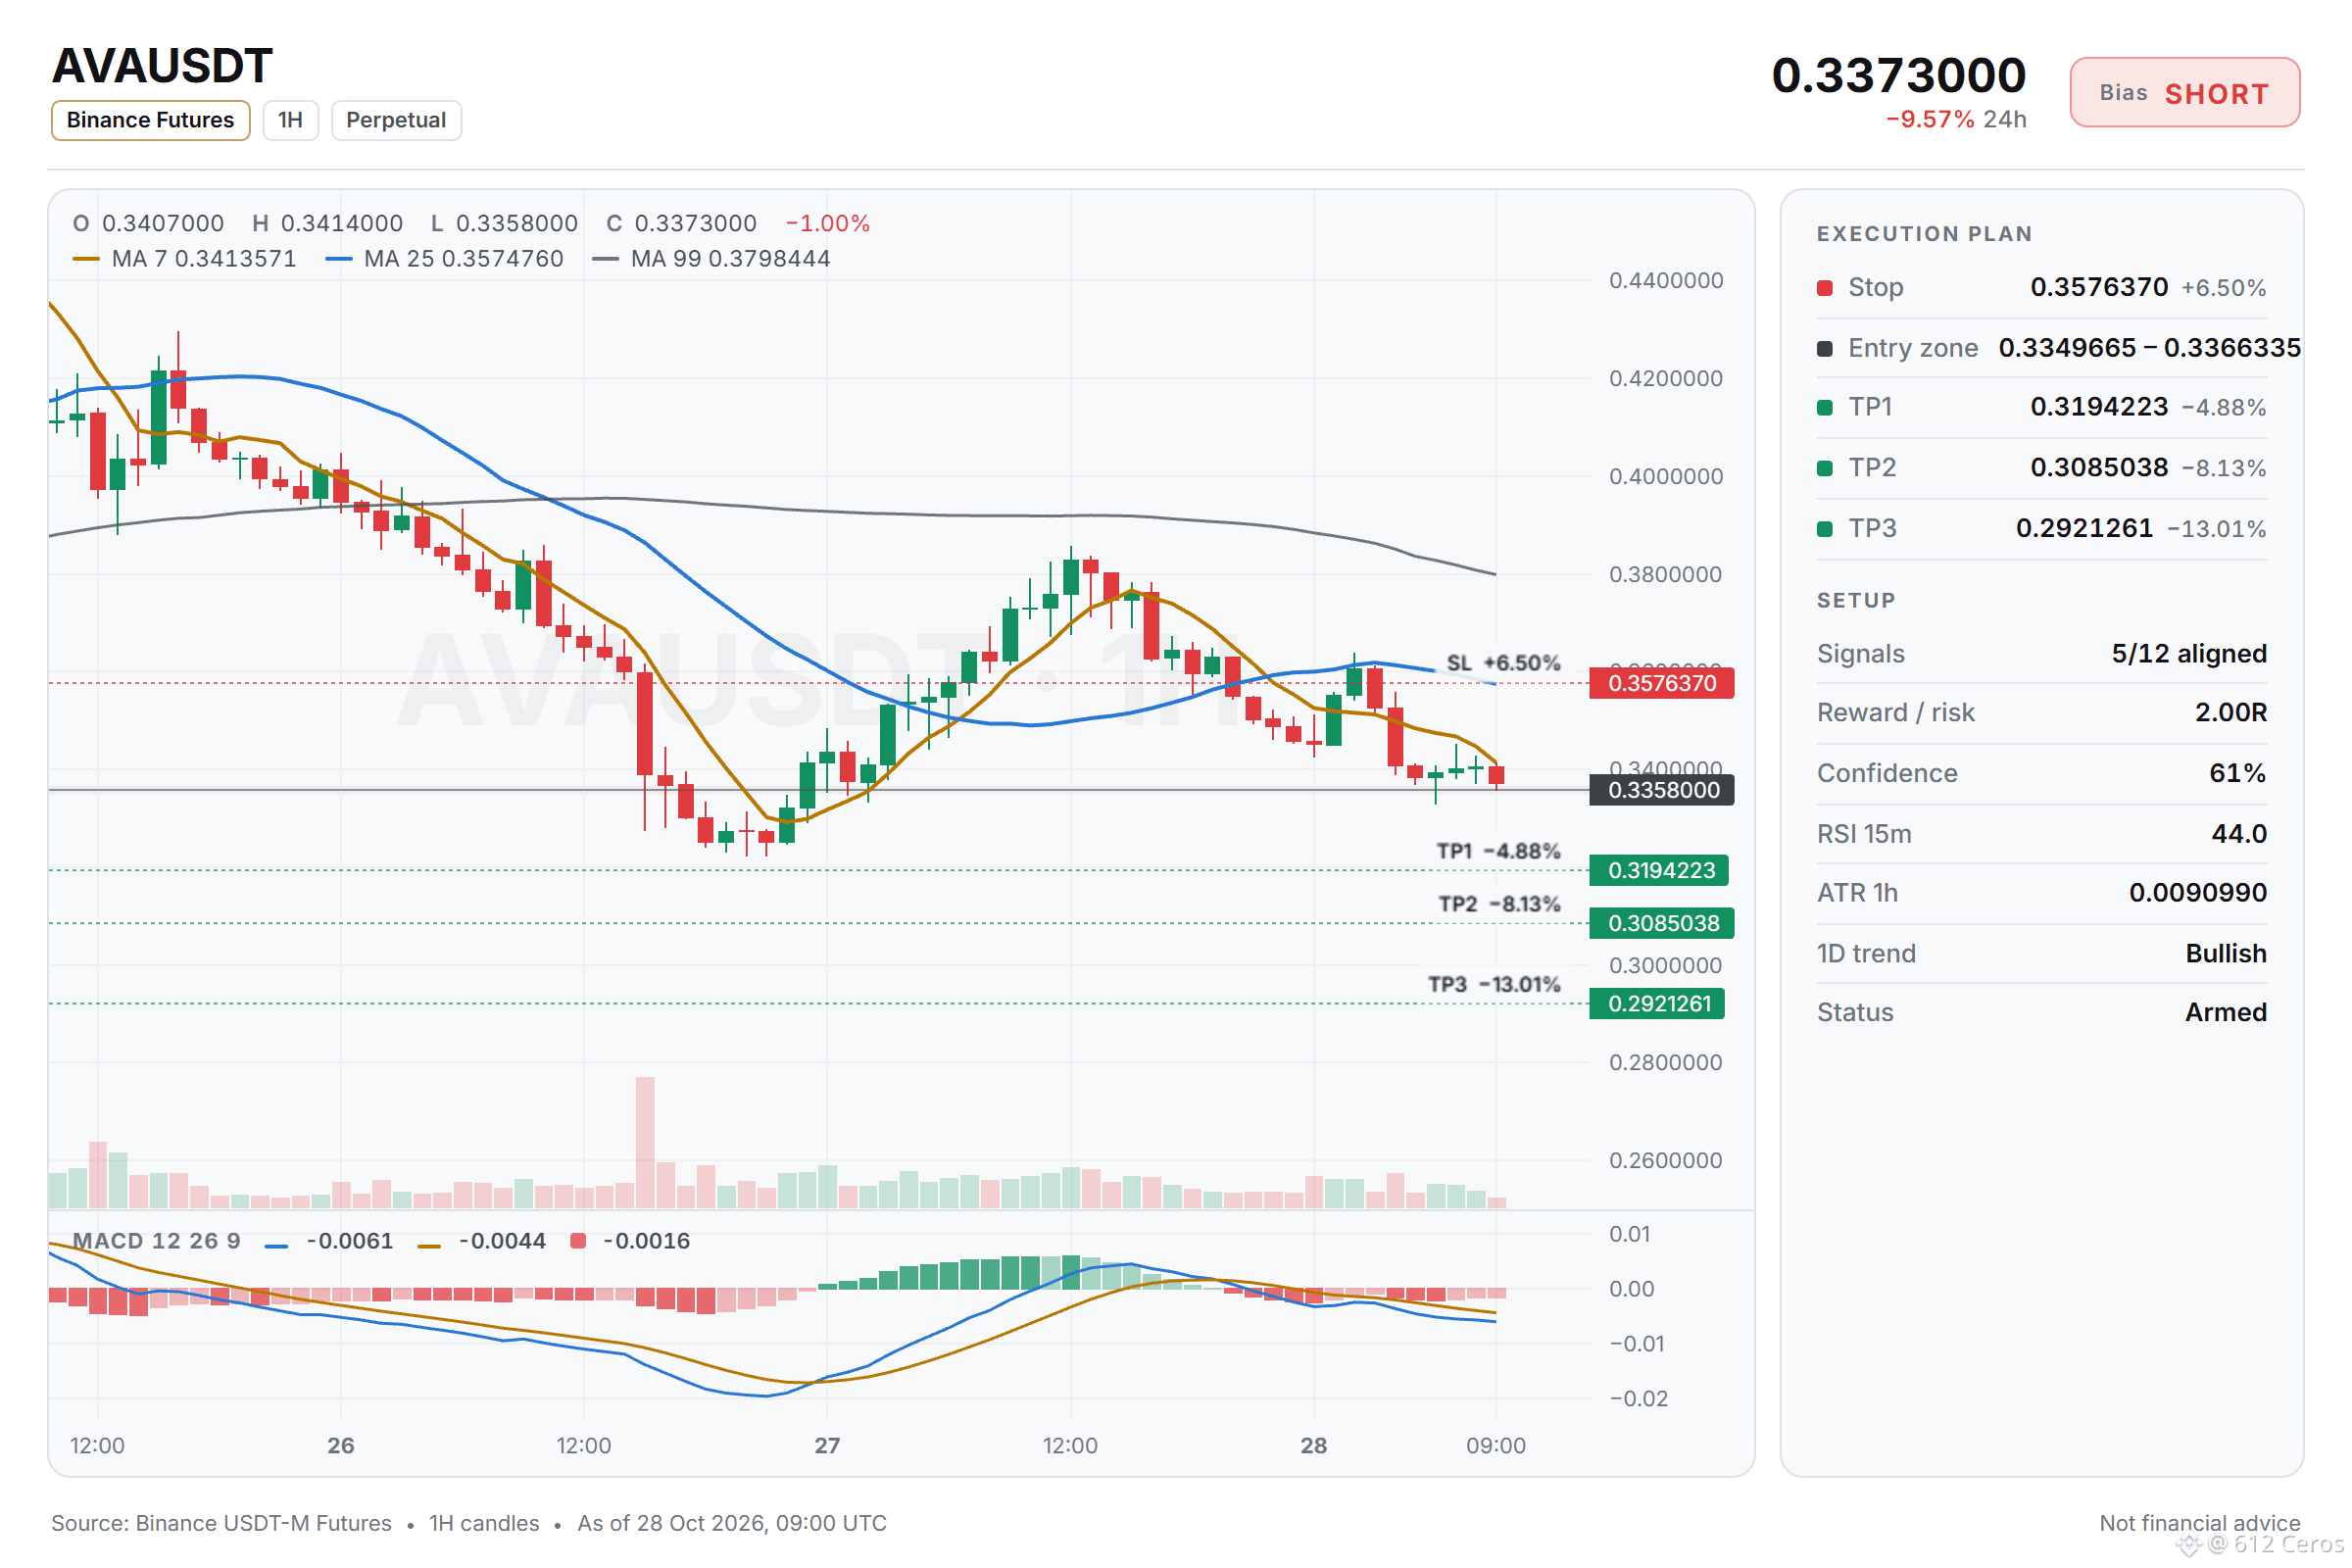
🔴 SHORT $AVA /USDT: expecting price to go DOWN
Bias: SHORT · Leaning
Entry: 0.3349665 – 0.3366335
TP1: 0.3194223 (-4.9%)
TP2: 0.3085038 (-8.1%)
TP3: 0.2921261 (-13.0%)
SL: 0.3576370 (+6.5%)
Plan: enter only inside the zone, close 50% at TP1, 25% at TP2, 25% at TP3, and move the stop to entry after TP1.
Caution: counter-trend setup against the bigger trend, only 5 signals confirm it. Size down, respect the stop.
Why SHORT? 5/12 signals agree, 1 against.
• 1h trend down (below EMA50 & EMA200)
• Sellers are driving the move (15m ADX 22.5)
• Sellers have the momentum (4h RSI 40.6)
Risk: Daily trend up (above EMA50 & EMA200)
The reasoning:
The daily trend reads bullish, and 5/12 signals aligned favour the short side. The plan is to work the 0.3349665 – 0.3366335 zone, scale out at 0.3194223 and 0.3085038, and stay patient for 0.2921261. A move through 0.3576370 means the idea is wrong and the stop does its job. This is a counter-trend bet against the higher-timeframe trend, so size down.
Does AVA tag 0.3194223 first, or the stop?
Levels mapped on the chart below.
{future}(AVAUSDT)
📲 Want more of my latest signals? Join me here:
[https://app.binance.com/uni-qr/D26WbL9t](https://app.binance.com/uni-qr/D26WbL9t)
⚠️ Personal market analysis only. NFA — manage risk and DYOR.
Educational content, not investment advice or a recommendation to buy, sell, deposit, or withdraw any asset. No paid promotion or referral/affiliate links.
AVA short setup: the levels I'm watching
🔴 SHORT $AVA /USDT: expecting price to go DOWN
Bias: SHORT · Leaning
Entry: 0.3349665 – 0.3366335
TP1: 0.3194223 (-4.9%)
TP2: 0.3085038 (-8.1%)
TP3: 0.2921261 (-13.0%)
SL: 0.3576370 (+6.5%)
Plan: enter only inside the zone, close 50% at TP1, 25% at TP2, 25% at TP3, and move the stop to entry after TP1.
Caution: counter-trend setup against the bigger trend, only 5 signals confirm it. Size down, respect the stop.
Why SHORT? 5/12 signals agree, 1 against.
• 1h trend down (below EMA50 & EMA200)
• Sellers are driving the move (15m ADX 22.5)
• Sellers have the momentum (4h RSI 40.6)
Risk: Daily trend up (above EMA50 & EMA200)
The reasoning:
The daily trend reads bullish, and 5/12 signals aligned favour the short side. The plan is to work the 0.3349665 – 0.3366335 zone, scale out at 0.3194223 and 0.3085038, and stay patient for 0.2921261. A move through 0.3576370 means the idea is wrong and the stop does its job. This is a counter-trend bet against the higher-timeframe trend, so size down.
Does AVA tag 0.3194223 first, or the stop?
Levels mapped on the chart below.
📲 Want more of my latest signals? Join me here:
https://app.binance.com/uni-qr/D26WbL9t
⚠️ Personal market analysis only. NFA — manage risk and DYOR.
Educational content, not investment advice or a recommendation to buy, sell, deposit, or withdraw any asset. No paid promotion or referral/affiliate links.
4
1
452
·
--
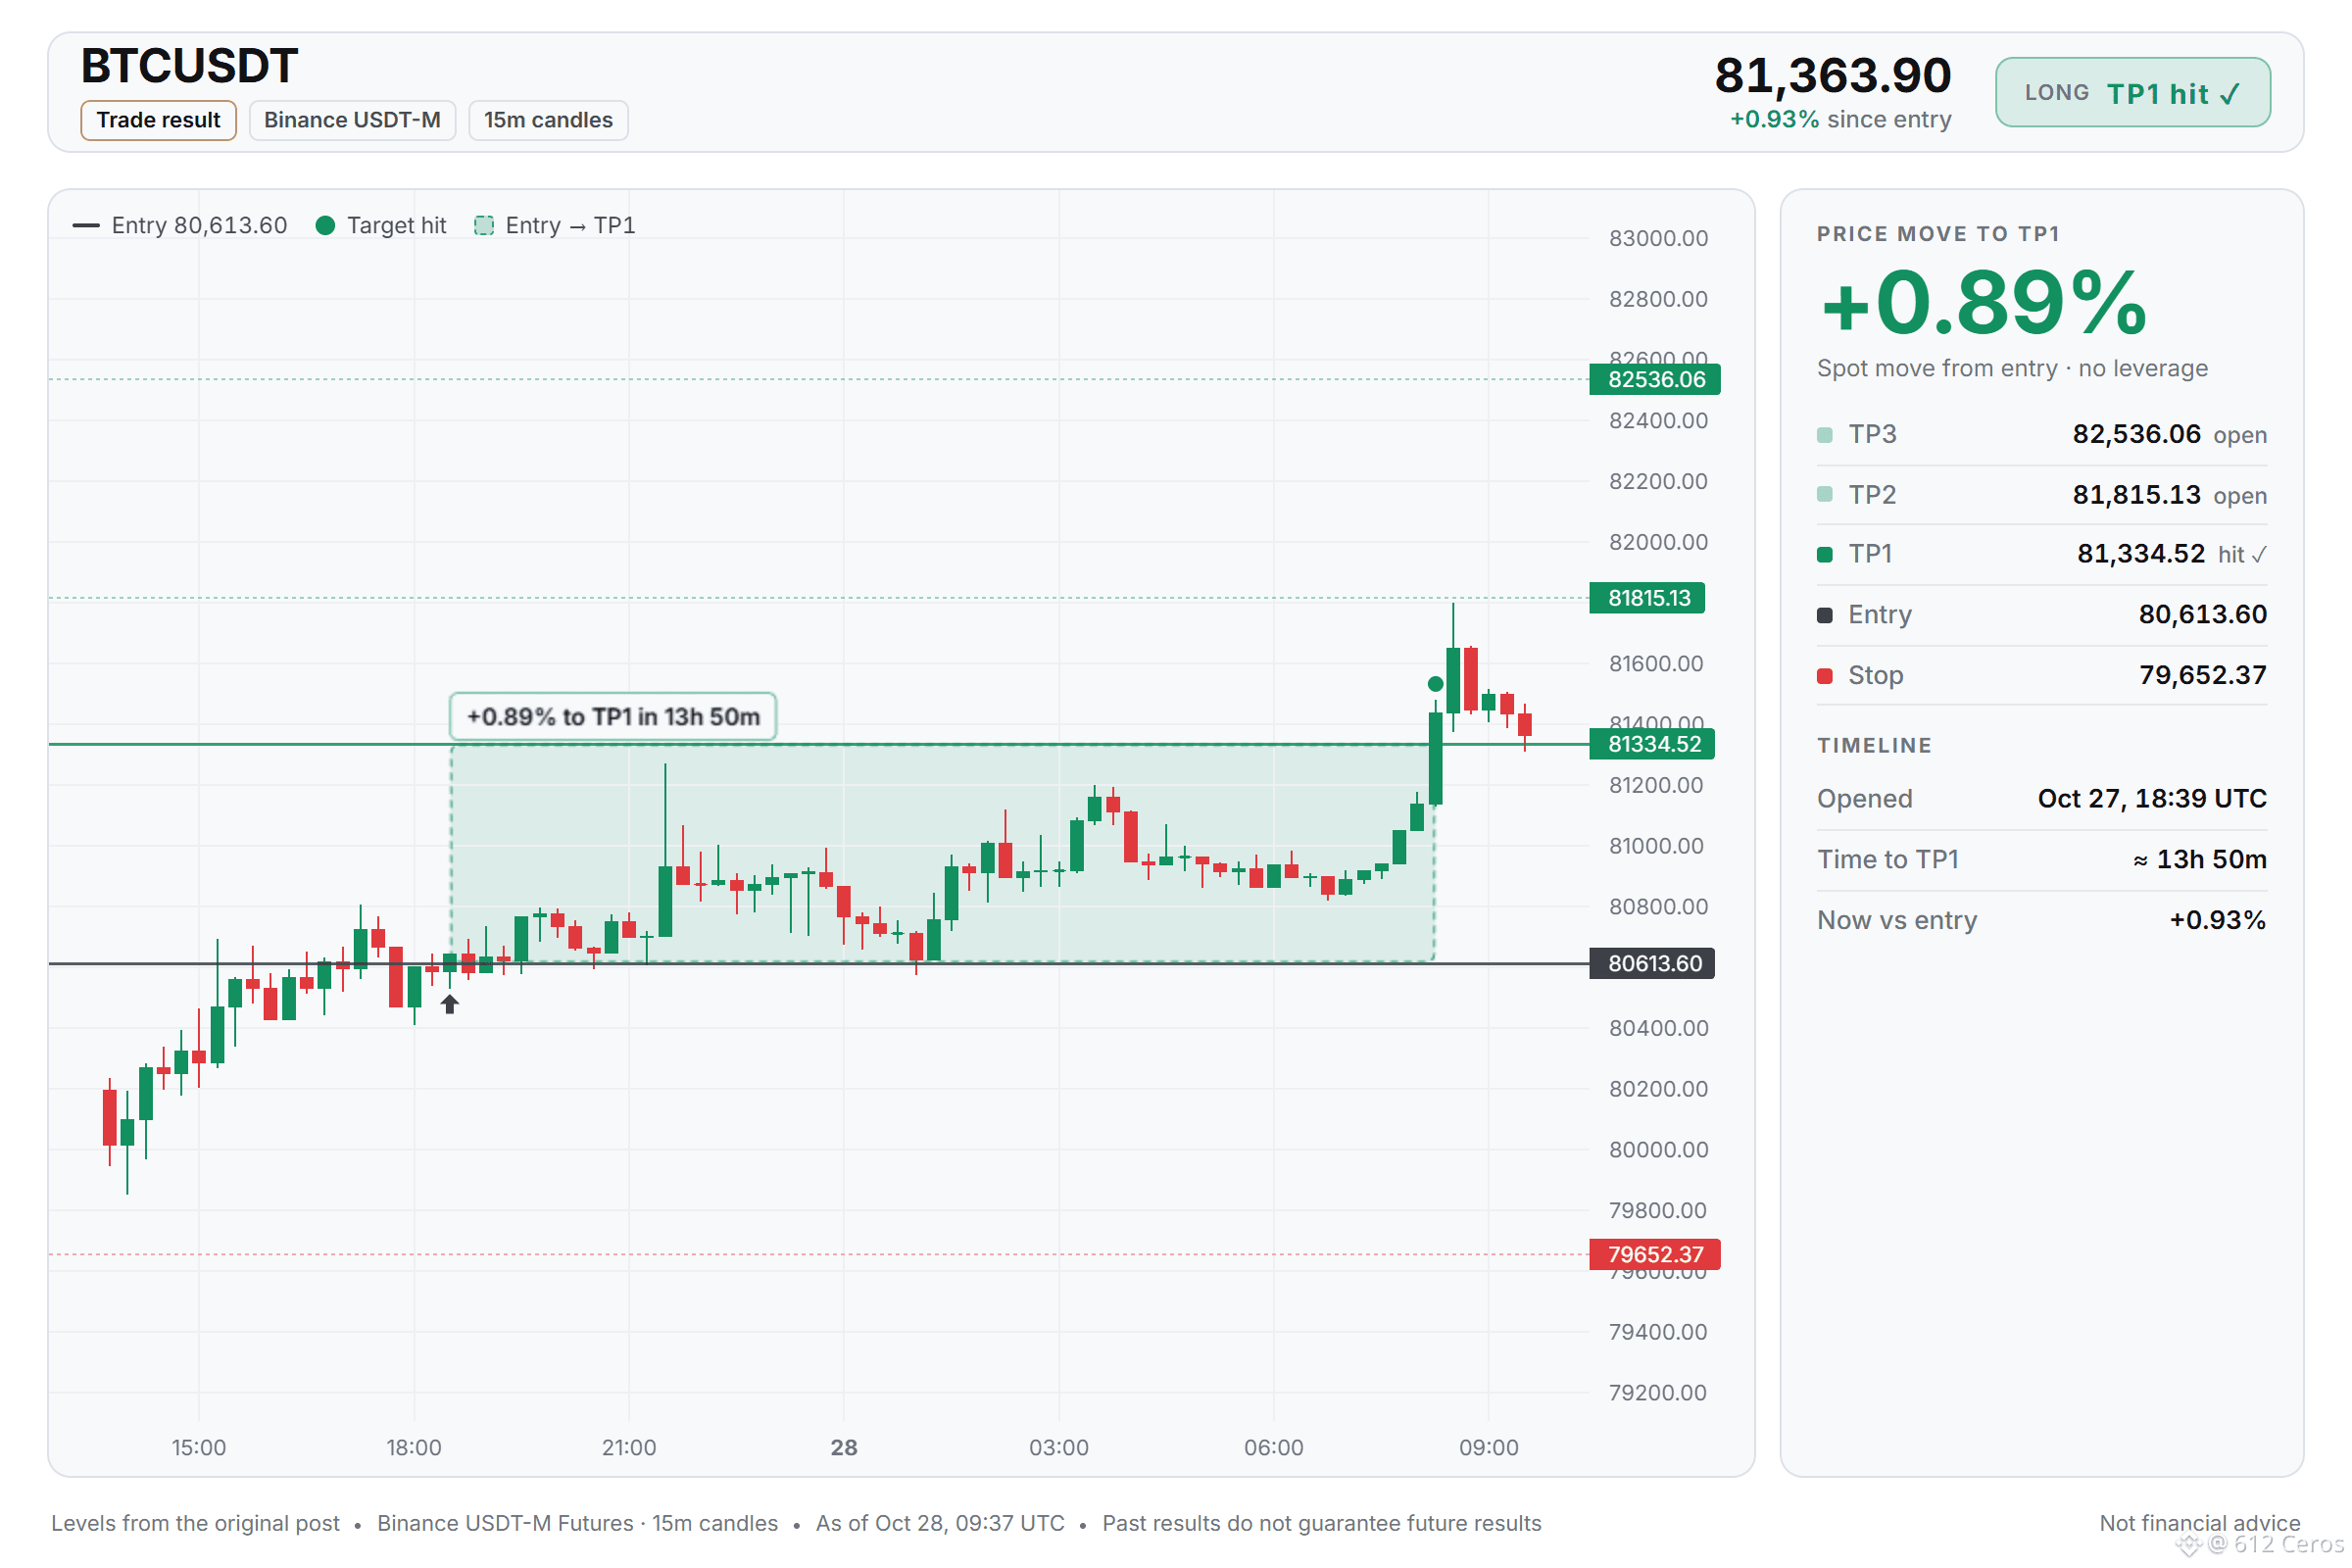
BTCUSDT long hit TP1 🎯 Spot move was +0.89% in about 13h 50m. Reminder to always manage risk and size positions appropriately.
BTCUSDT long hit TP1 🎯 Spot move was +0.89% in about 13h 50m. Reminder to always manage risk and size positions appropriately.
612 Ceros
·
--
HaussierWhy is BTC breaking out now?
🟢 LONG $BTC /USDT: expecting price to go UP
Bias: LONG · Leaning
Entry: 80564.97 – 80662.23
TP1: 81334.52 (+0.9%)
TP2: 81815.13 (+1.5%)
TP3: 82536.06 (+2.4%)
SL: 79652.37 (-1.2%)
Plan: enter only inside the zone, close 50% at TP1, 25% at TP2, 25% at TP3, and move the stop to entry after TP1.
Note: moderate conviction only, keep size light.
Why LONG? 3/12 signals agree, 1 against.
• Buyers are driving the move (15m ADX 26.8)
• BTC is rising, this coin follows (corr 1.00)
• Buyers have the momentum (1h RSI 57.0)
Risk: 4h trend down (below EMA50 & EMA200)
If it plays out:
If the 1h price holds above 80613, buyers take it toward 81334. RSI at 57 means momentum favors them.
If it fails:
The 4h bearish stack fails and price drops below 79652, so I would exit.
What is your level on this long?
Levels mapped on the chart below.
📲 Want more of my latest signals? Join me here:
https://app.binance.com/uni-qr/D26WbL9t
⚠️ Personal market analysis only. NFA — manage risk and DYOR.
Educational content, not investment advice or a recommendation to buy, sell, deposit, or withdraw any asset. No paid promotion or referral/affiliate links.
645
·
--
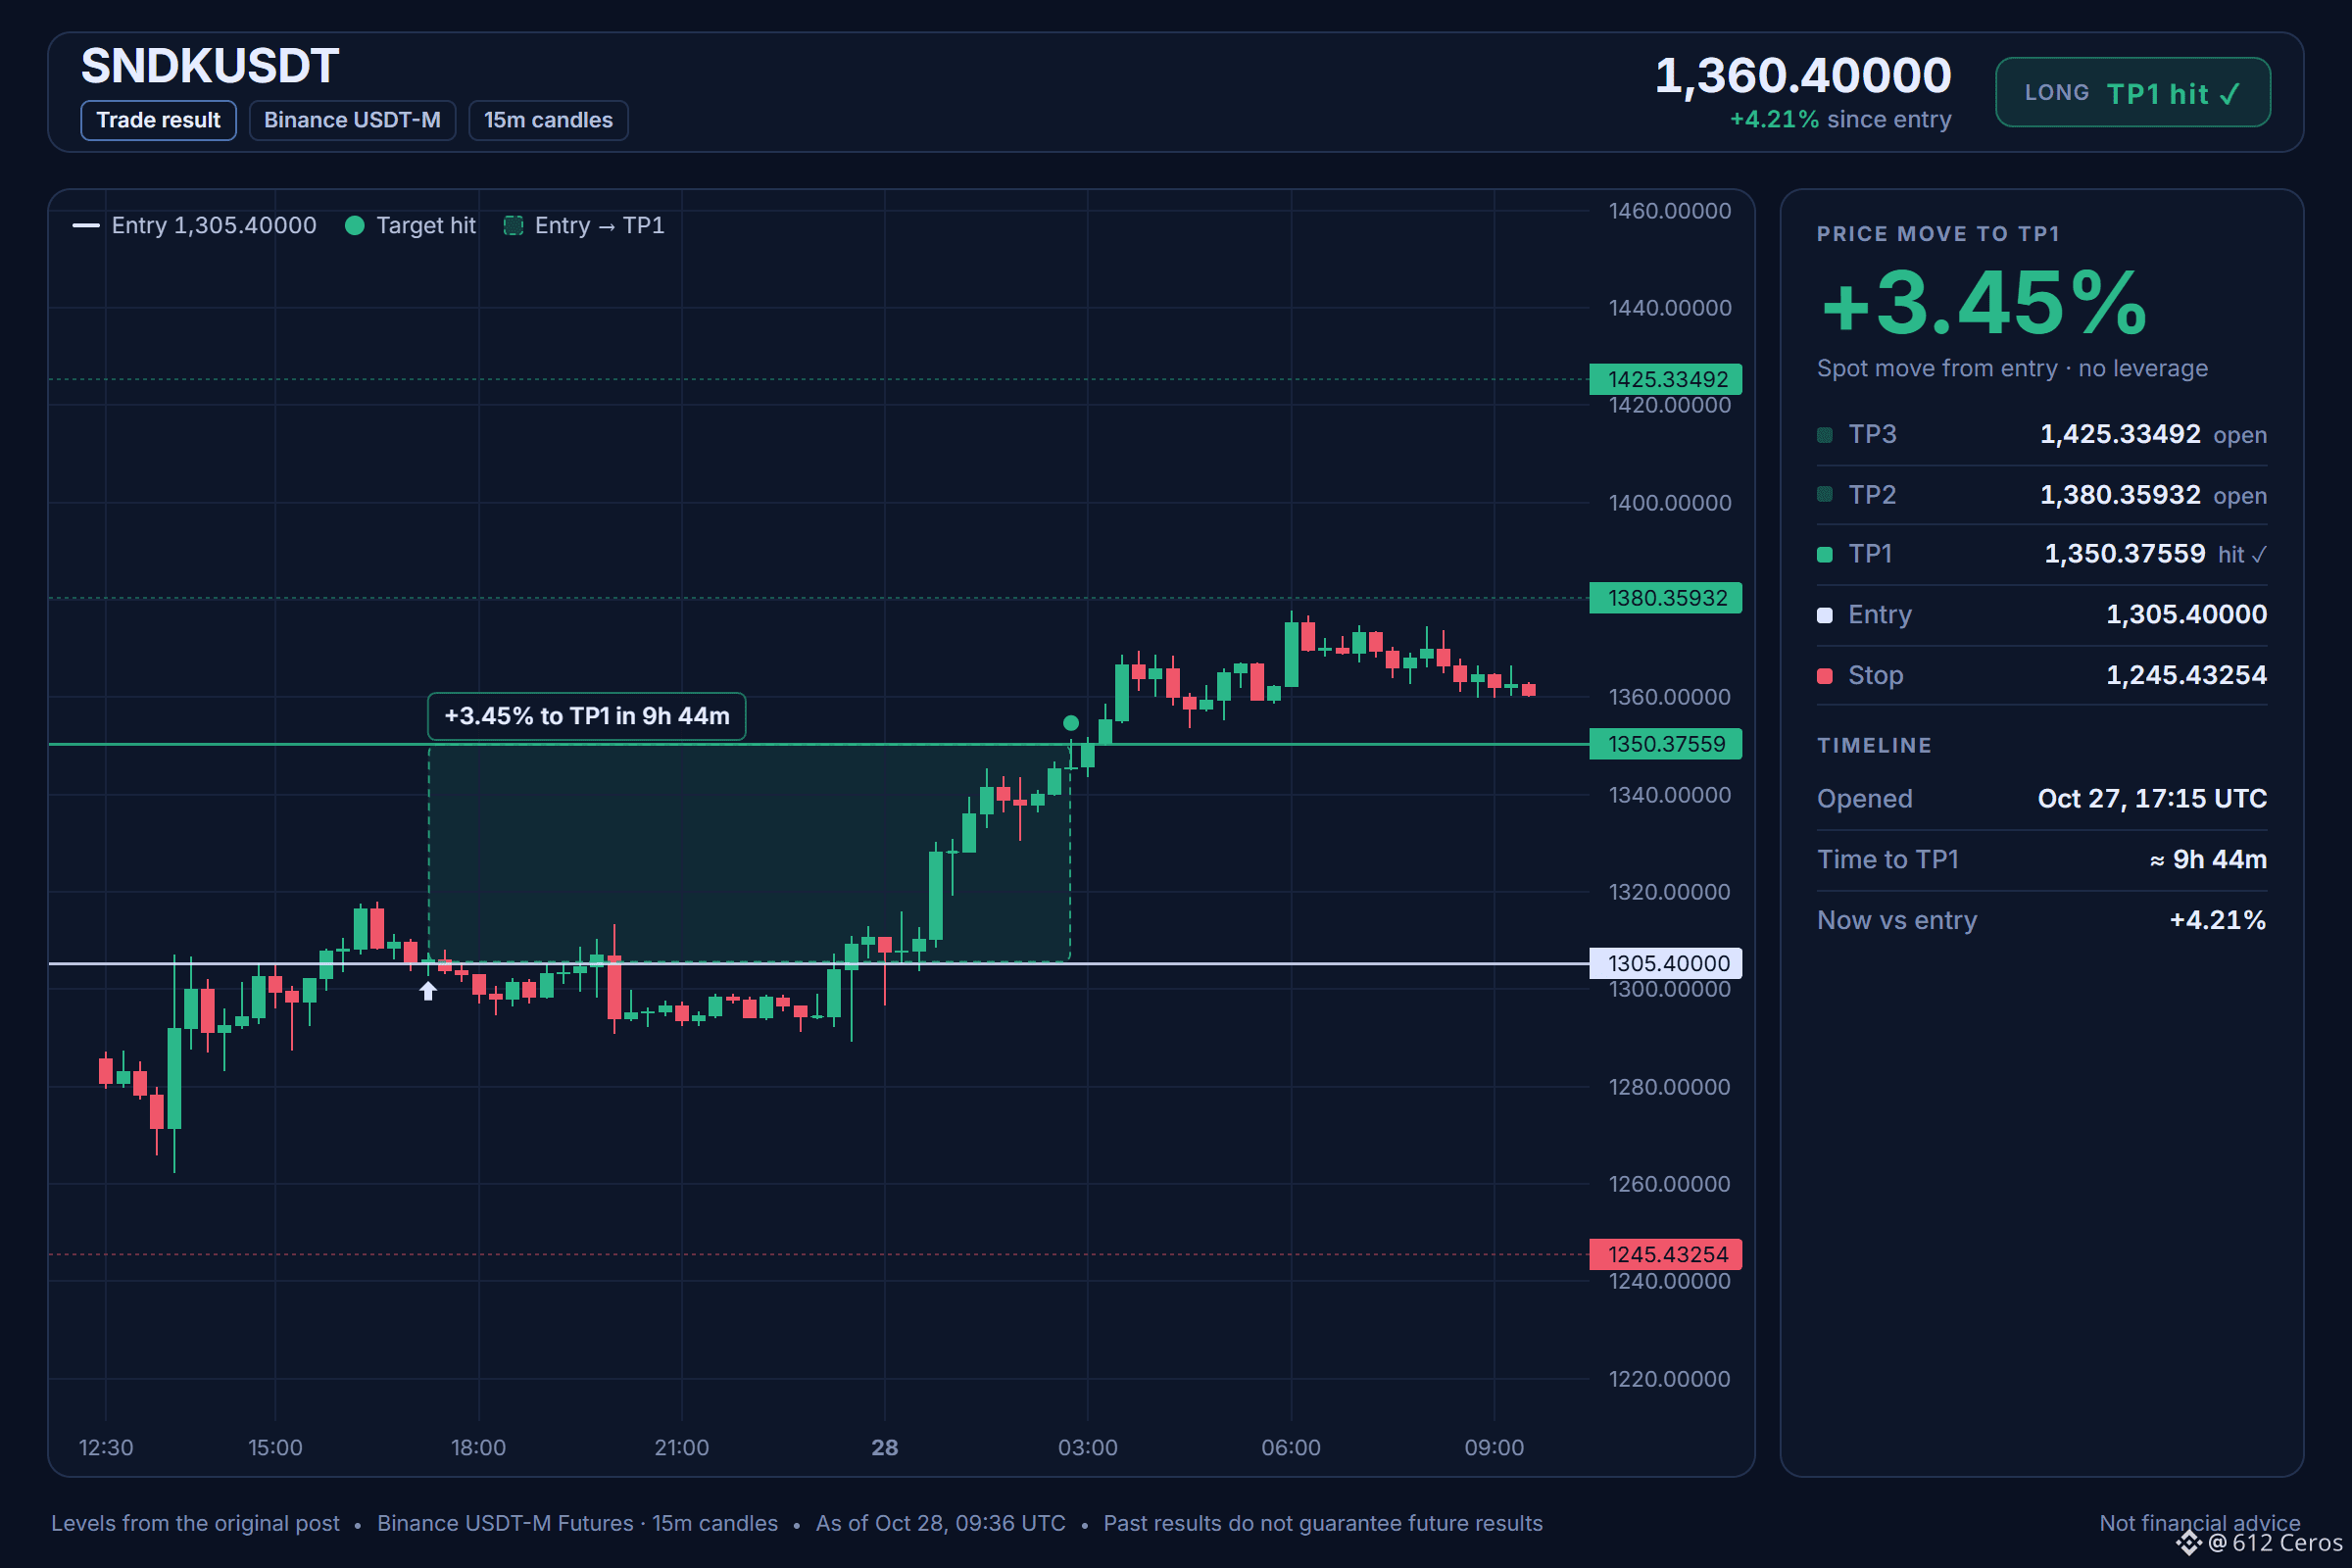
LONG setup on SNDKUSDT hit TP1 🎯 Spot move was +3.45% from entry in about 9h 44m. Great move, but always manage your risk. Good luck out there 🚀
LONG setup on SNDKUSDT hit TP1 🎯 Spot move was +3.45% from entry in about 9h 44m. Great move, but always manage your risk. Good luck out there 🚀
612 Ceros
·
--
Haussier🟢 LONG $SNDK /USDT: expecting price to go UP
Bias: LONG · Leaning
Entry: 1302.89706 – 1307.90294
TP1: 1350.37559 (+3.4%)
TP2: 1380.35932 (+5.7%)
TP3: 1425.33492 (+9.2%)
SL: 1245.43254 (-4.6%)
Plan: enter only inside the zone, close 50% at TP1, 25% at TP2, 25% at TP3, and move the stop to entry after TP1.
Caution: counter-trend idea backed by 4 signals only. Smaller size, hard stop.
Fading the daily trend, SNDK leans long.
Why LONG? 4/12 signals agree, 1 against.
• Buyers are driving the move (15m ADX 26.1)
• Buyers have the momentum (4h RSI 61.5)
• Buyers have the momentum (1h RSI 70.1)
Risk: Daily trend down (below EMA50 & EMA200)
This is a counter-trend reversal bet against the bearish daily trend, so size down and respect the stop. The 1h price is 1305.4, and the 1h RSI shows buyers have the momentum at 70.1.
Where do you stand on this reversal trade?
Chart with every level below.
📲 Want more of my latest signals? Join me here:
https://app.binance.com/uni-qr/D26WbL9t
⚠️ Personal market analysis only. NFA — manage risk and DYOR.
Educational content, not investment advice or a recommendation to buy, sell, deposit, or withdraw any asset. No paid promotion or referral/affiliate links.
578
·
--
Haussier
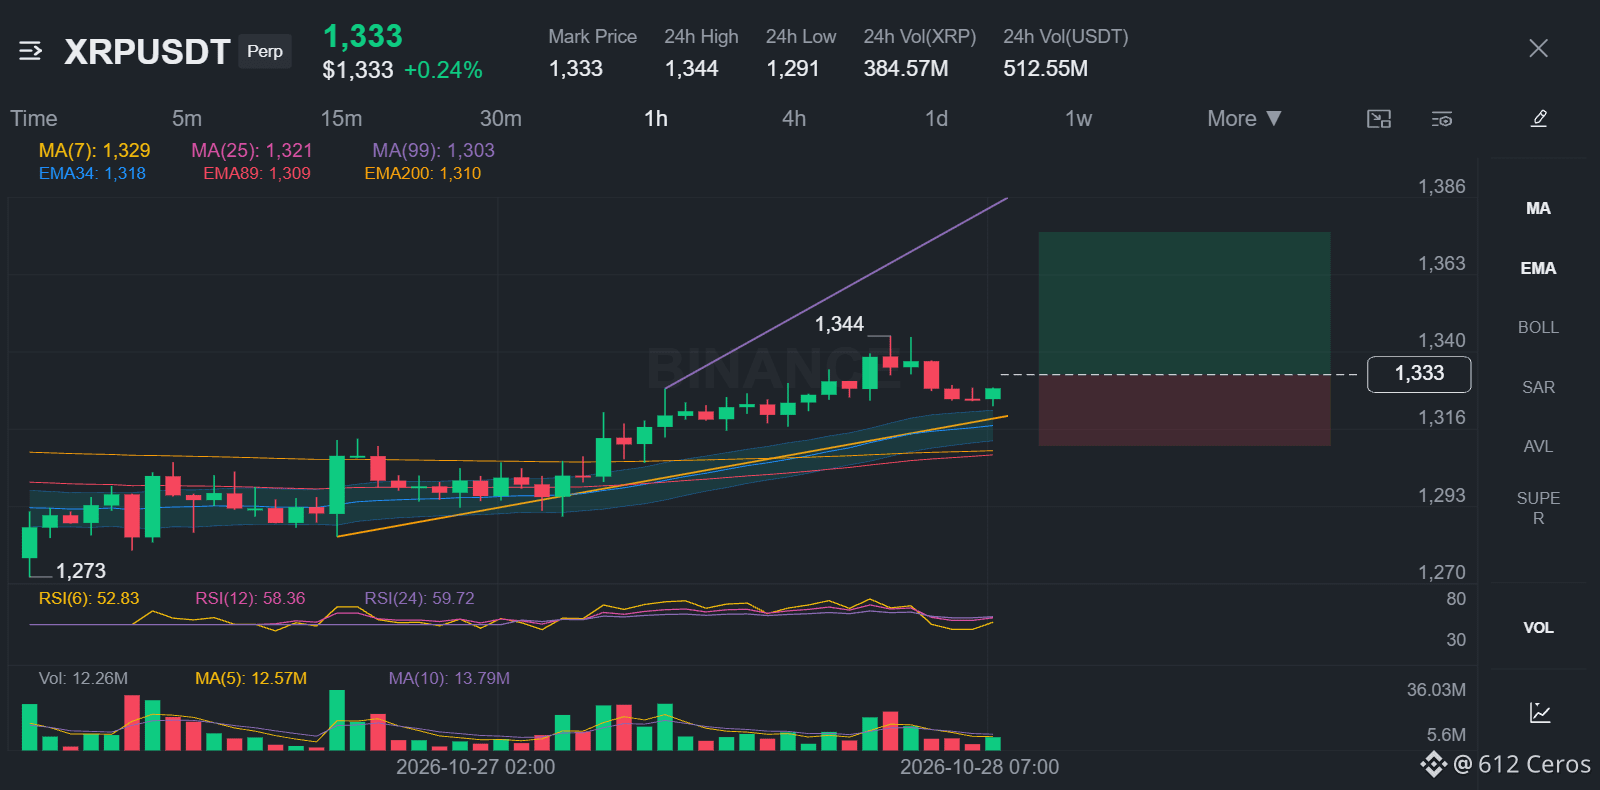
I am buying XRP against a bearish daily trend.
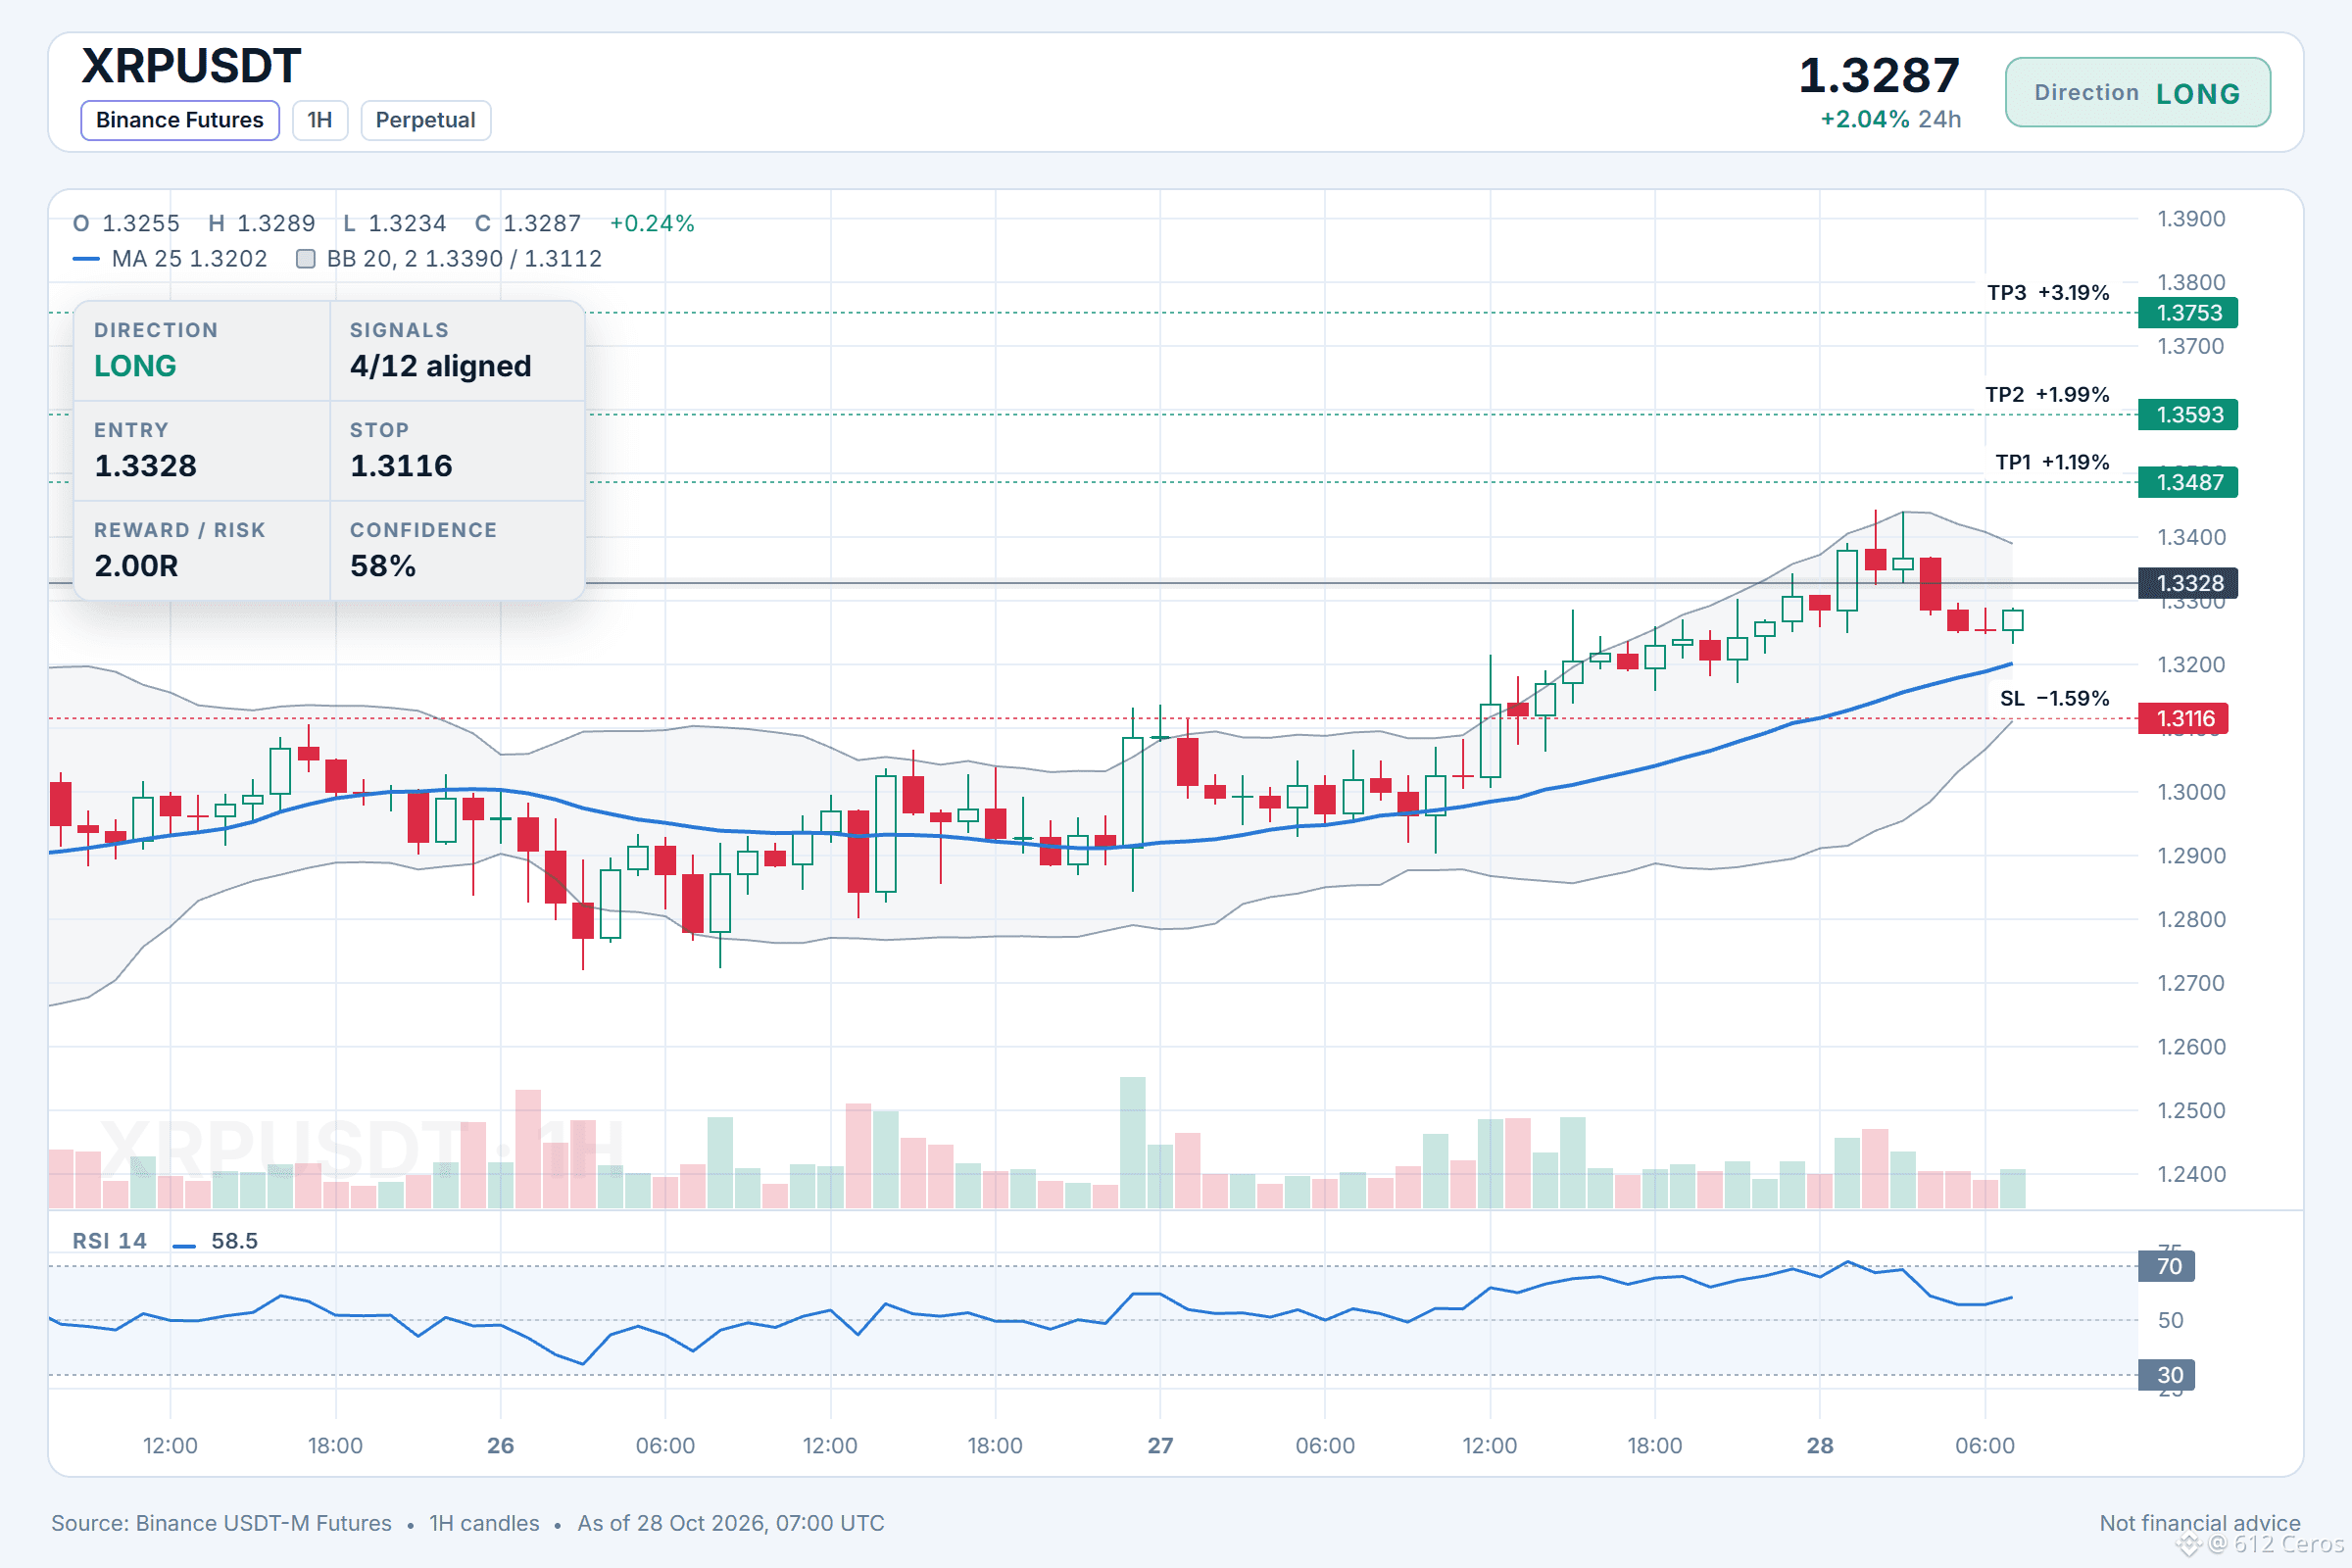
🟢 LONG $XRP /USDT: expecting price to go UP
Bias: LONG · Leaning
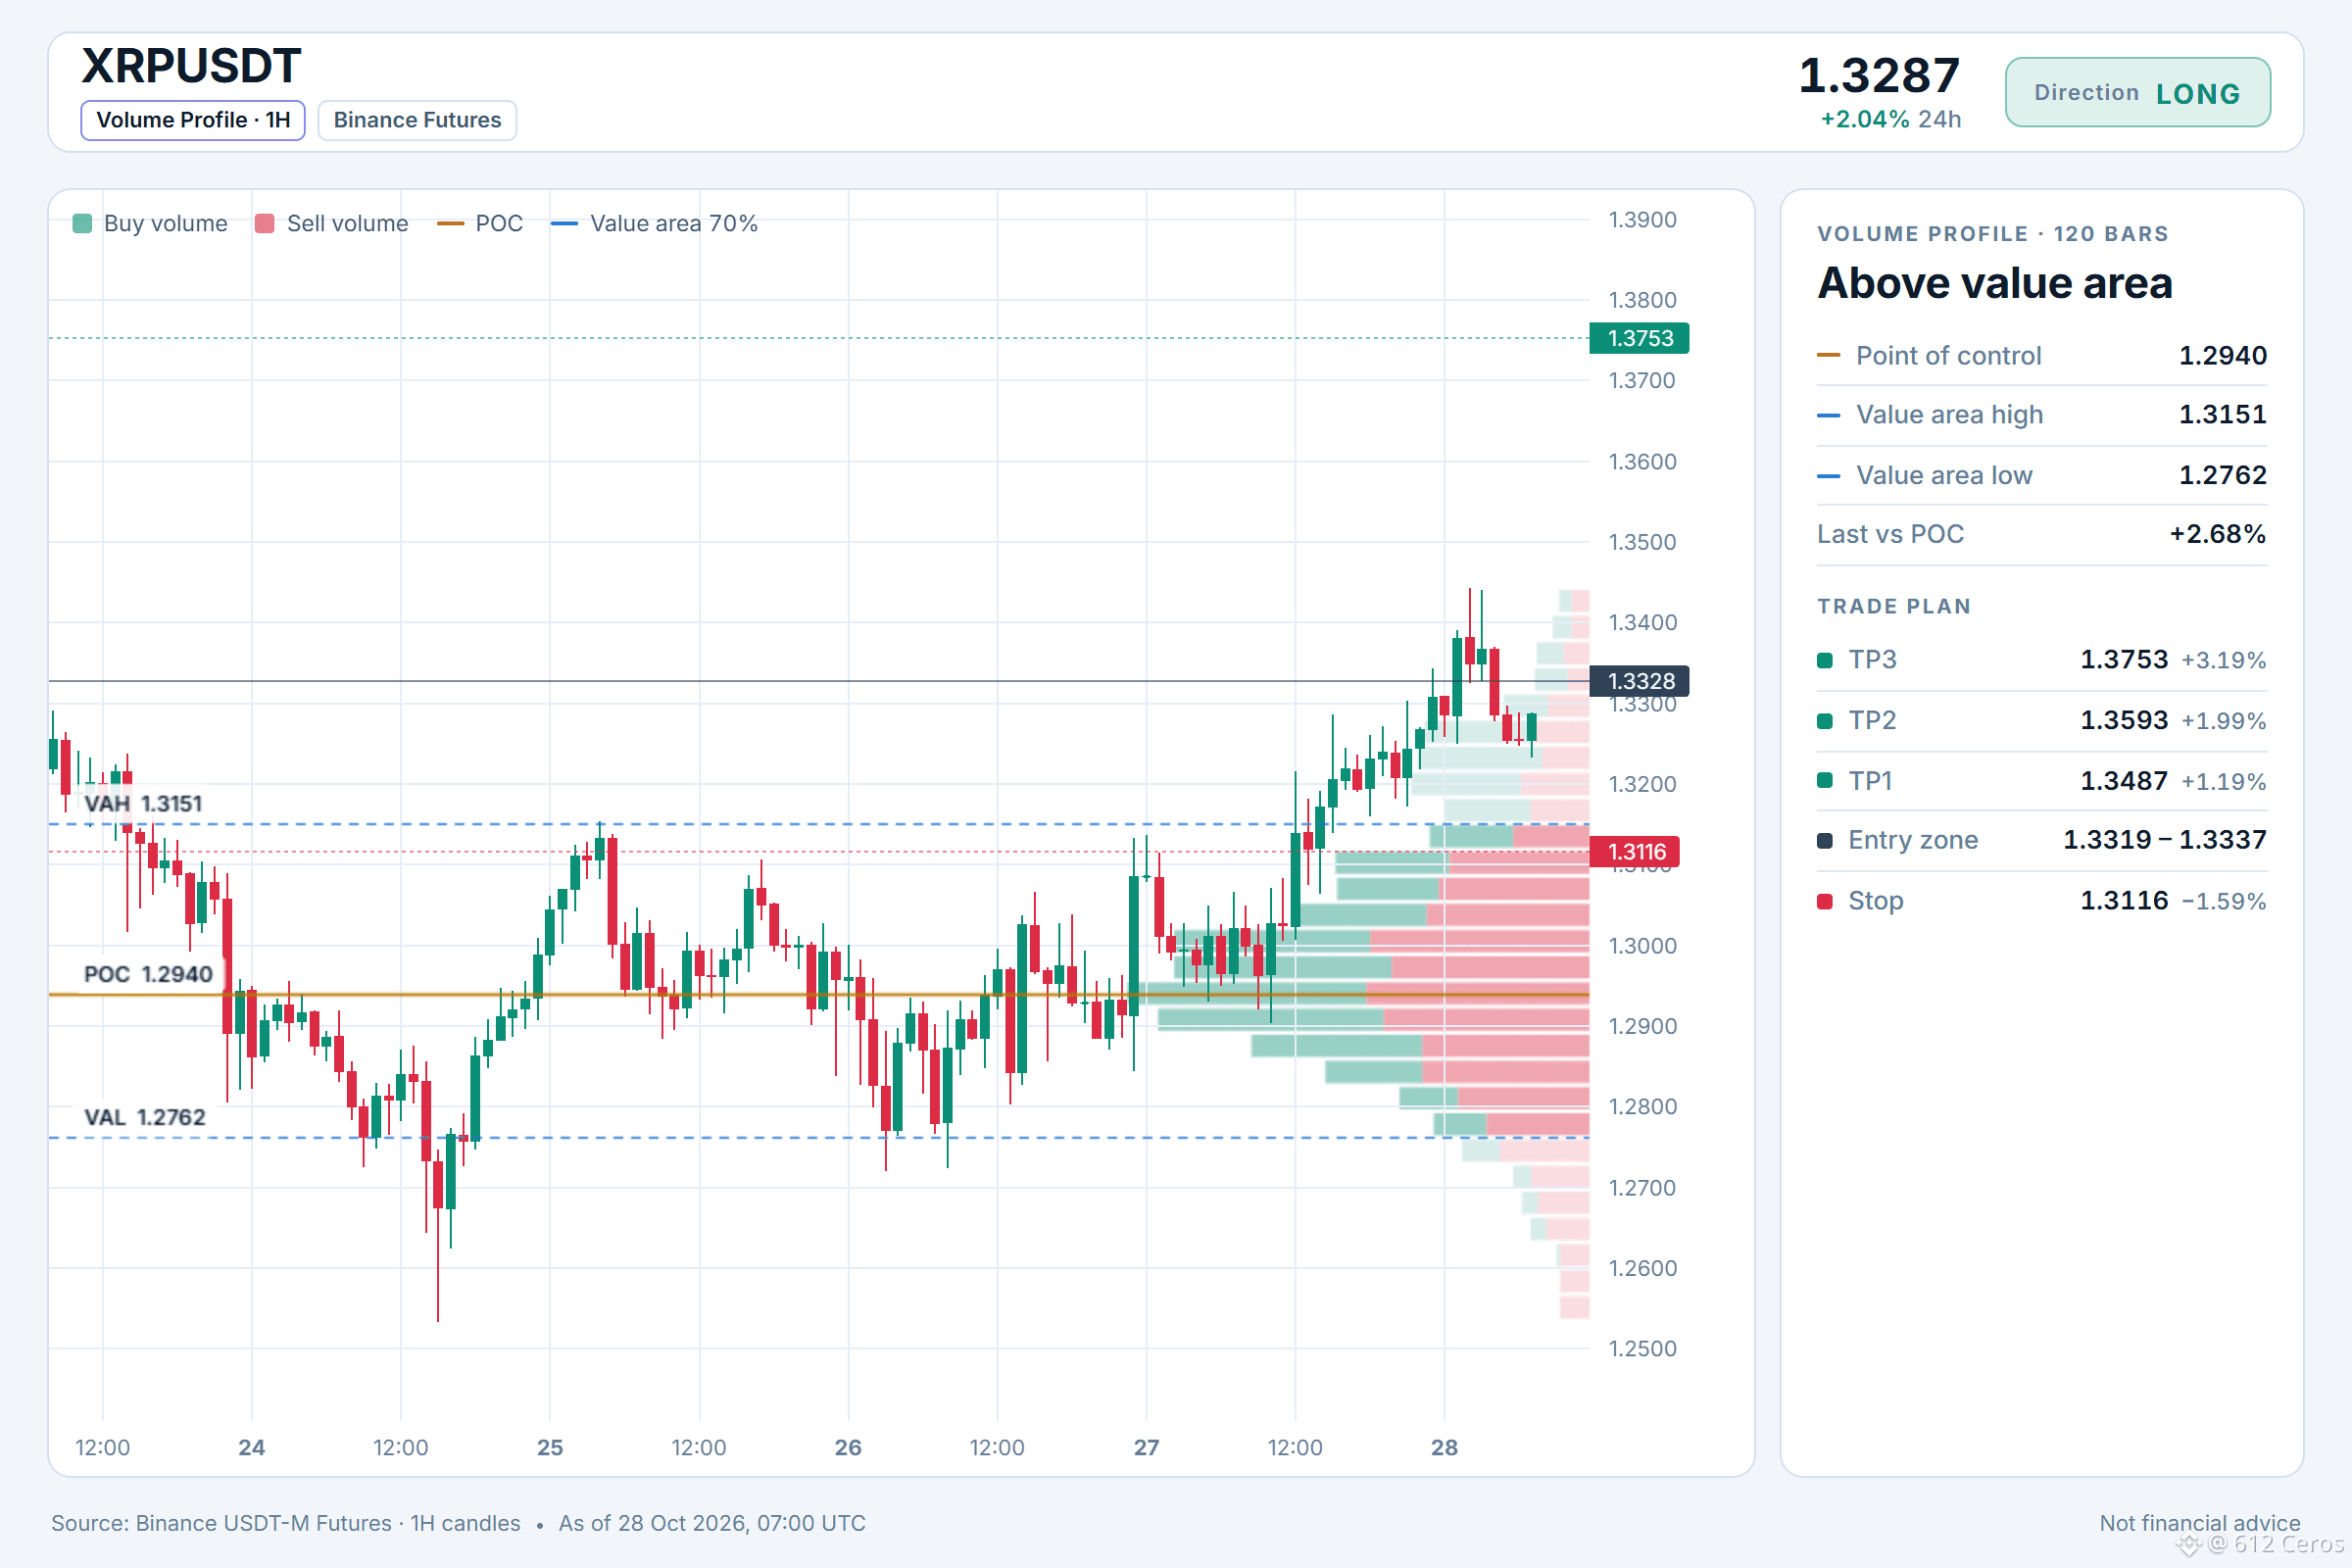
Entry: 1.3319 – 1.3337
TP1: 1.3487 (+1.2%)
TP2: 1.3593 (+2.0%)
TP3: 1.3753 (+3.2%)
SL: 1.3116 (-1.6%)
Plan: enter only inside the zone, close 50% at TP1, 25% at TP2, 25% at TP3, and move the stop to entry after TP1.
Caution: counter-trend setup against the bigger trend, only 4 signals confirm it. Size down, respect the stop.
Why LONG? 4/12 signals agree, 1 against.
• 1h trend up (above EMA50 & EMA200)
• BTC is rising, this coin follows (corr 0.75)
• Buyers have the momentum (4h RSI 59.5)
Risk: Daily trend down (below EMA50 & EMA200)
Journal note: XRP
I'm watching the 1h price at 1.3328, where the short-term trend is up with price above EMA50 and EMA200. I want to see the daily trend remain bearish while the 1h RSI at 61.43 shows buyers have the momentum, making this a counter-trend reversal bet against the higher timeframe. Size down and respect the stop at 1.3116.
Where do you set your invalidation if you are short?
Full setup on the chart below.
{future}(XRPUSDT)
📲 Want more of my latest signals? Join me here:
[https://app.binance.com/uni-qr/D26WbL9t](https://app.binance.com/uni-qr/D26WbL9t)
⚠️ Personal market analysis only. NFA — manage risk and DYOR.
Educational content, not investment advice or a recommendation to buy, sell, deposit, or withdraw any asset. No paid promotion or referral/affiliate links.
I am buying XRP against a bearish daily trend.
🟢 LONG $XRP /USDT: expecting price to go UP
Bias: LONG · Leaning
Entry: 1.3319 – 1.3337
TP1: 1.3487 (+1.2%)
TP2: 1.3593 (+2.0%)
TP3: 1.3753 (+3.2%)
SL: 1.3116 (-1.6%)
Plan: enter only inside the zone, close 50% at TP1, 25% at TP2, 25% at TP3, and move the stop to entry after TP1.
Caution: counter-trend setup against the bigger trend, only 4 signals confirm it. Size down, respect the stop.
Why LONG? 4/12 signals agree, 1 against.
• 1h trend up (above EMA50 & EMA200)
• BTC is rising, this coin follows (corr 0.75)
• Buyers have the momentum (4h RSI 59.5)
Risk: Daily trend down (below EMA50 & EMA200)
Journal note: XRP
I'm watching the 1h price at 1.3328, where the short-term trend is up with price above EMA50 and EMA200. I want to see the daily trend remain bearish while the 1h RSI at 61.43 shows buyers have the momentum, making this a counter-trend reversal bet against the higher timeframe. Size down and respect the stop at 1.3116.
Where do you set your invalidation if you are short?
Full setup on the chart below.
📲 Want more of my latest signals? Join me here:
https://app.binance.com/uni-qr/D26WbL9t
⚠️ Personal market analysis only. NFA — manage risk and DYOR.
Educational content, not investment advice or a recommendation to buy, sell, deposit, or withdraw any asset. No paid promotion or referral/affiliate links.
4
872
·
--
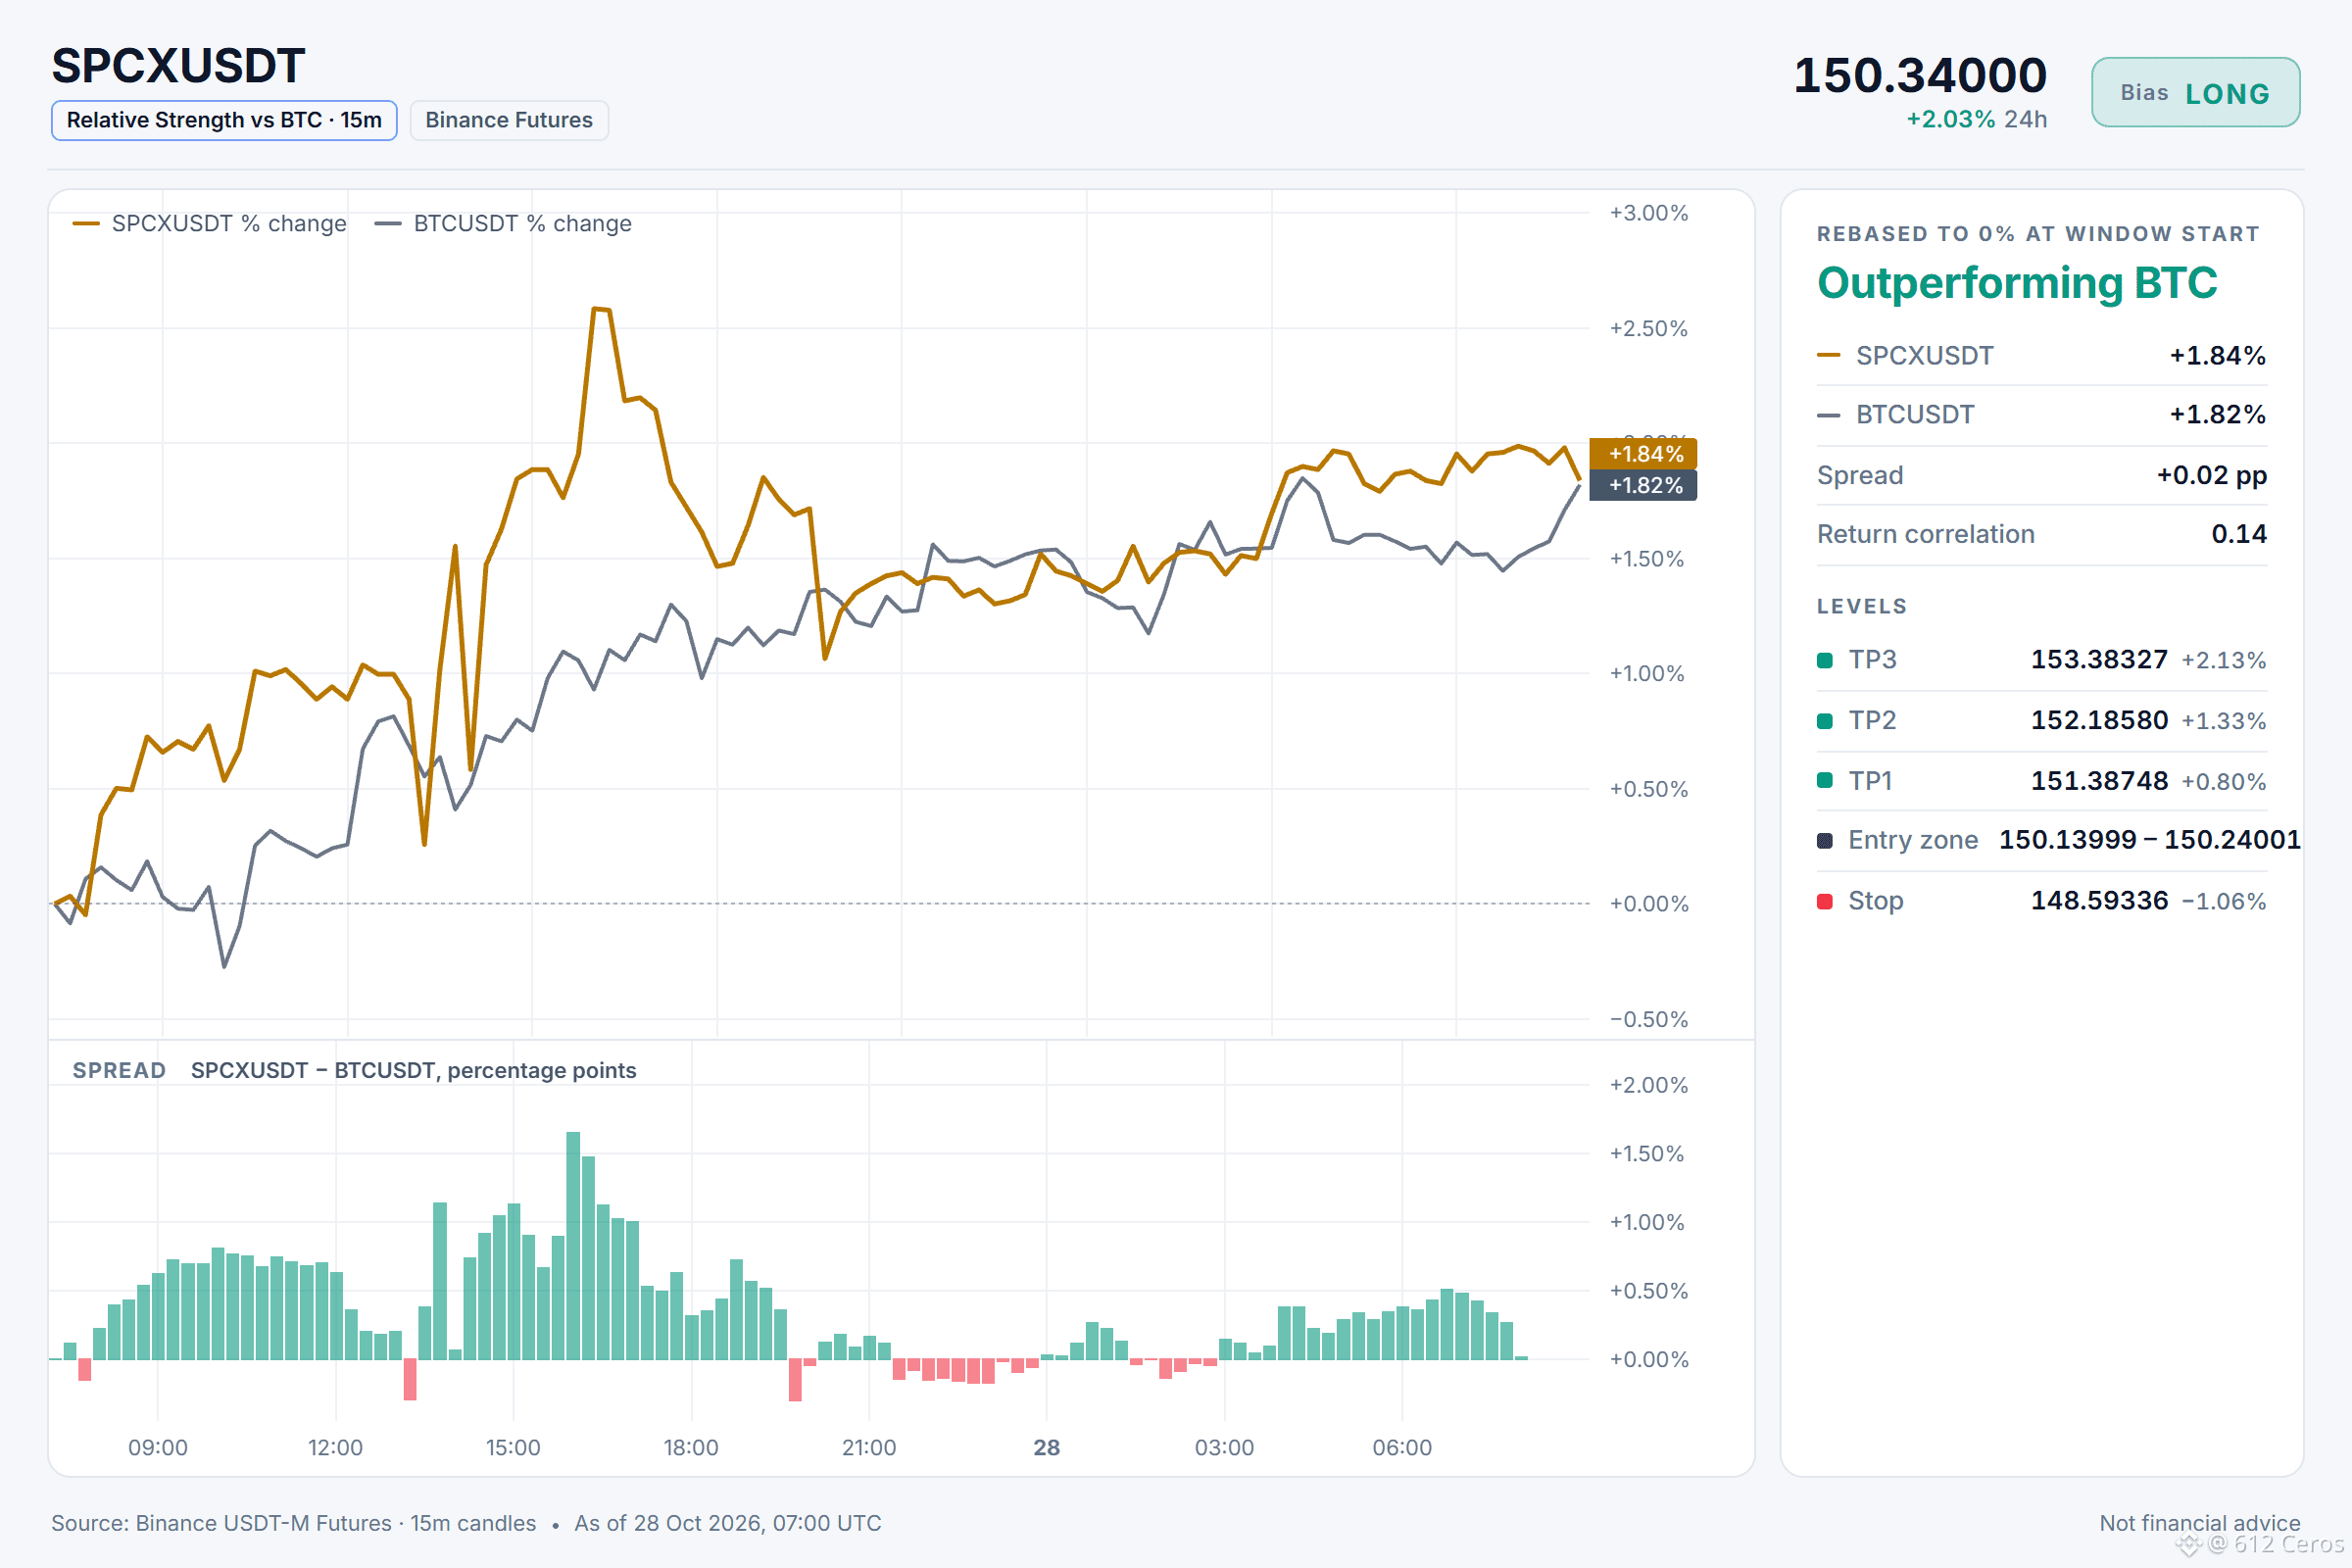
Haussier
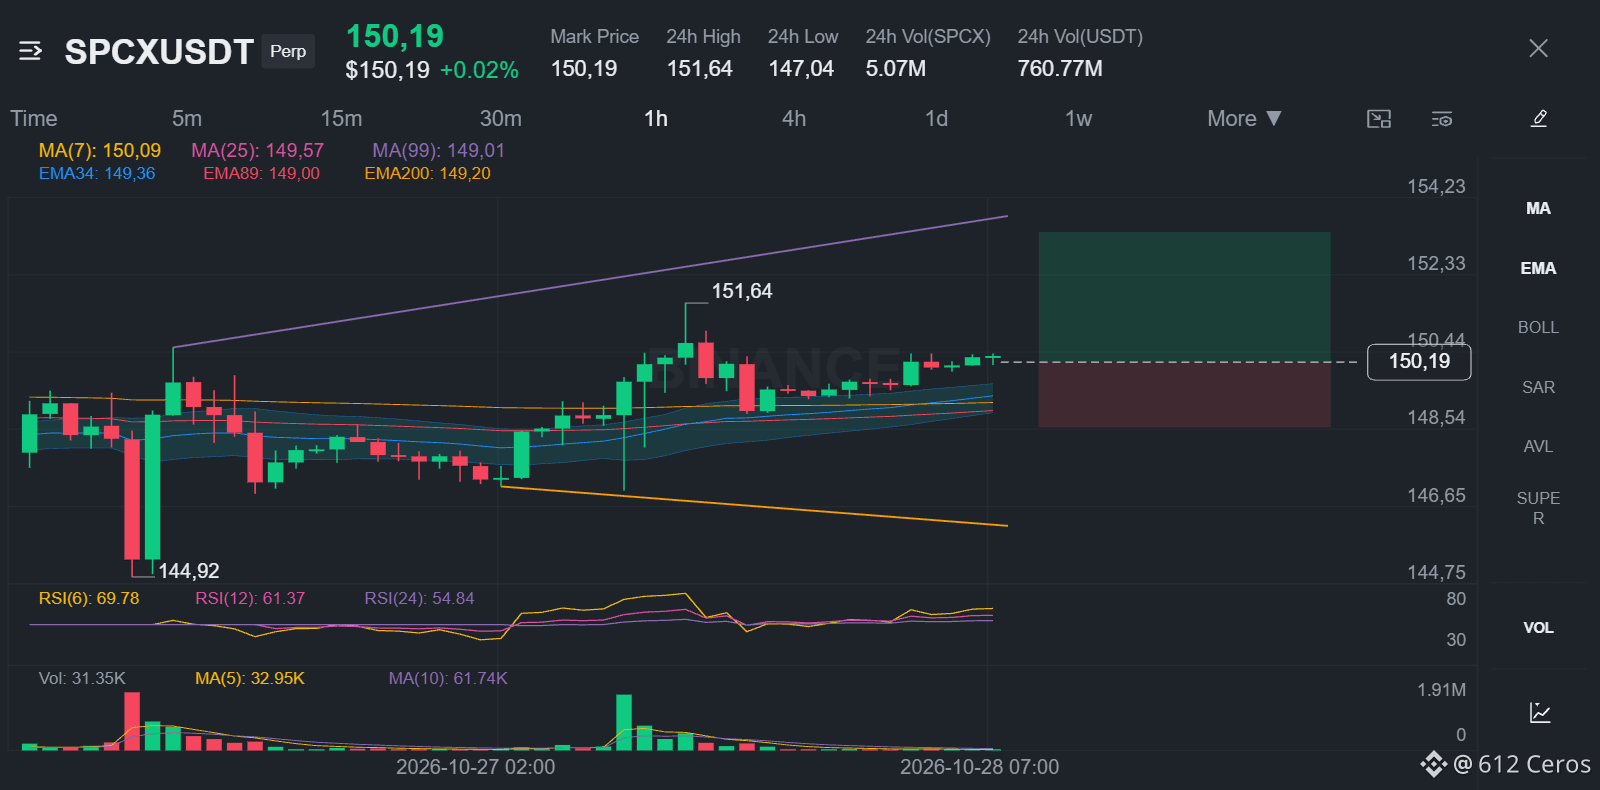
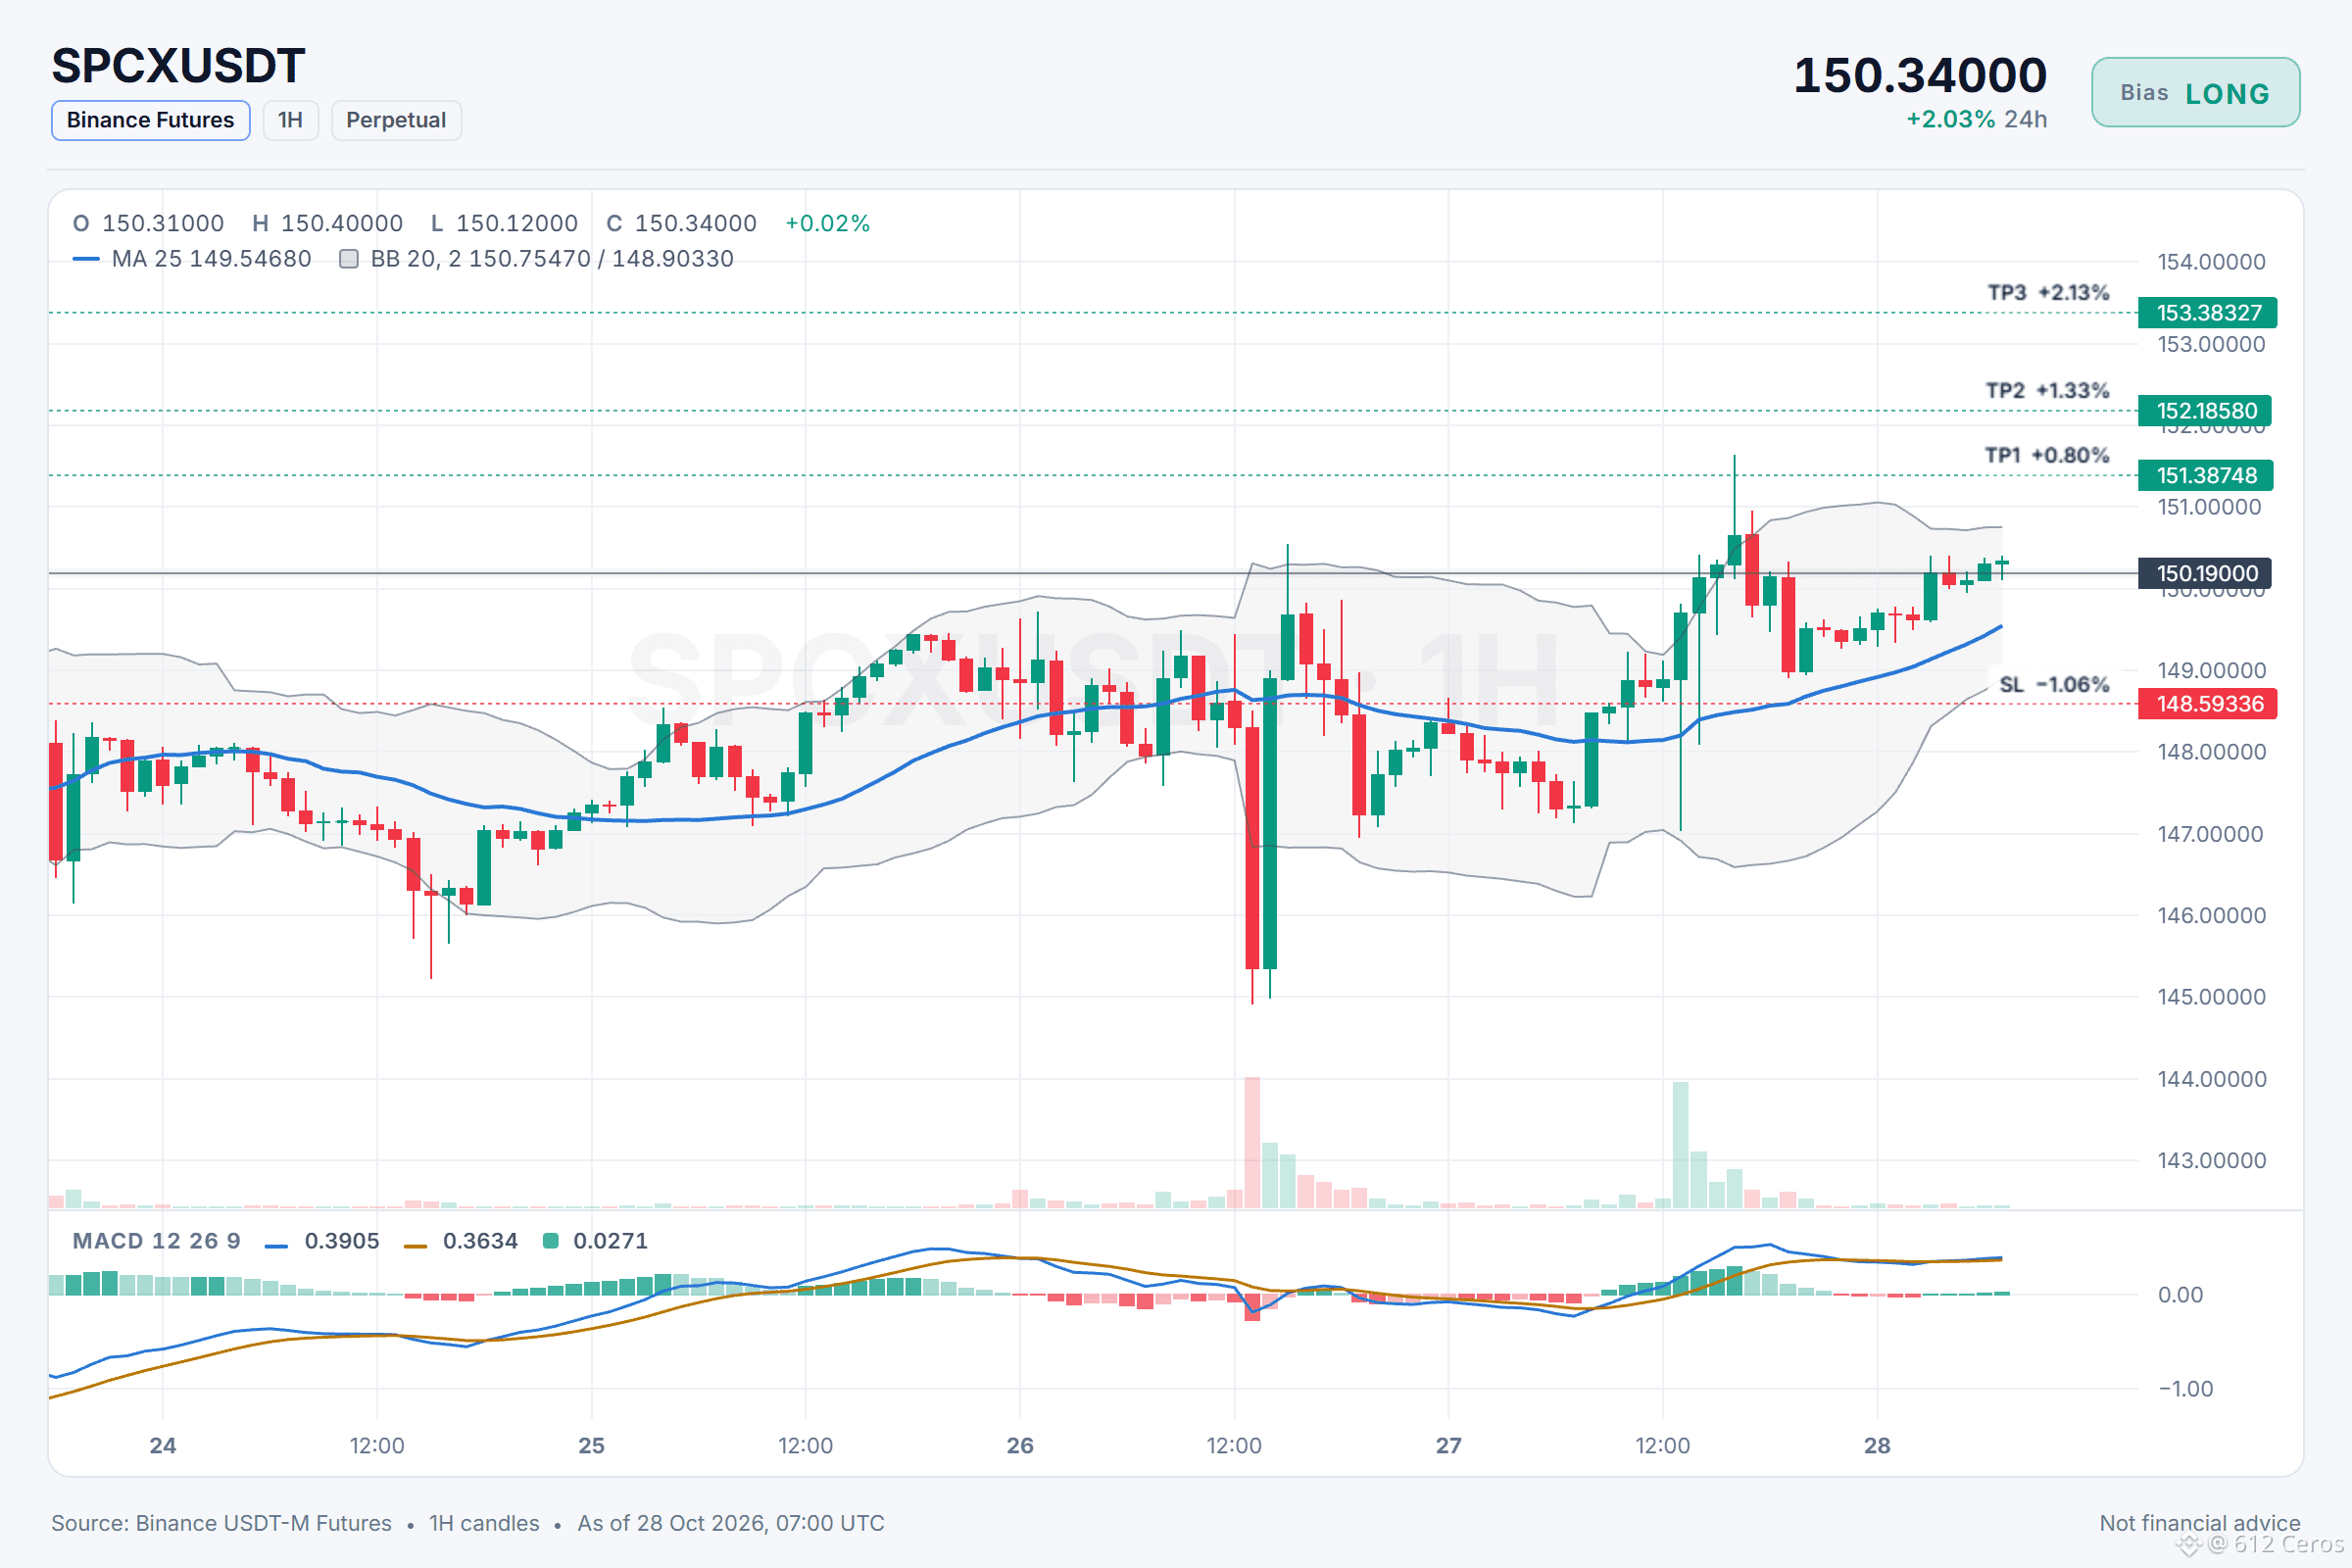
🟢 LONG $SPCX /USDT: expecting price to go UP
Bias: LONG · Leaning
Entry: 150.13999 – 150.24001
TP1: 151.38748 (+0.8%)
TP2: 152.18580 (+1.3%)
TP3: 153.38327 (+2.1%)
SL: 148.59336 (-1.1%)
Plan: enter only inside the zone, close 50% at TP1, 25% at TP2, 25% at TP3, and move the stop to entry after TP1.
Note: moderate conviction only, keep size light.
SPCX is pressing above its moving averages
Why LONG? 4/11 signals agree, 1 against.
• 1h trend up (above EMA50 & EMA200)
• Buyers are driving the move (15m ADX 29.3)
• Buyers have the momentum (4h RSI 55.4)
Risk: Volume backs the sellers (volume z +1.5)
The 1h price is above EMA50 and EMA200, and ADX 29.3 shows buyers in control with DI+ at 22.6 versus DI- at 11.7.
Where do you place your invalidation level?
Full setup on the chart below.
{future}(SPCXUSDT)
📲 Want more of my latest signals? Join me here:
[https://app.binance.com/uni-qr/D26WbL9t](https://app.binance.com/uni-qr/D26WbL9t)
⚠️ Personal market analysis only. NFA — manage risk and DYOR.
Educational content, not investment advice or a recommendation to buy, sell, deposit, or withdraw any asset. No paid promotion or referral/affiliate links.
🟢 LONG $SPCX /USDT: expecting price to go UP
Bias: LONG · Leaning
Entry: 150.13999 – 150.24001
TP1: 151.38748 (+0.8%)
TP2: 152.18580 (+1.3%)
TP3: 153.38327 (+2.1%)
SL: 148.59336 (-1.1%)
Plan: enter only inside the zone, close 50% at TP1, 25% at TP2, 25% at TP3, and move the stop to entry after TP1.
Note: moderate conviction only, keep size light.
SPCX is pressing above its moving averages
Why LONG? 4/11 signals agree, 1 against.
• 1h trend up (above EMA50 & EMA200)
• Buyers are driving the move (15m ADX 29.3)
• Buyers have the momentum (4h RSI 55.4)
Risk: Volume backs the sellers (volume z +1.5)
The 1h price is above EMA50 and EMA200, and ADX 29.3 shows buyers in control with DI+ at 22.6 versus DI- at 11.7.
Where do you place your invalidation level?
Full setup on the chart below.
📲 Want more of my latest signals? Join me here:
https://app.binance.com/uni-qr/D26WbL9t
⚠️ Personal market analysis only. NFA — manage risk and DYOR.
Educational content, not investment advice or a recommendation to buy, sell, deposit, or withdraw any asset. No paid promotion or referral/affiliate links.
537
·
--
Haussier
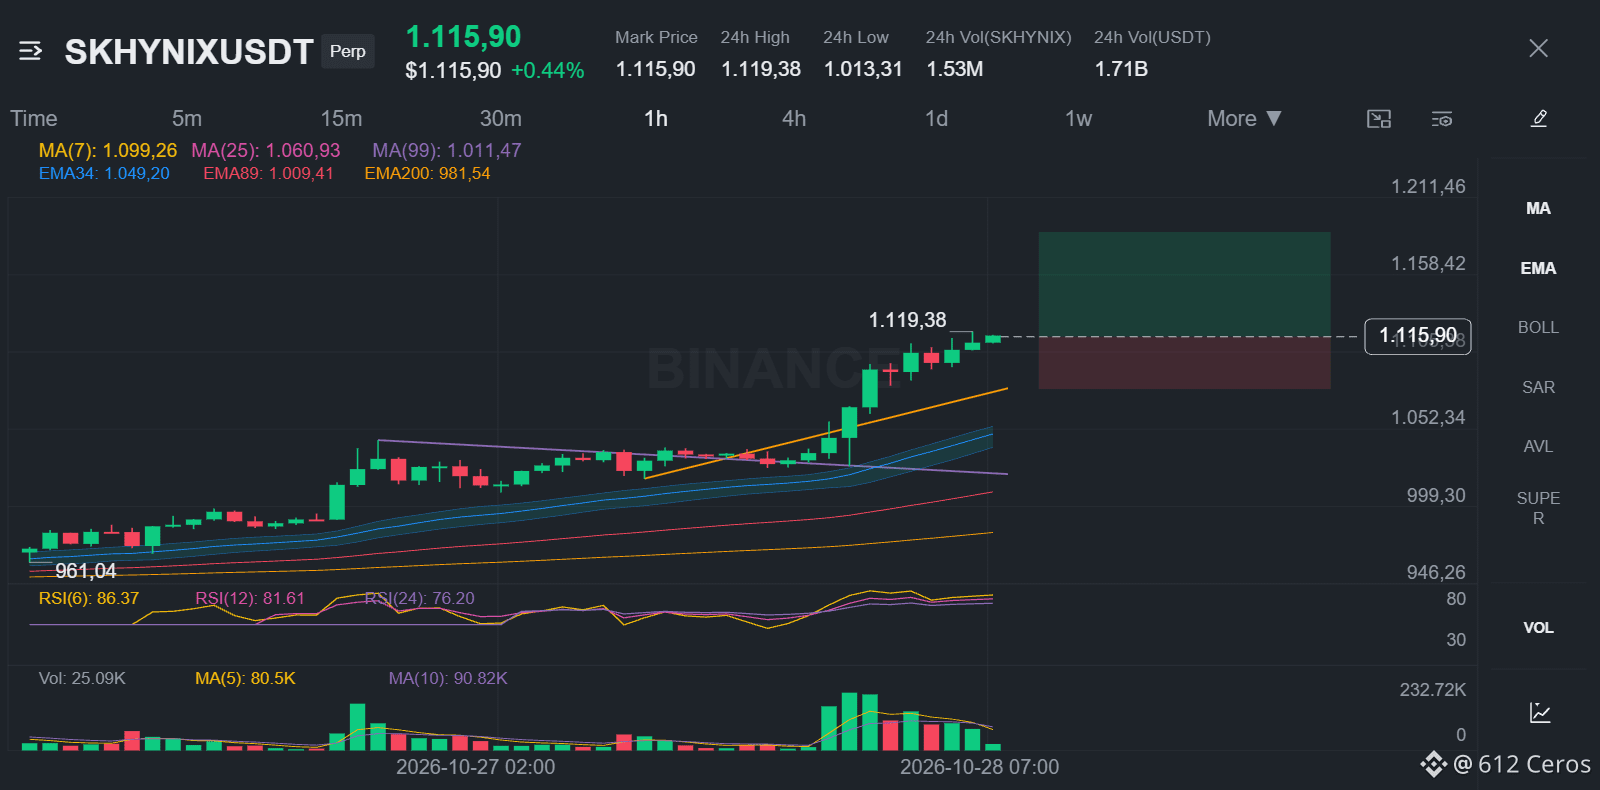
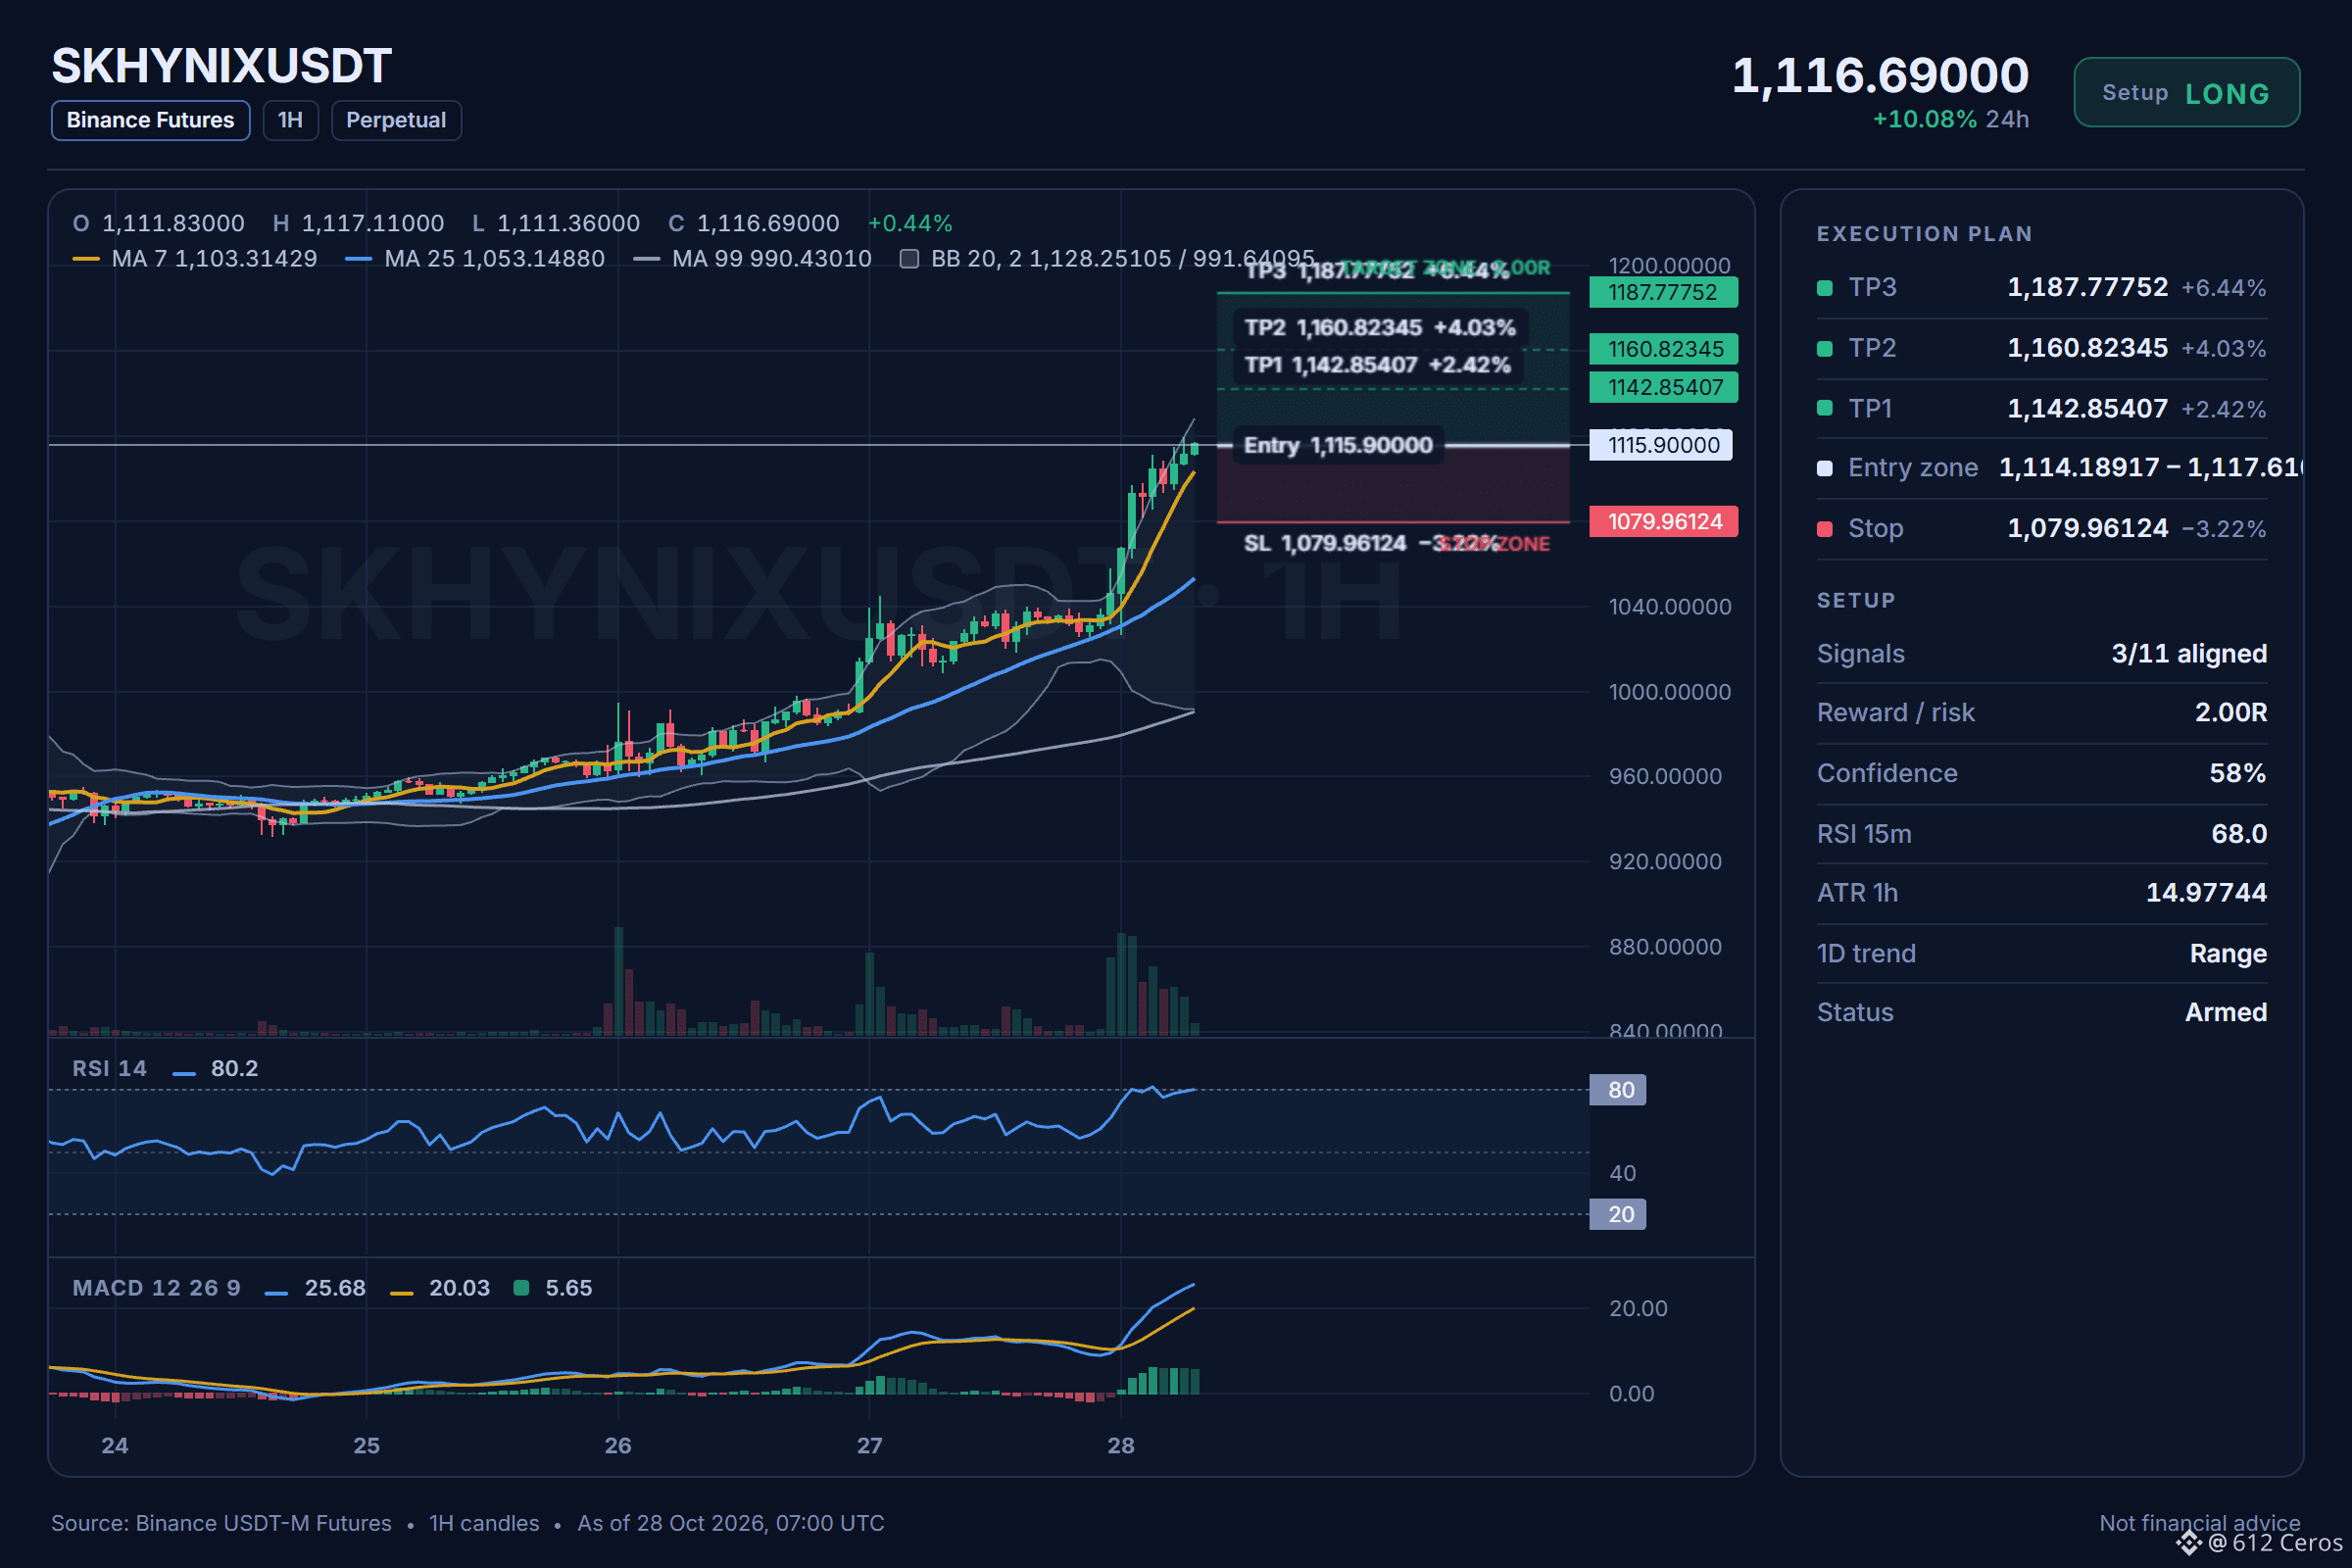
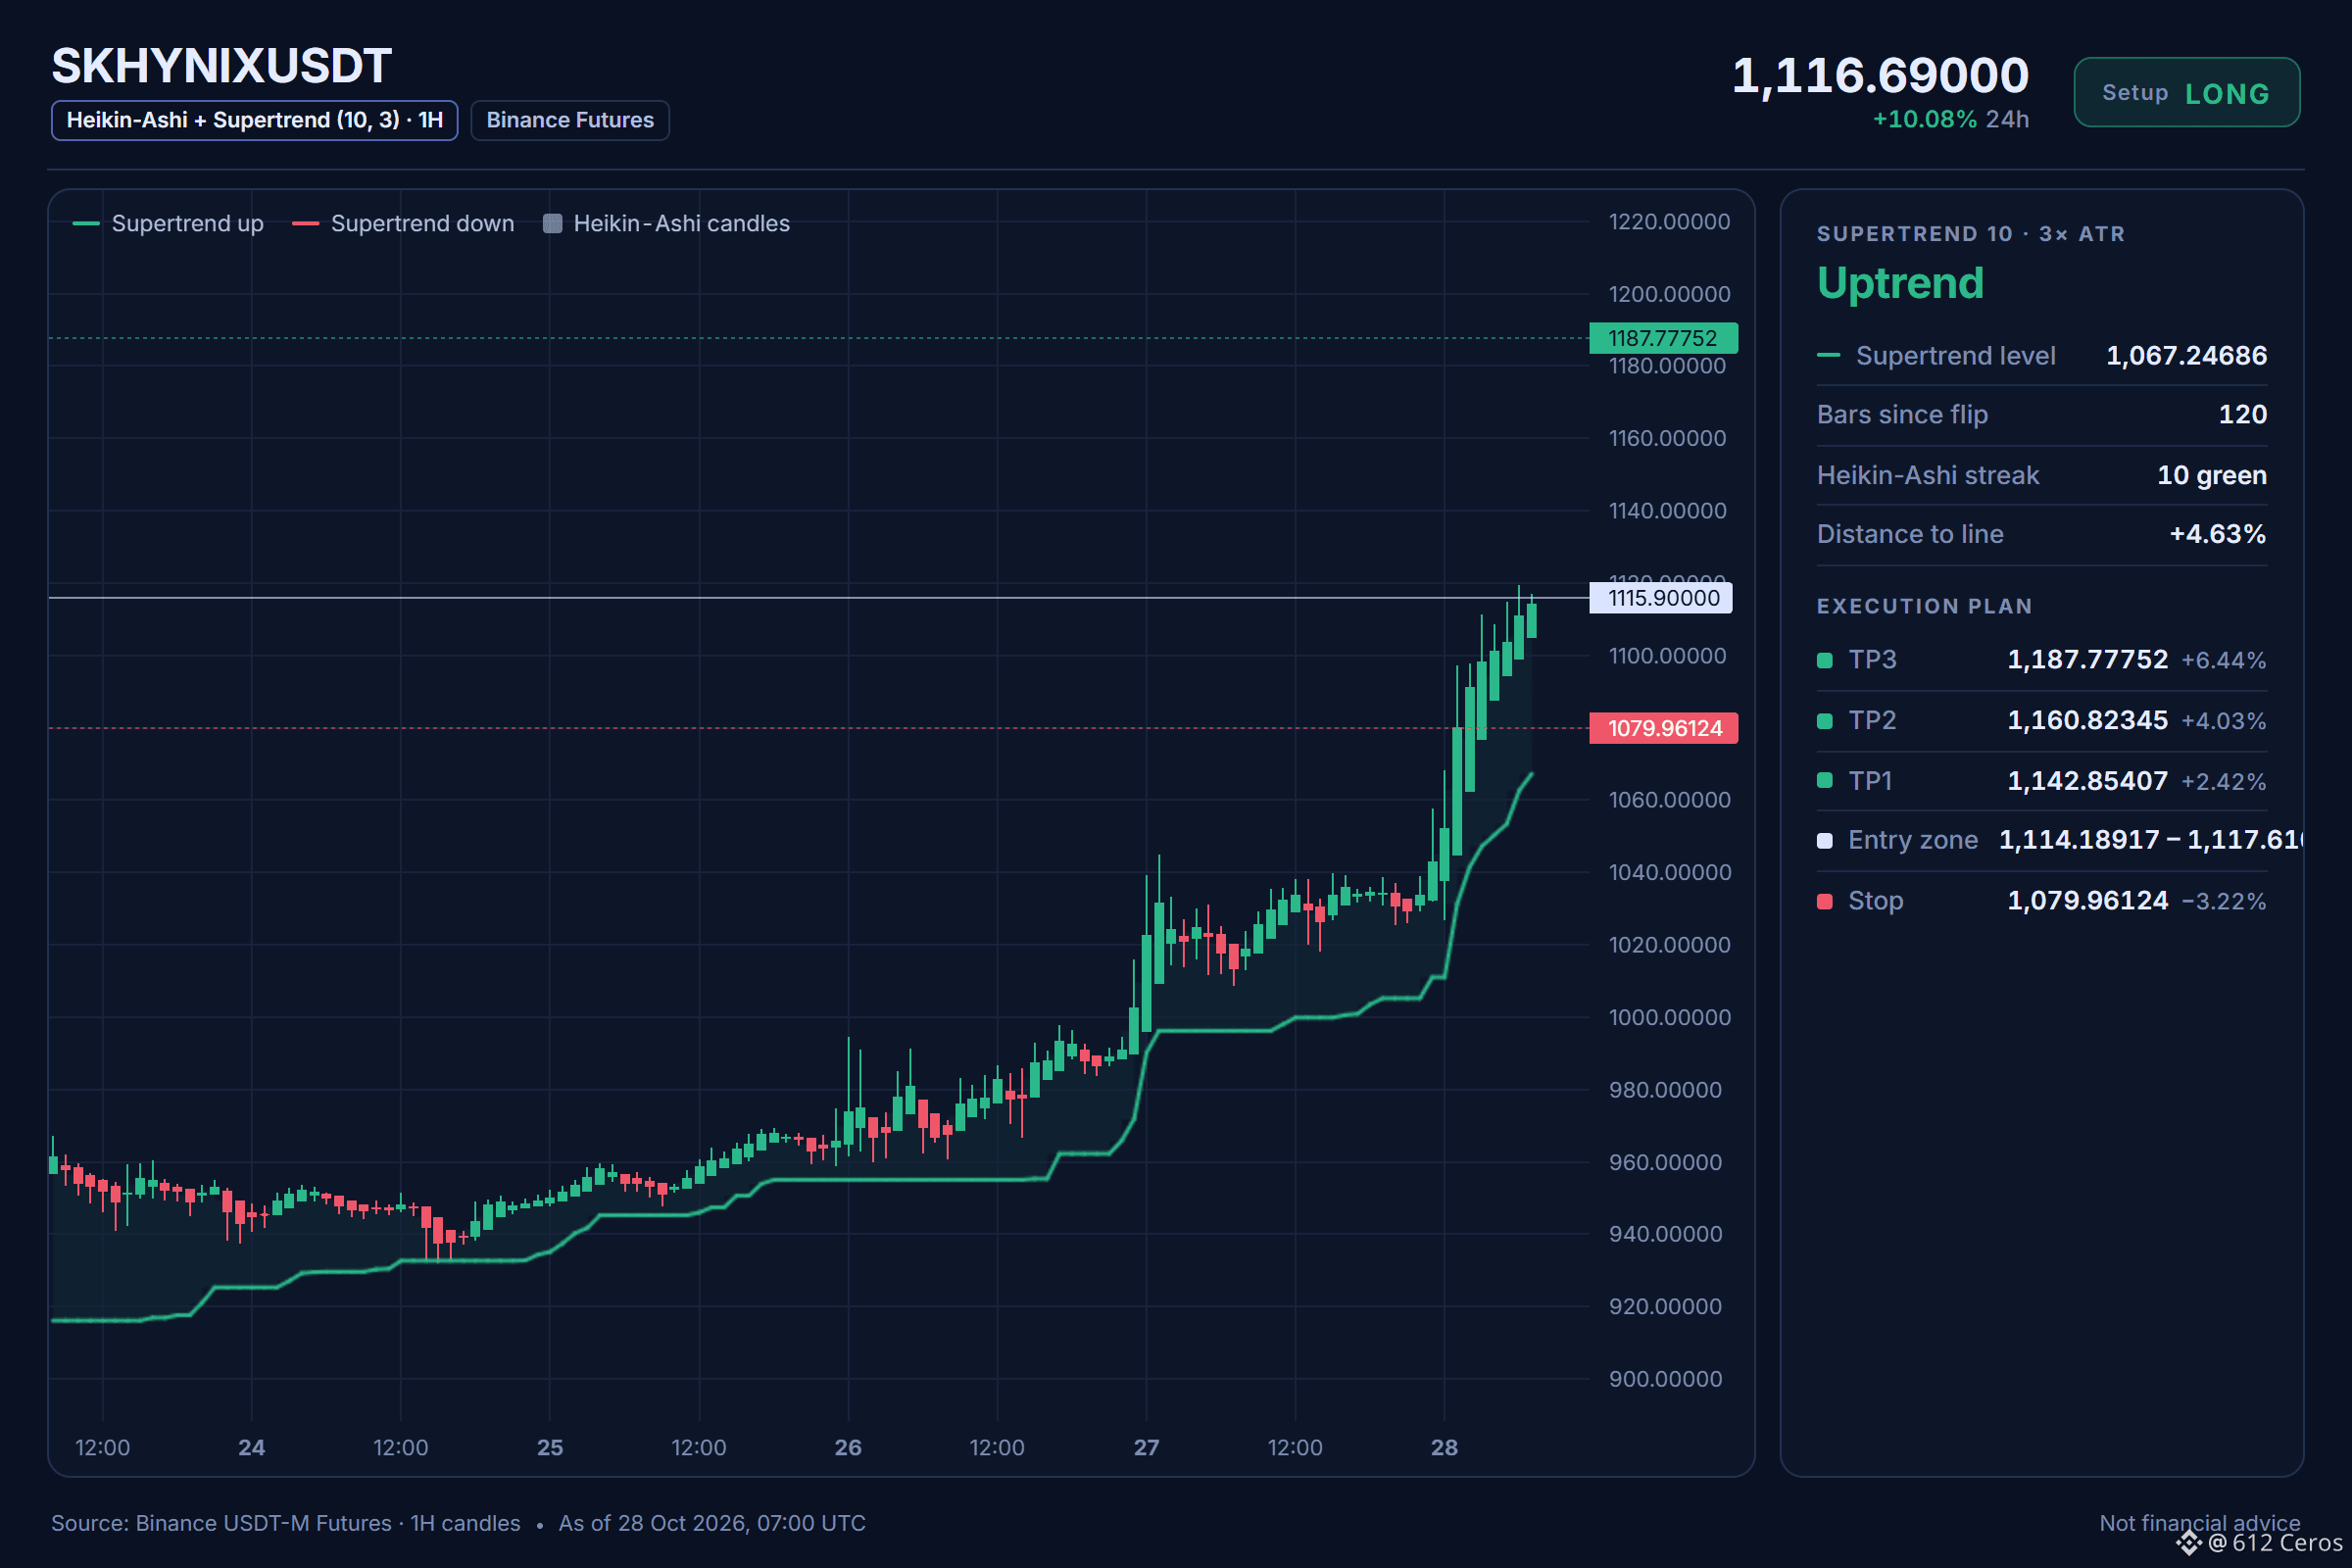
What if SKHYNIX keeps climbing after this 1h bounce?
🟢 LONG $SKHYNIX /USDT: expecting price to go UP
Bias: LONG · Leaning
Entry: 1114.18917 – 1117.61083
TP1: 1142.85407 (+2.4%)
TP2: 1160.82345 (+4.0%)
TP3: 1187.77752 (+6.4%)
SL: 1079.96124 (-3.2%)
Plan: enter only inside the zone, close 50% at TP1, 25% at TP2, 25% at TP3, and move the stop to entry after TP1.
Note: moderate conviction only, keep size light.
Why LONG? 3/11 signals agree, 1 against.
• 1h trend up (above EMA50 & EMA200)
• Buyers are driving the move (15m ADX 44.1)
• Stronger than BTC (+7.96% 24h vs BTC)
Risk: Price ran hot, pullbacks are common from here (4h RSI 83.0, overbought)
Bull path:
If the short-term trend holds, the 1h price could push toward the first target while the bullish stack stays intact.
What kills it:
If the 1h price drops below the entry invalidation level, the setup fails and I would exit immediately.
Where would you place your invalidation on this level?
Chart with every level below.
{future}(SKHYNIXUSDT)
📲 Want more of my latest signals? Join me here:
[https://app.binance.com/uni-qr/D26WbL9t](https://app.binance.com/uni-qr/D26WbL9t)
⚠️ Personal market analysis only. NFA — manage risk and DYOR.
Educational content, not investment advice or a recommendation to buy, sell, deposit, or withdraw any asset. No paid promotion or referral/affiliate links.
What if SKHYNIX keeps climbing after this 1h bounce?
🟢 LONG $SKHYNIX /USDT: expecting price to go UP
Bias: LONG · Leaning
Entry: 1114.18917 – 1117.61083
TP1: 1142.85407 (+2.4%)
TP2: 1160.82345 (+4.0%)
TP3: 1187.77752 (+6.4%)
SL: 1079.96124 (-3.2%)
Plan: enter only inside the zone, close 50% at TP1, 25% at TP2, 25% at TP3, and move the stop to entry after TP1.
Note: moderate conviction only, keep size light.
Why LONG? 3/11 signals agree, 1 against.
• 1h trend up (above EMA50 & EMA200)
• Buyers are driving the move (15m ADX 44.1)
• Stronger than BTC (+7.96% 24h vs BTC)
Risk: Price ran hot, pullbacks are common from here (4h RSI 83.0, overbought)
Bull path:
If the short-term trend holds, the 1h price could push toward the first target while the bullish stack stays intact.
What kills it:
If the 1h price drops below the entry invalidation level, the setup fails and I would exit immediately.
Where would you place your invalidation on this level?
Chart with every level below.
📲 Want more of my latest signals? Join me here:
https://app.binance.com/uni-qr/D26WbL9t
⚠️ Personal market analysis only. NFA — manage risk and DYOR.
Educational content, not investment advice or a recommendation to buy, sell, deposit, or withdraw any asset. No paid promotion or referral/affiliate links.
611
·
--
Haussier
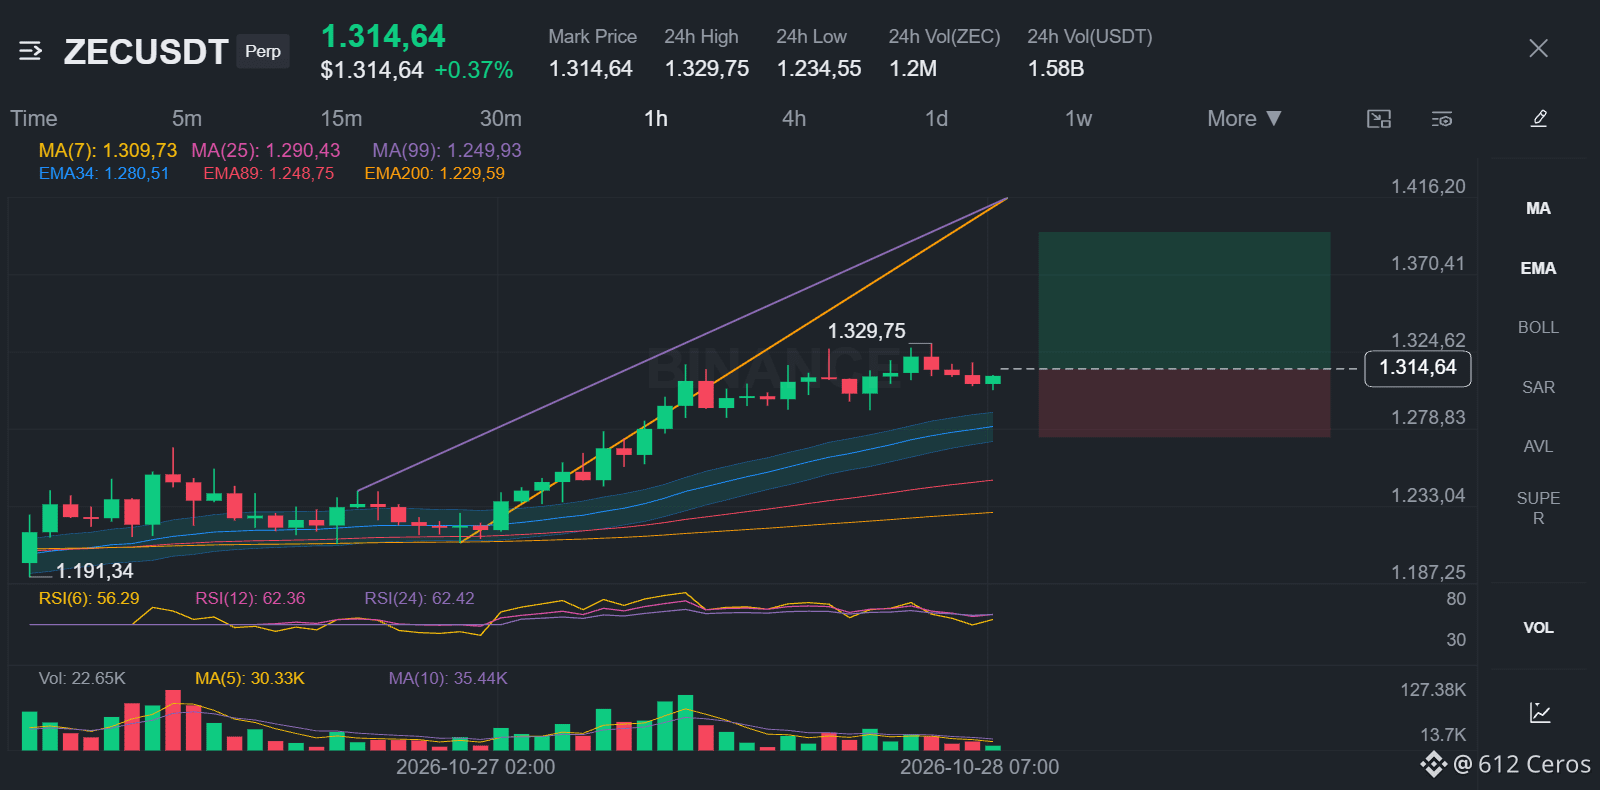
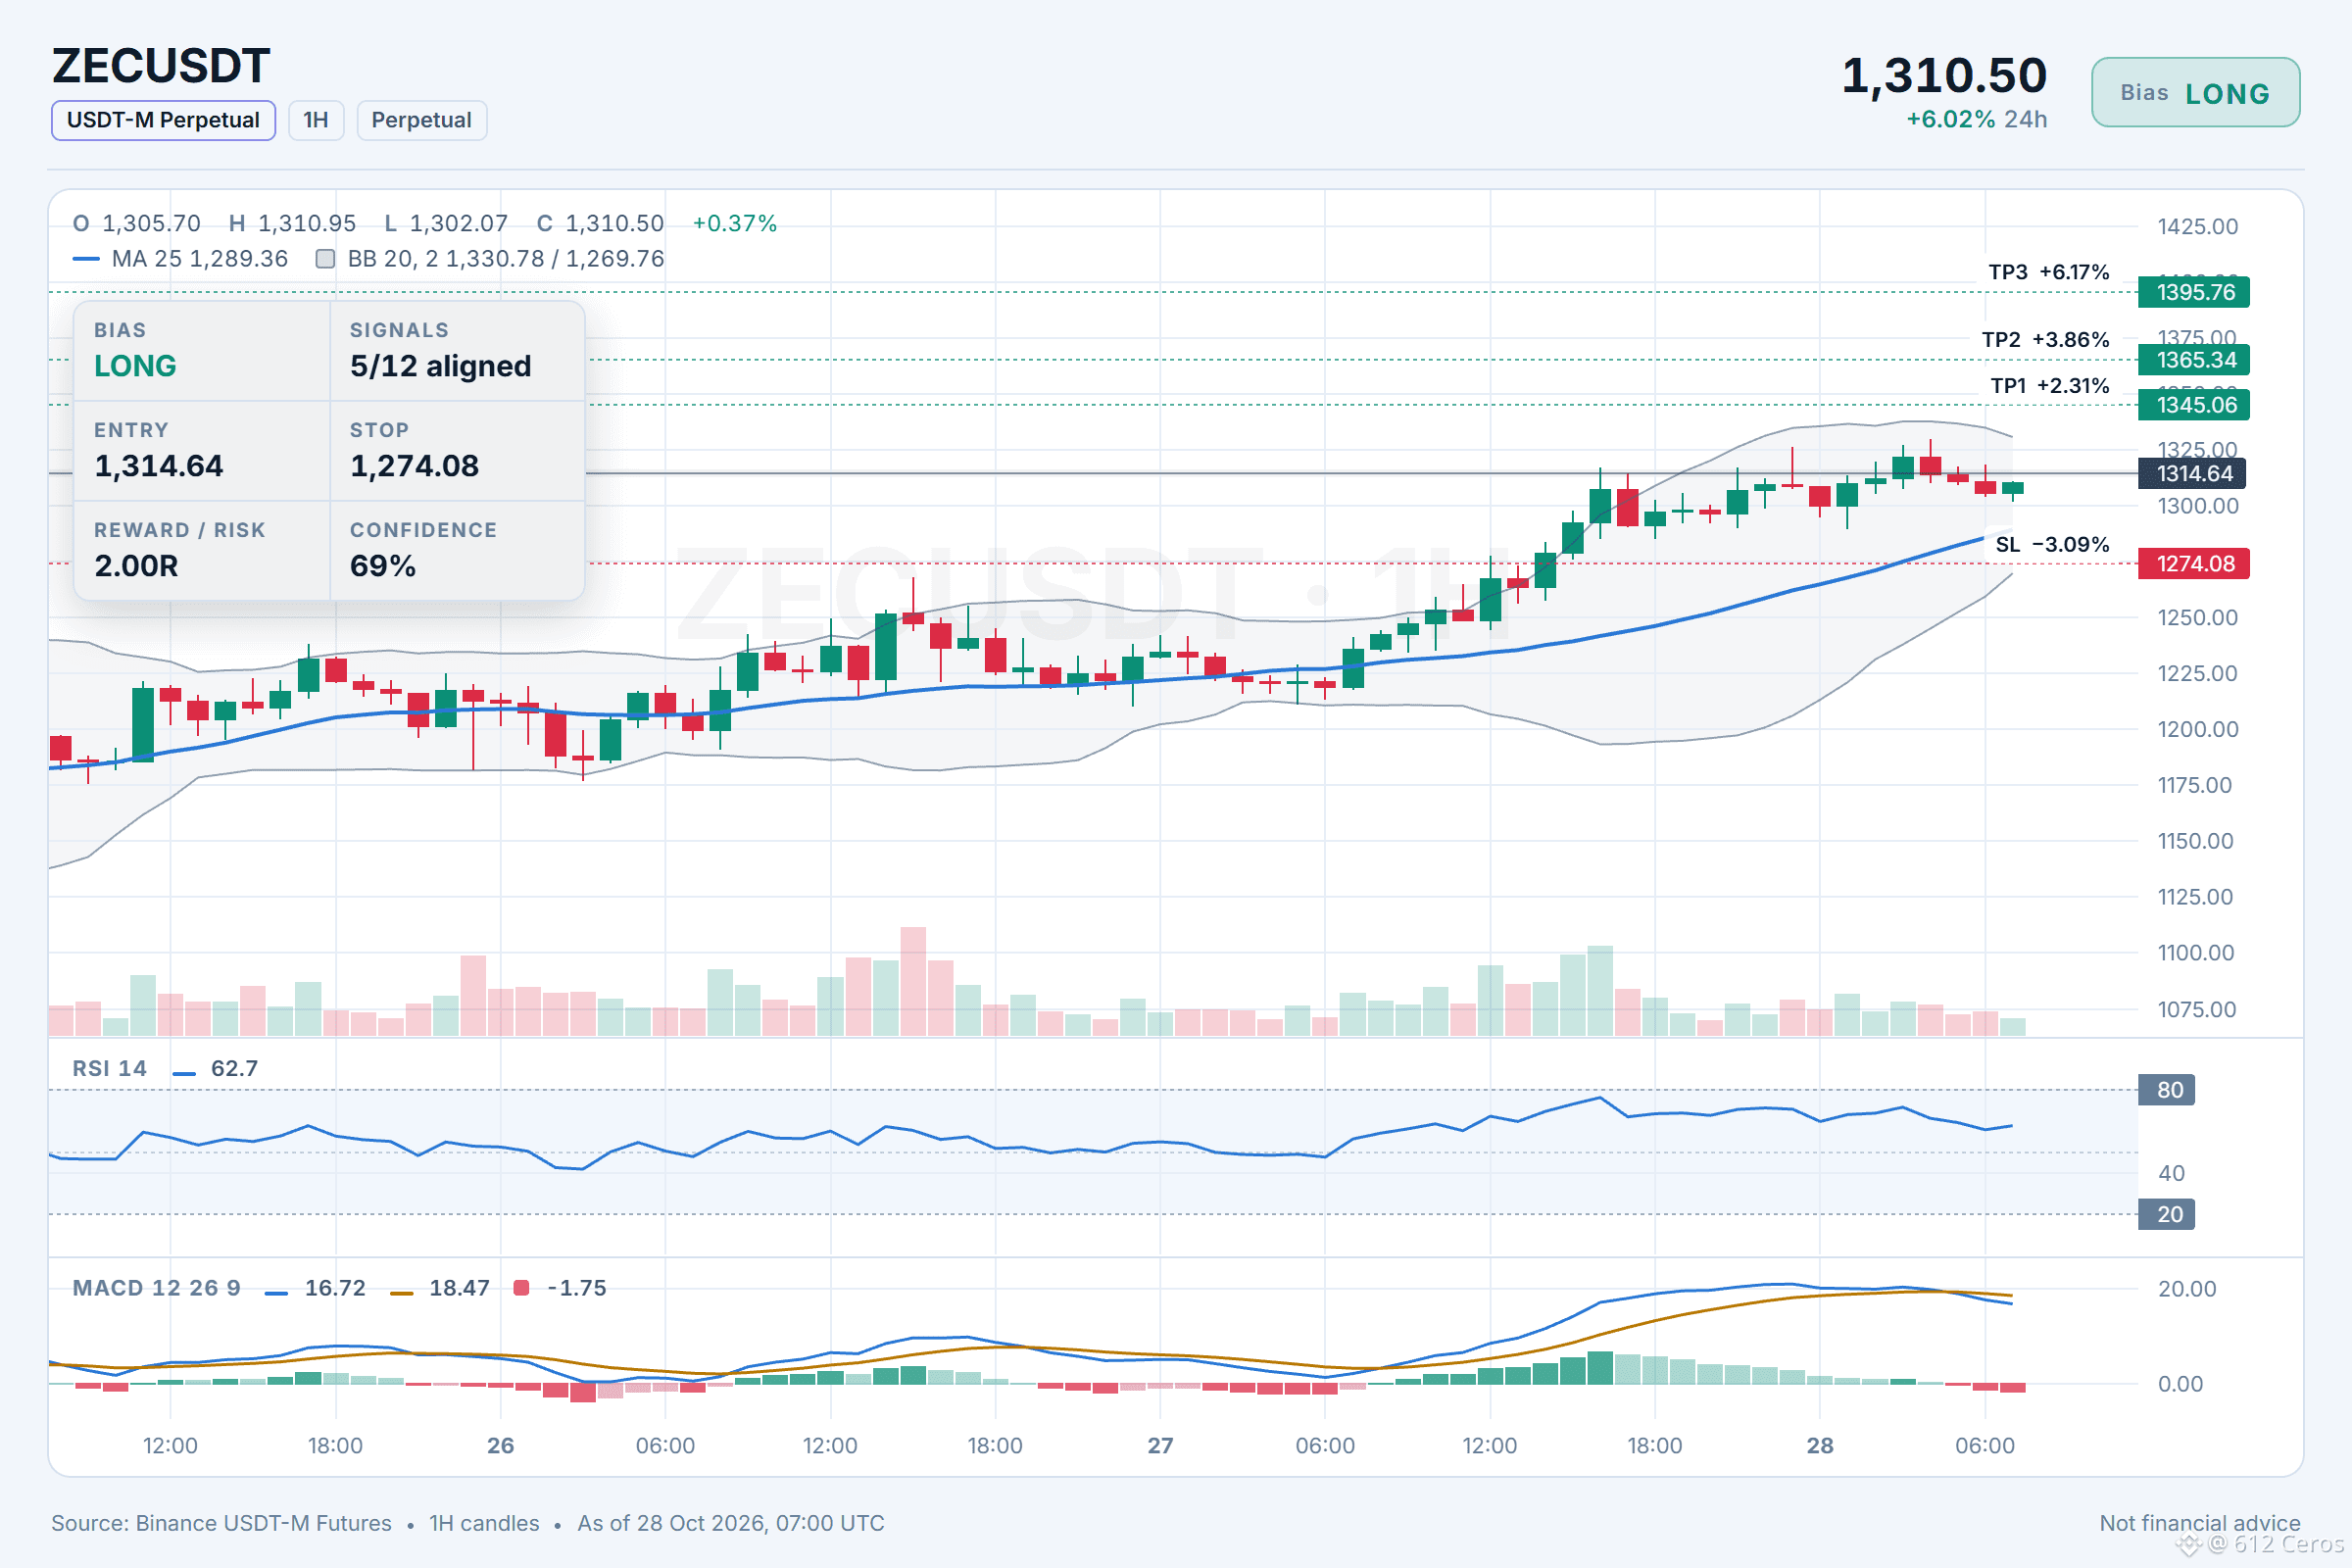
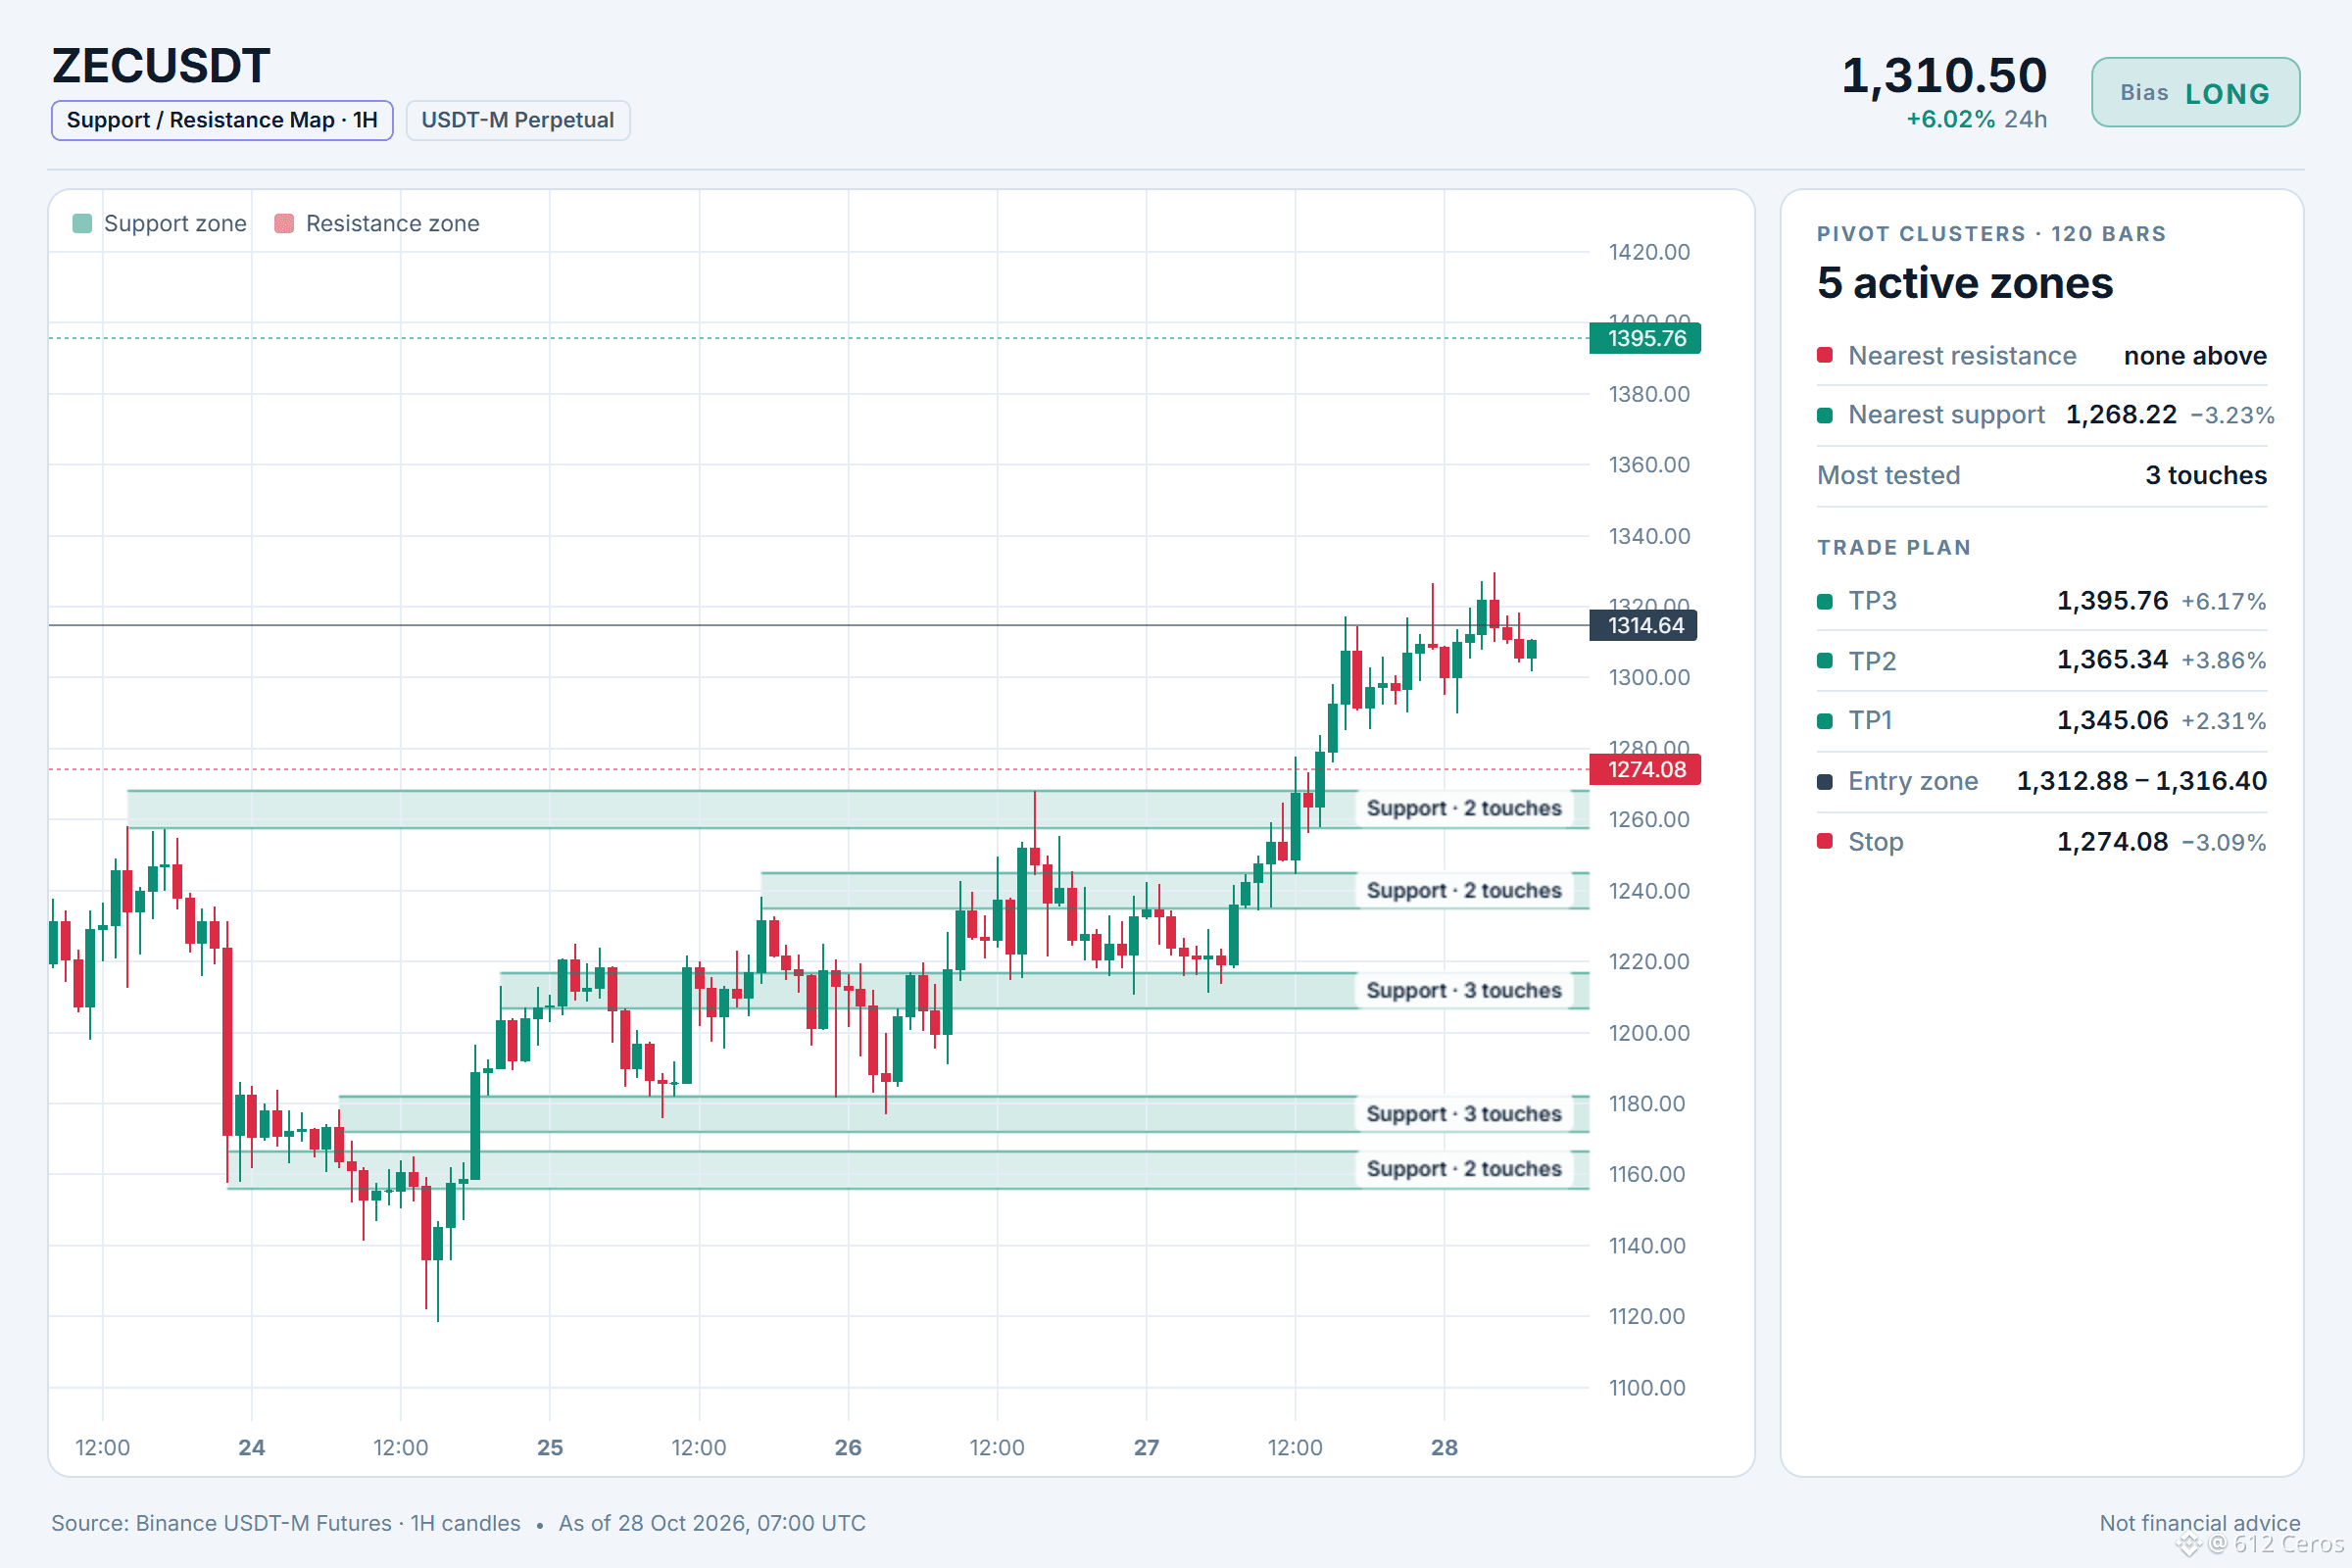
The daily trend flipped bullish after a quiet consolidation.
🟢 LONG $ZEC /USDT: expecting price to go UP
Bias: LONG · Leaning
Entry: 1312.88 – 1316.40
TP1: 1345.06 (+2.3%)
TP2: 1365.34 (+3.9%)
TP3: 1395.76 (+6.2%)
SL: 1274.08 (-3.1%)
Plan: enter only inside the zone, close 50% at TP1, 25% at TP2, 25% at TP3, and move the stop to entry after TP1.
Note: moderate conviction only, keep size light.
Why LONG? 5/12 signals agree, 0 against.
• Daily trend up (above EMA50 & EMA200)
• 1h trend up (above EMA50 & EMA200)
• Buyers have the momentum (4h RSI 65.7)
The short version:
1/3 The daily trend is bullish with the price above the stacked moving averages.
2/3 The 1h momentum is bullish, RSI is above 55 and buyers are in control.
3/3 A close below the entry invalidates the setup because it signals a short-term reversal.
Where would you place your invalidation level for this long?
Full setup on the chart below.
{future}(ZECUSDT)
📲 Want more of my latest signals? Join me here:
[https://app.binance.com/uni-qr/D26WbL9t](https://app.binance.com/uni-qr/D26WbL9t)
⚠️ Personal market analysis only. NFA — manage risk and DYOR.
Educational content, not investment advice or a recommendation to buy, sell, deposit, or withdraw any asset. No paid promotion or referral/affiliate links.
The daily trend flipped bullish after a quiet consolidation.
🟢 LONG $ZEC /USDT: expecting price to go UP
Bias: LONG · Leaning
Entry: 1312.88 – 1316.40
TP1: 1345.06 (+2.3%)
TP2: 1365.34 (+3.9%)
TP3: 1395.76 (+6.2%)
SL: 1274.08 (-3.1%)
Plan: enter only inside the zone, close 50% at TP1, 25% at TP2, 25% at TP3, and move the stop to entry after TP1.
Note: moderate conviction only, keep size light.
Why LONG? 5/12 signals agree, 0 against.
• Daily trend up (above EMA50 & EMA200)
• 1h trend up (above EMA50 & EMA200)
• Buyers have the momentum (4h RSI 65.7)
The short version:
1/3 The daily trend is bullish with the price above the stacked moving averages.
2/3 The 1h momentum is bullish, RSI is above 55 and buyers are in control.
3/3 A close below the entry invalidates the setup because it signals a short-term reversal.
Where would you place your invalidation level for this long?
Full setup on the chart below.
📲 Want more of my latest signals? Join me here:
https://app.binance.com/uni-qr/D26WbL9t
⚠️ Personal market analysis only. NFA — manage risk and DYOR.
Educational content, not investment advice or a recommendation to buy, sell, deposit, or withdraw any asset. No paid promotion or referral/affiliate links.
2
1.5k
·
--
Baissier
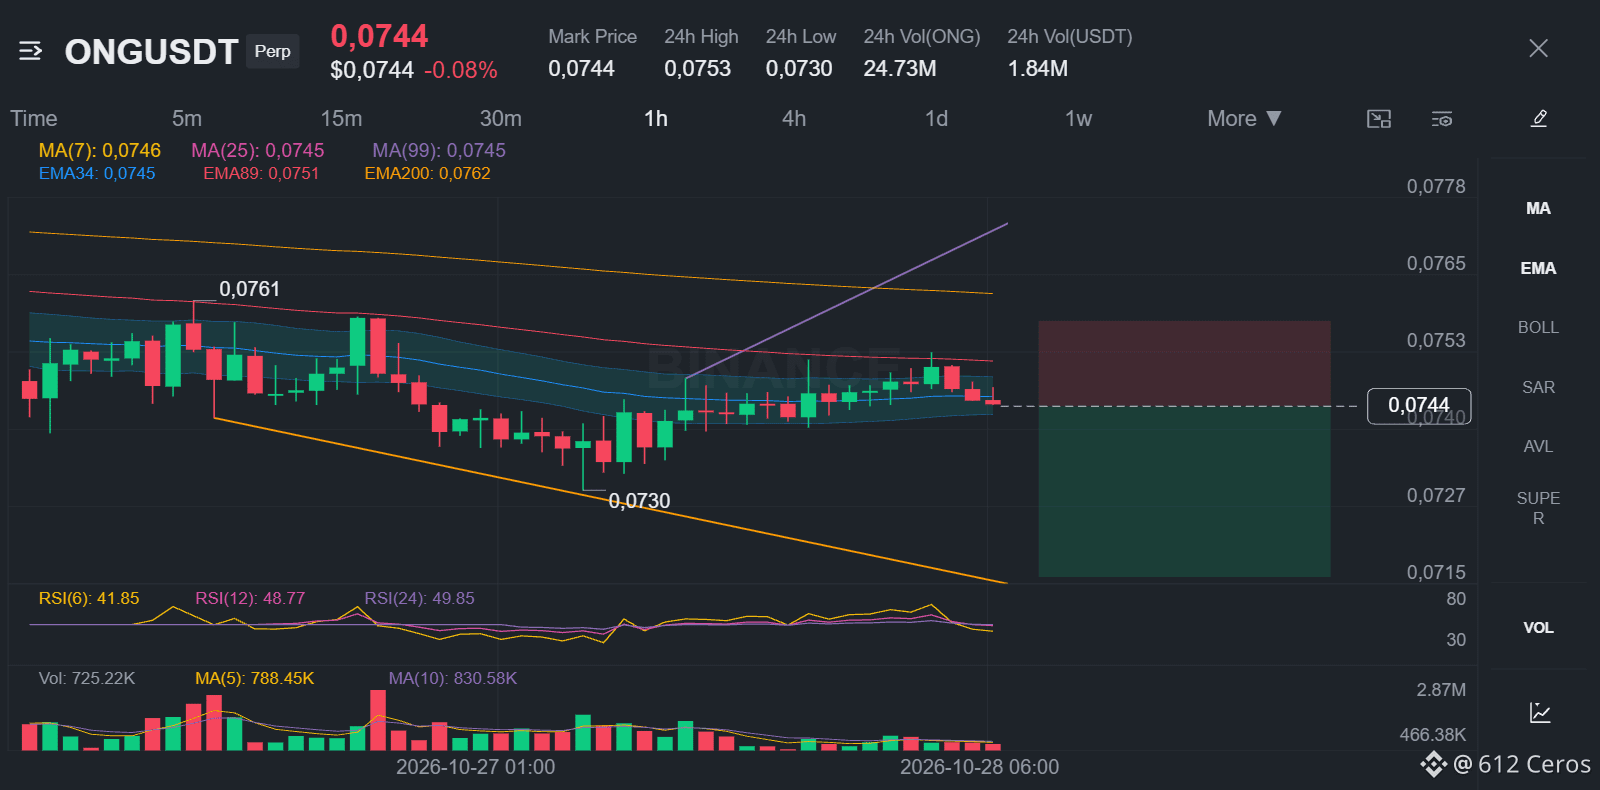
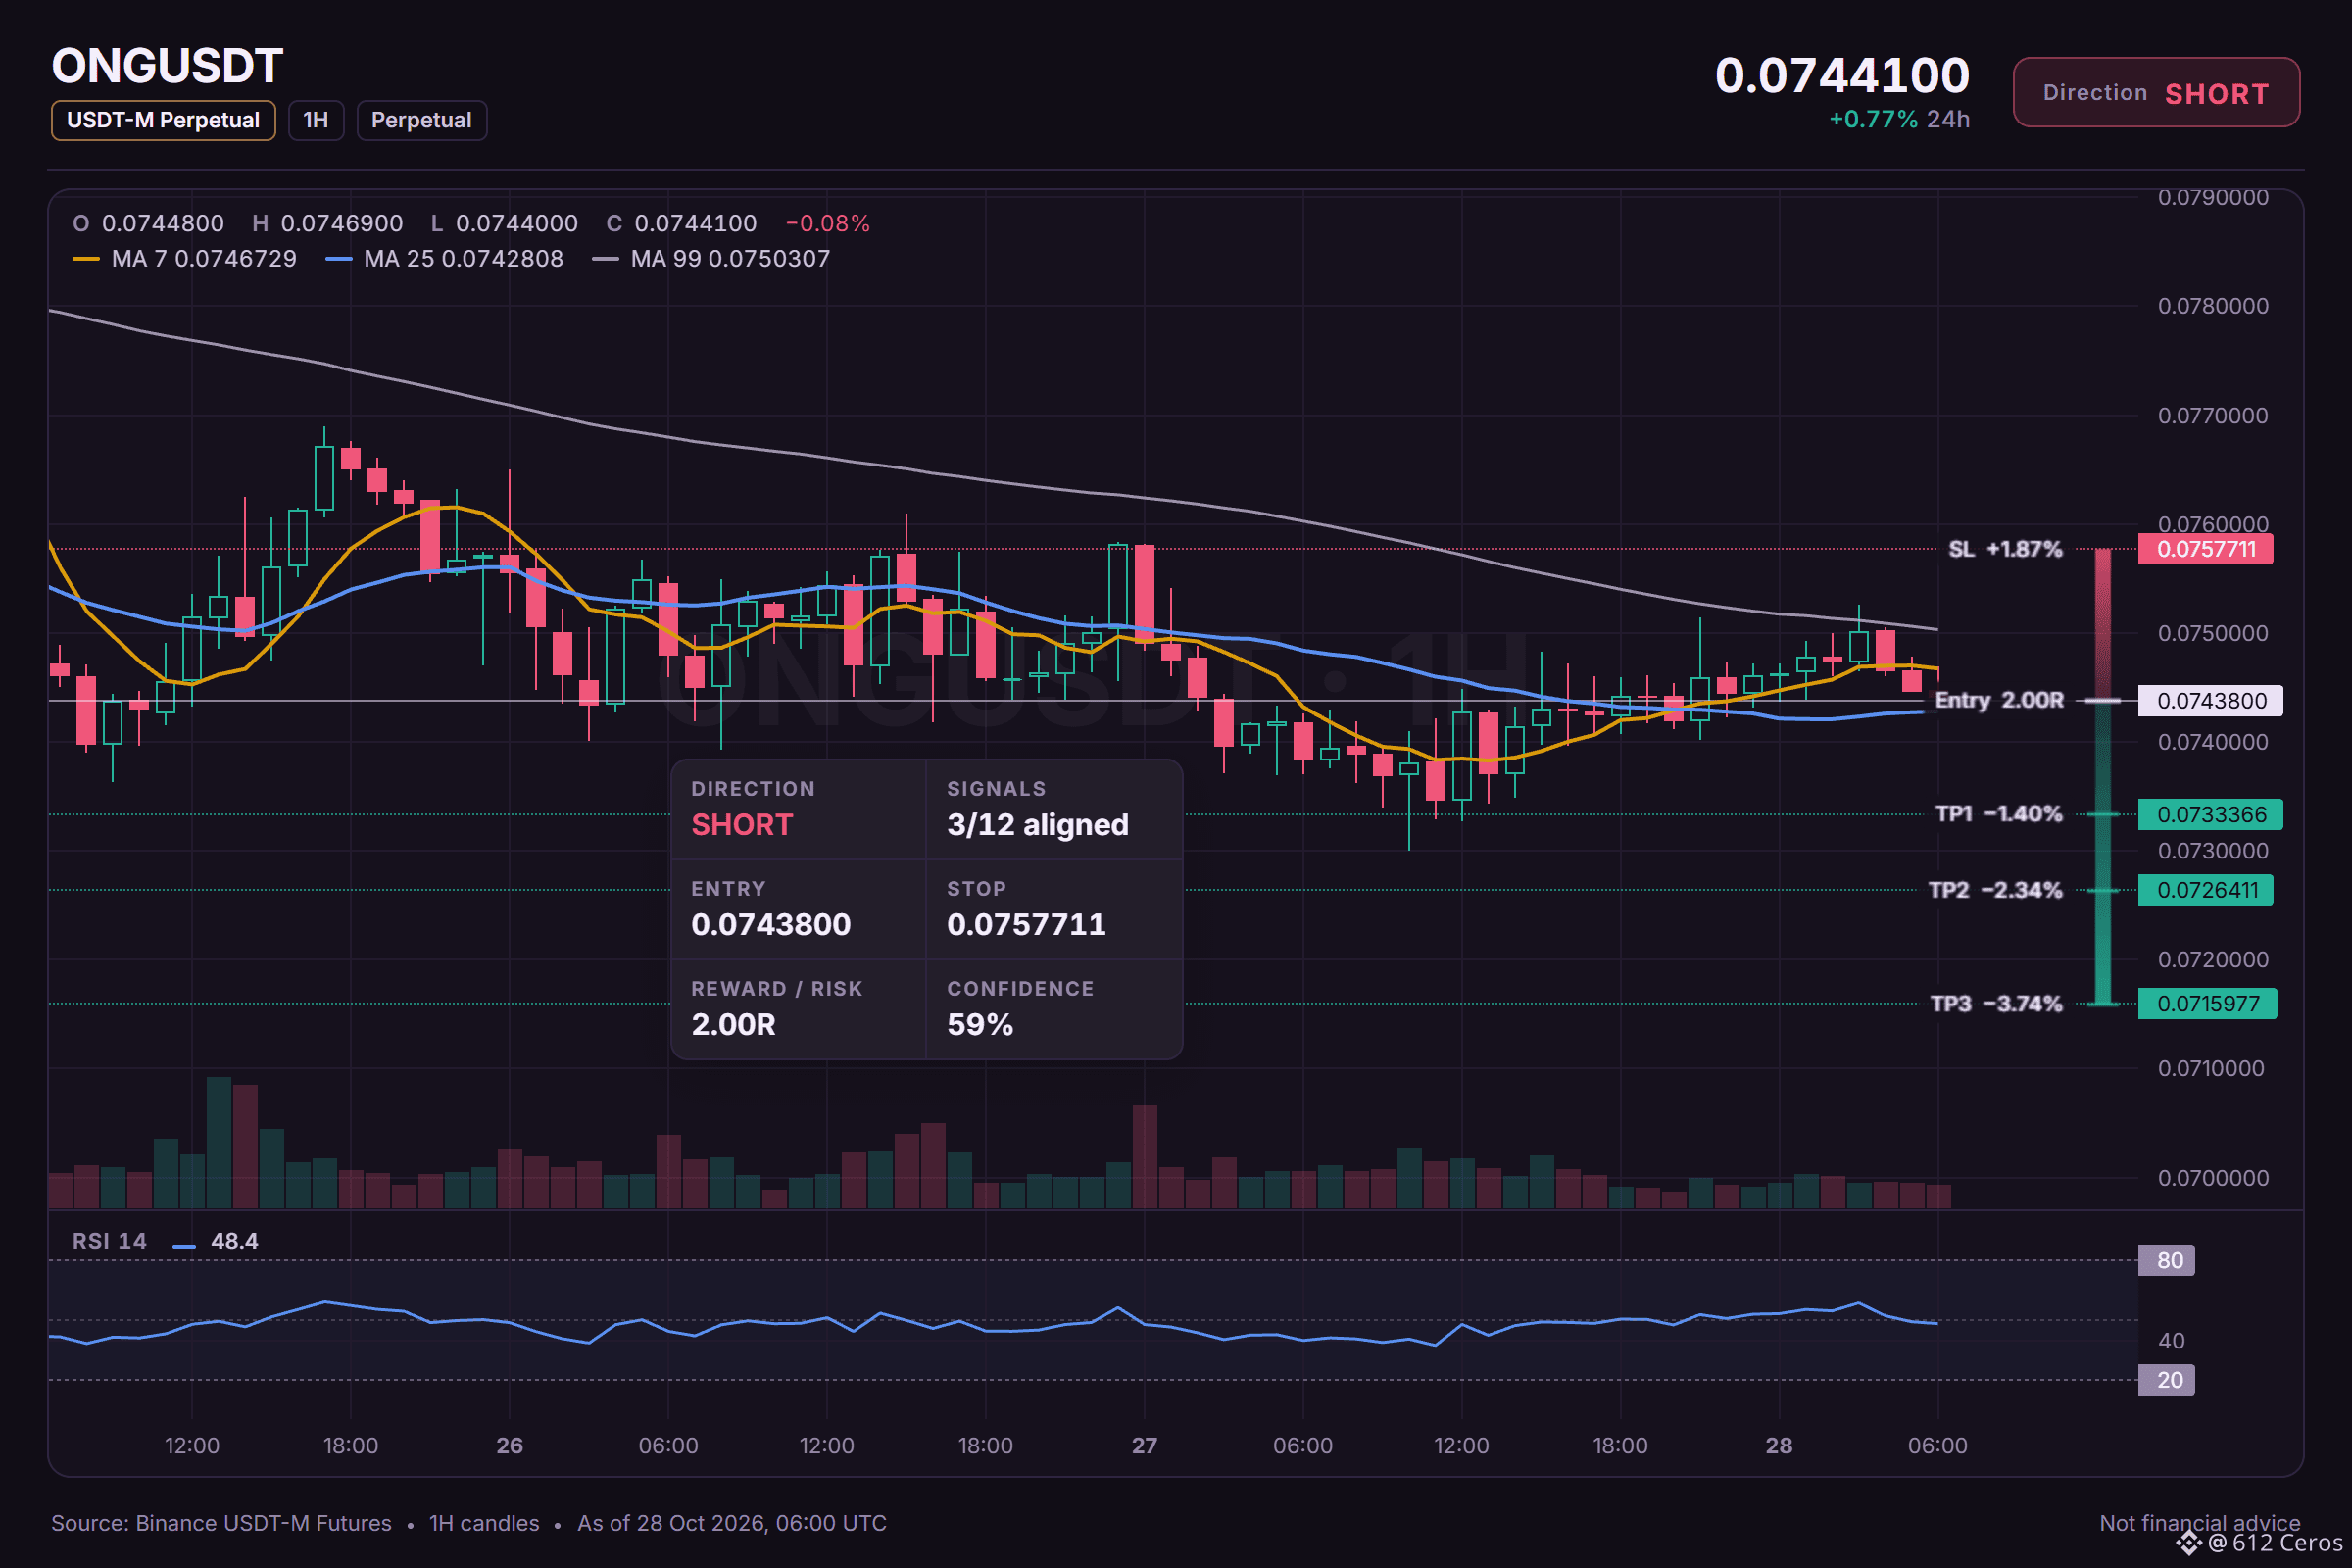
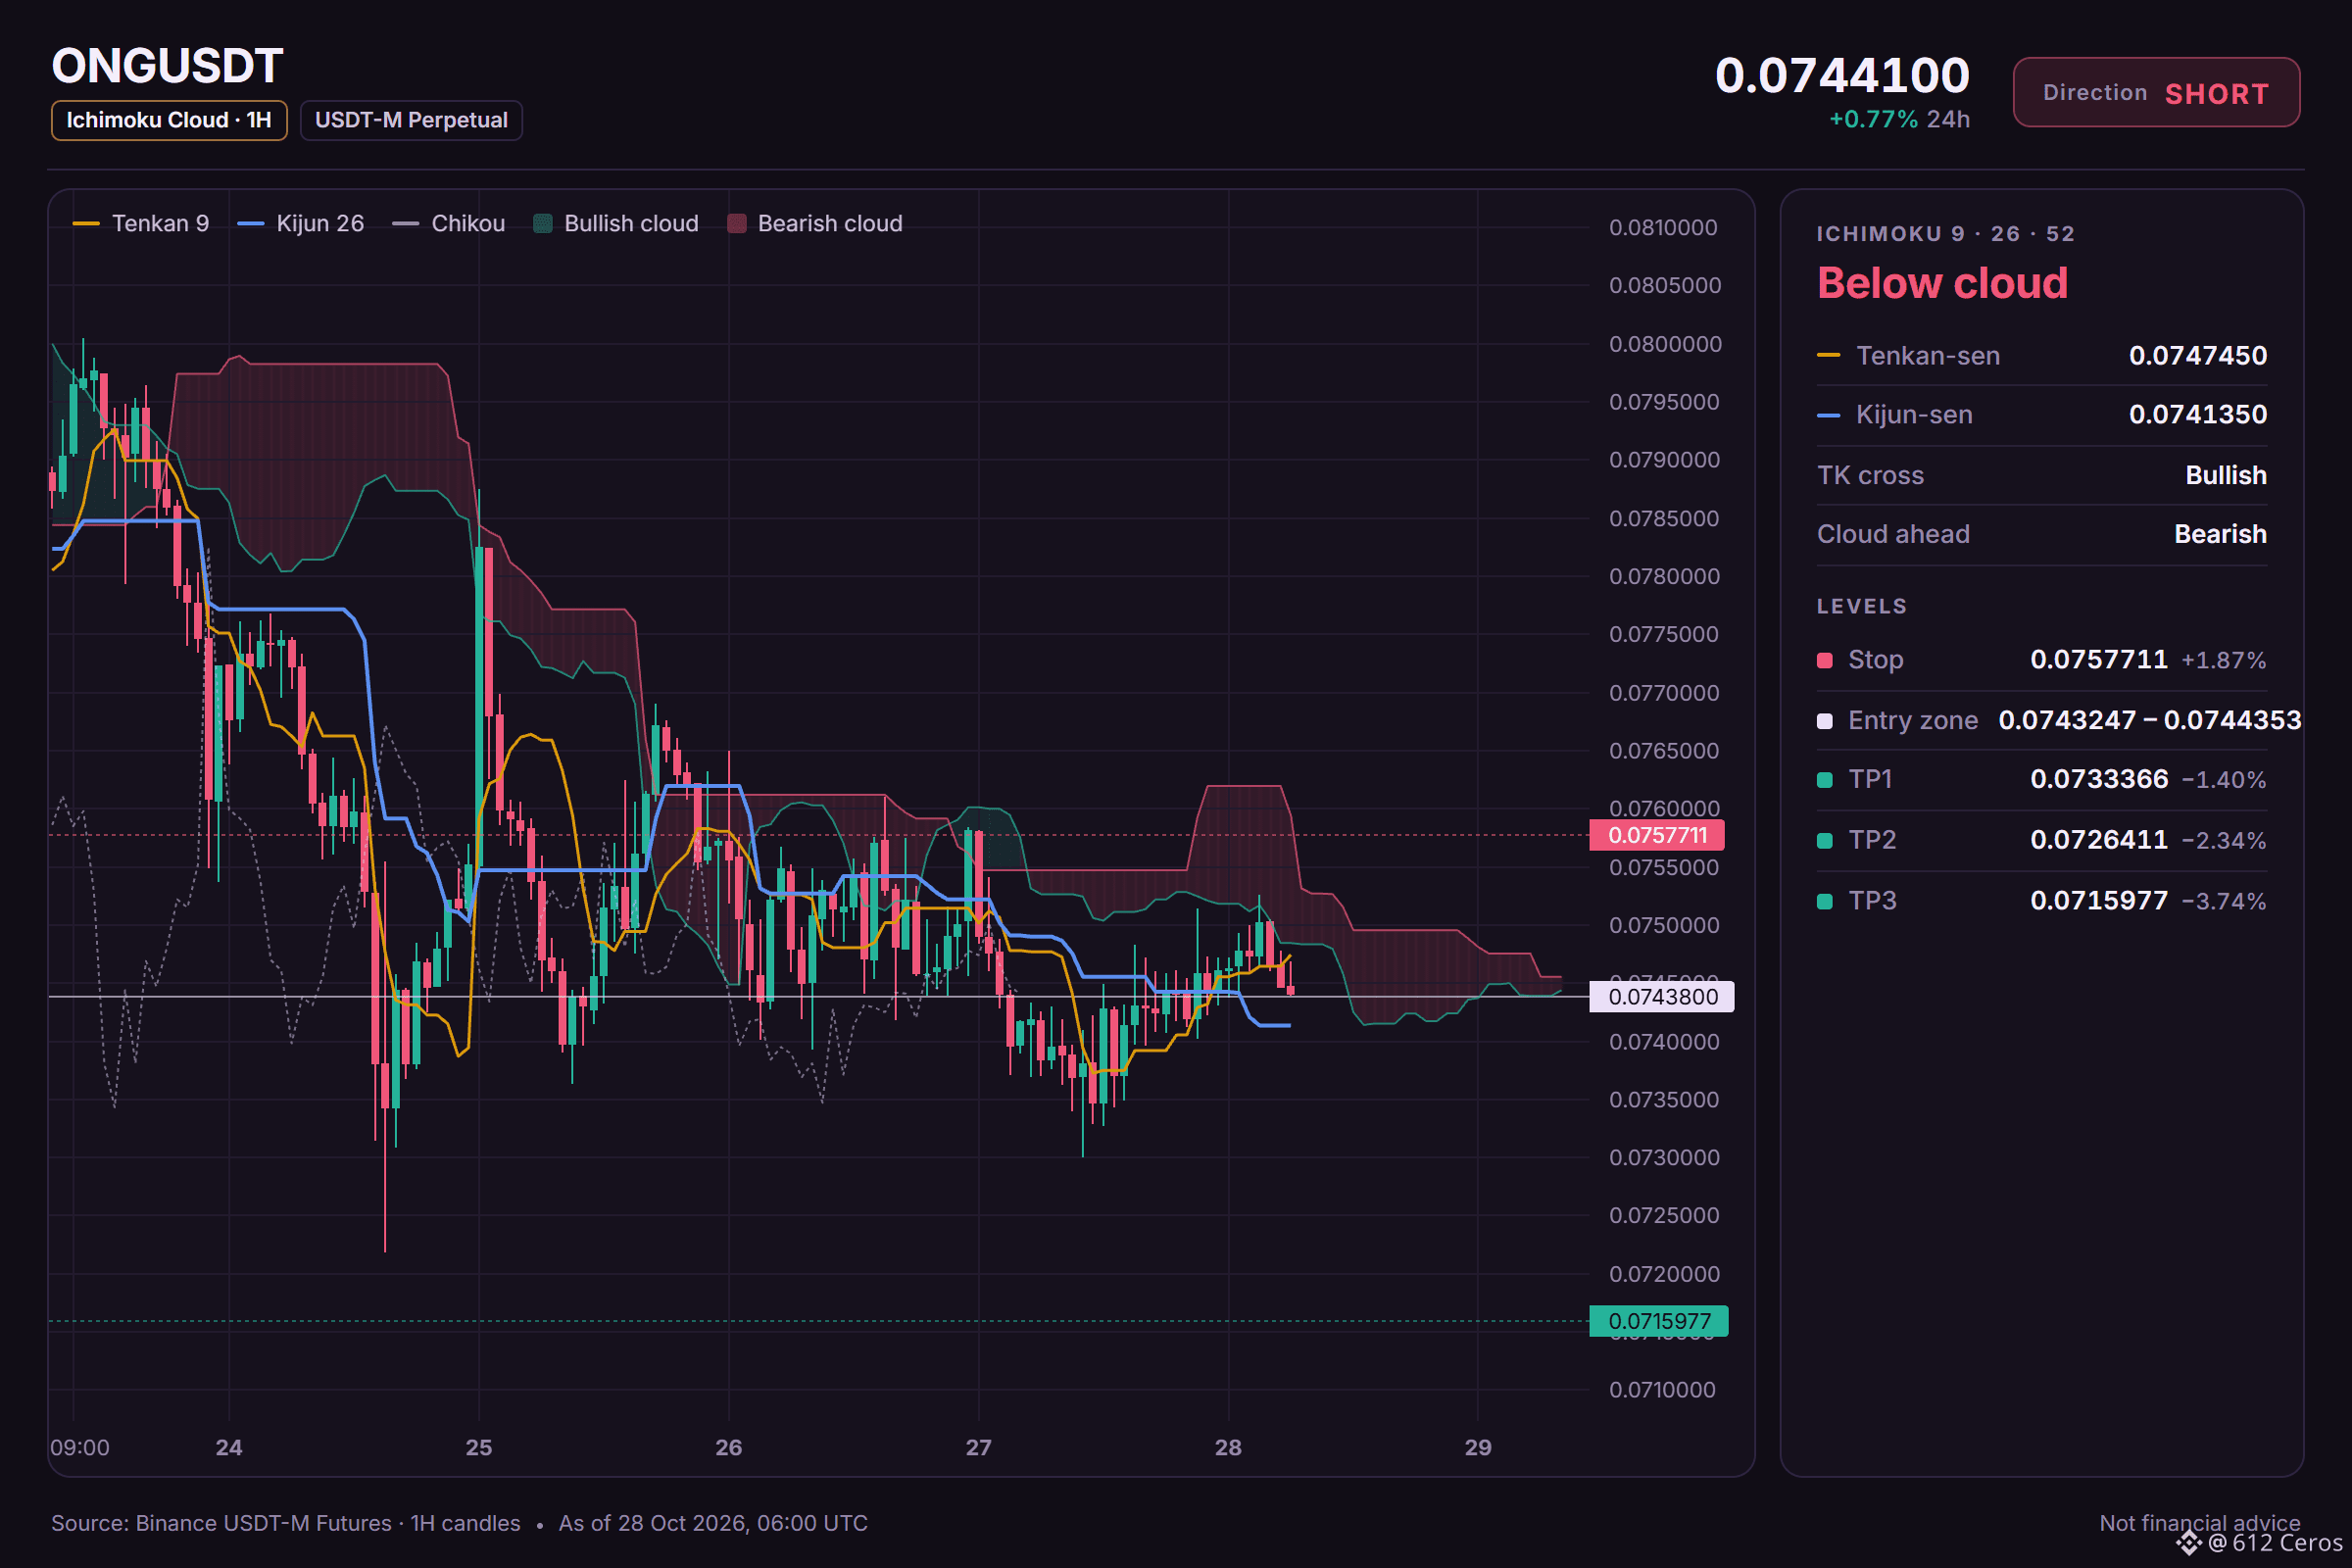
ONG is pressing lower inside a bearish stack
🔴 SHORT $ONG /USDT: expecting price to go DOWN
Bias: SHORT · Leaning
Entry: 0.0743247 – 0.0744353
TP1: 0.0733366 (-1.4%)
TP2: 0.0726411 (-2.3%)
TP3: 0.0715977 (-3.7%)
SL: 0.0757711 (+1.9%)
Plan: enter only inside the zone, close 50% at TP1, 25% at TP2, 25% at TP3, and move the stop to entry after TP1.
Note: moderate conviction only, keep size light.
Why SHORT? ONG checklist: 3/12 agree, 1 against.
• 4h trend down (below EMA50 & EMA200)
• 1h trend down (below EMA50 & EMA200)
• Sellers are pushing right now (−0.24% 15m candle)
Watch: Range bottom, buyers often step in (RSI z −2.08)
Watch: The idea is wrong if price reaches the stop at 0.0757711
Net read: The 4h trend is down, but the daily trend is range, so conviction stays moderate.
Where do you set your stop for this short?
Levels mapped on the chart below.
{future}(ONGUSDT)
📲 Want more of my latest signals? Join me here:
[https://app.binance.com/uni-qr/D26WbL9t](https://app.binance.com/uni-qr/D26WbL9t)
⚠️ Personal market analysis only. NFA — manage risk and DYOR.
Educational content, not investment advice or a recommendation to buy, sell, deposit, or withdraw any asset. No paid promotion or referral/affiliate links.
ONG is pressing lower inside a bearish stack
🔴 SHORT $ONG /USDT: expecting price to go DOWN
Bias: SHORT · Leaning
Entry: 0.0743247 – 0.0744353
TP1: 0.0733366 (-1.4%)
TP2: 0.0726411 (-2.3%)
TP3: 0.0715977 (-3.7%)
SL: 0.0757711 (+1.9%)
Plan: enter only inside the zone, close 50% at TP1, 25% at TP2, 25% at TP3, and move the stop to entry after TP1.
Note: moderate conviction only, keep size light.
Why SHORT? ONG checklist: 3/12 agree, 1 against.
• 4h trend down (below EMA50 & EMA200)
• 1h trend down (below EMA50 & EMA200)
• Sellers are pushing right now (−0.24% 15m candle)
Watch: Range bottom, buyers often step in (RSI z −2.08)
Watch: The idea is wrong if price reaches the stop at 0.0757711
Net read: The 4h trend is down, but the daily trend is range, so conviction stays moderate.
Where do you set your stop for this short?
Levels mapped on the chart below.
📲 Want more of my latest signals? Join me here:
https://app.binance.com/uni-qr/D26WbL9t
⚠️ Personal market analysis only. NFA — manage risk and DYOR.
Educational content, not investment advice or a recommendation to buy, sell, deposit, or withdraw any asset. No paid promotion or referral/affiliate links.
555
·
--
Baissier
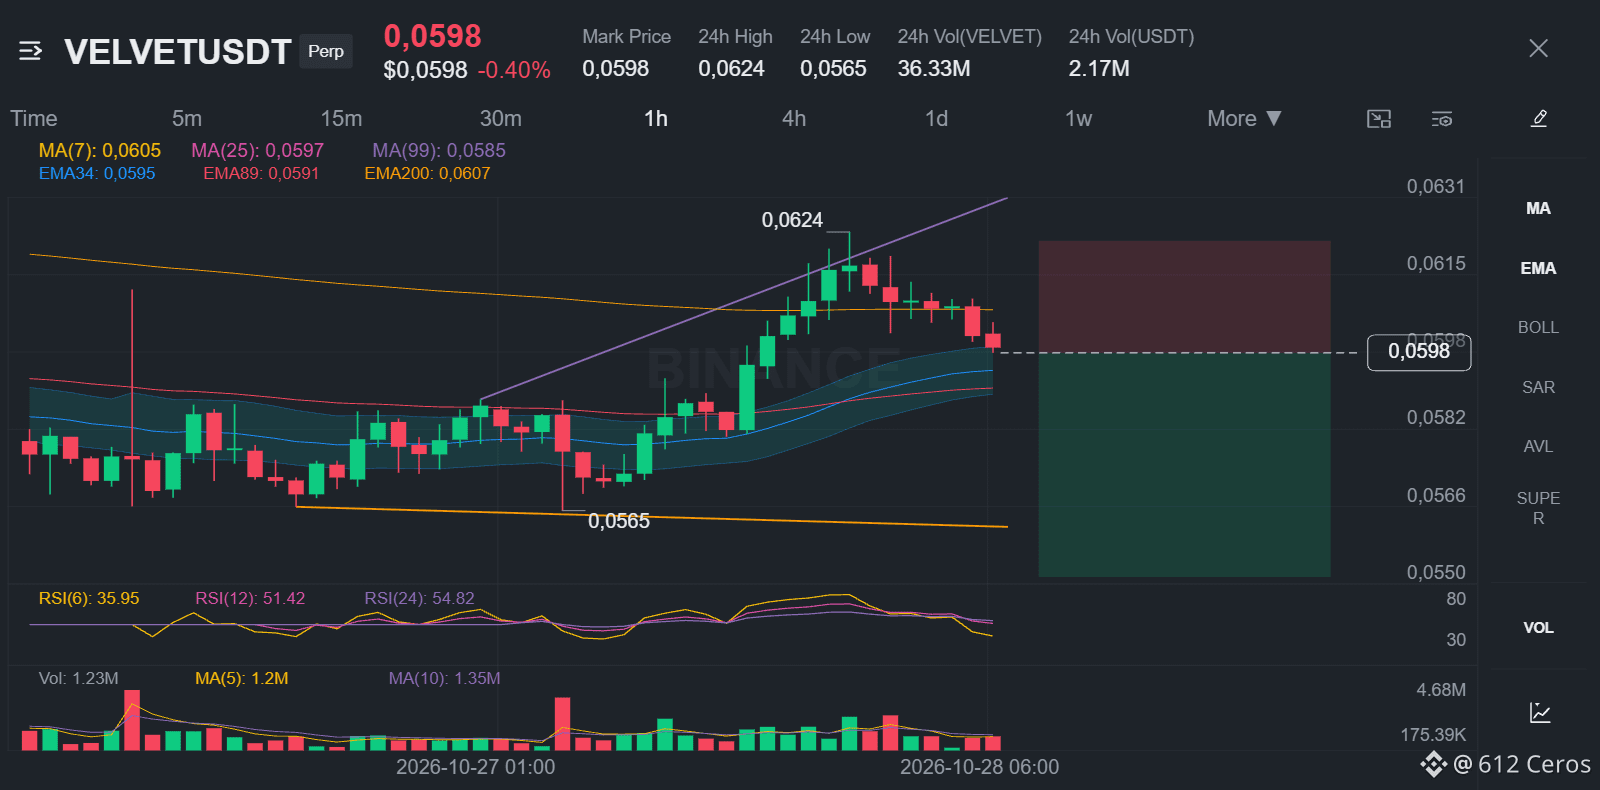
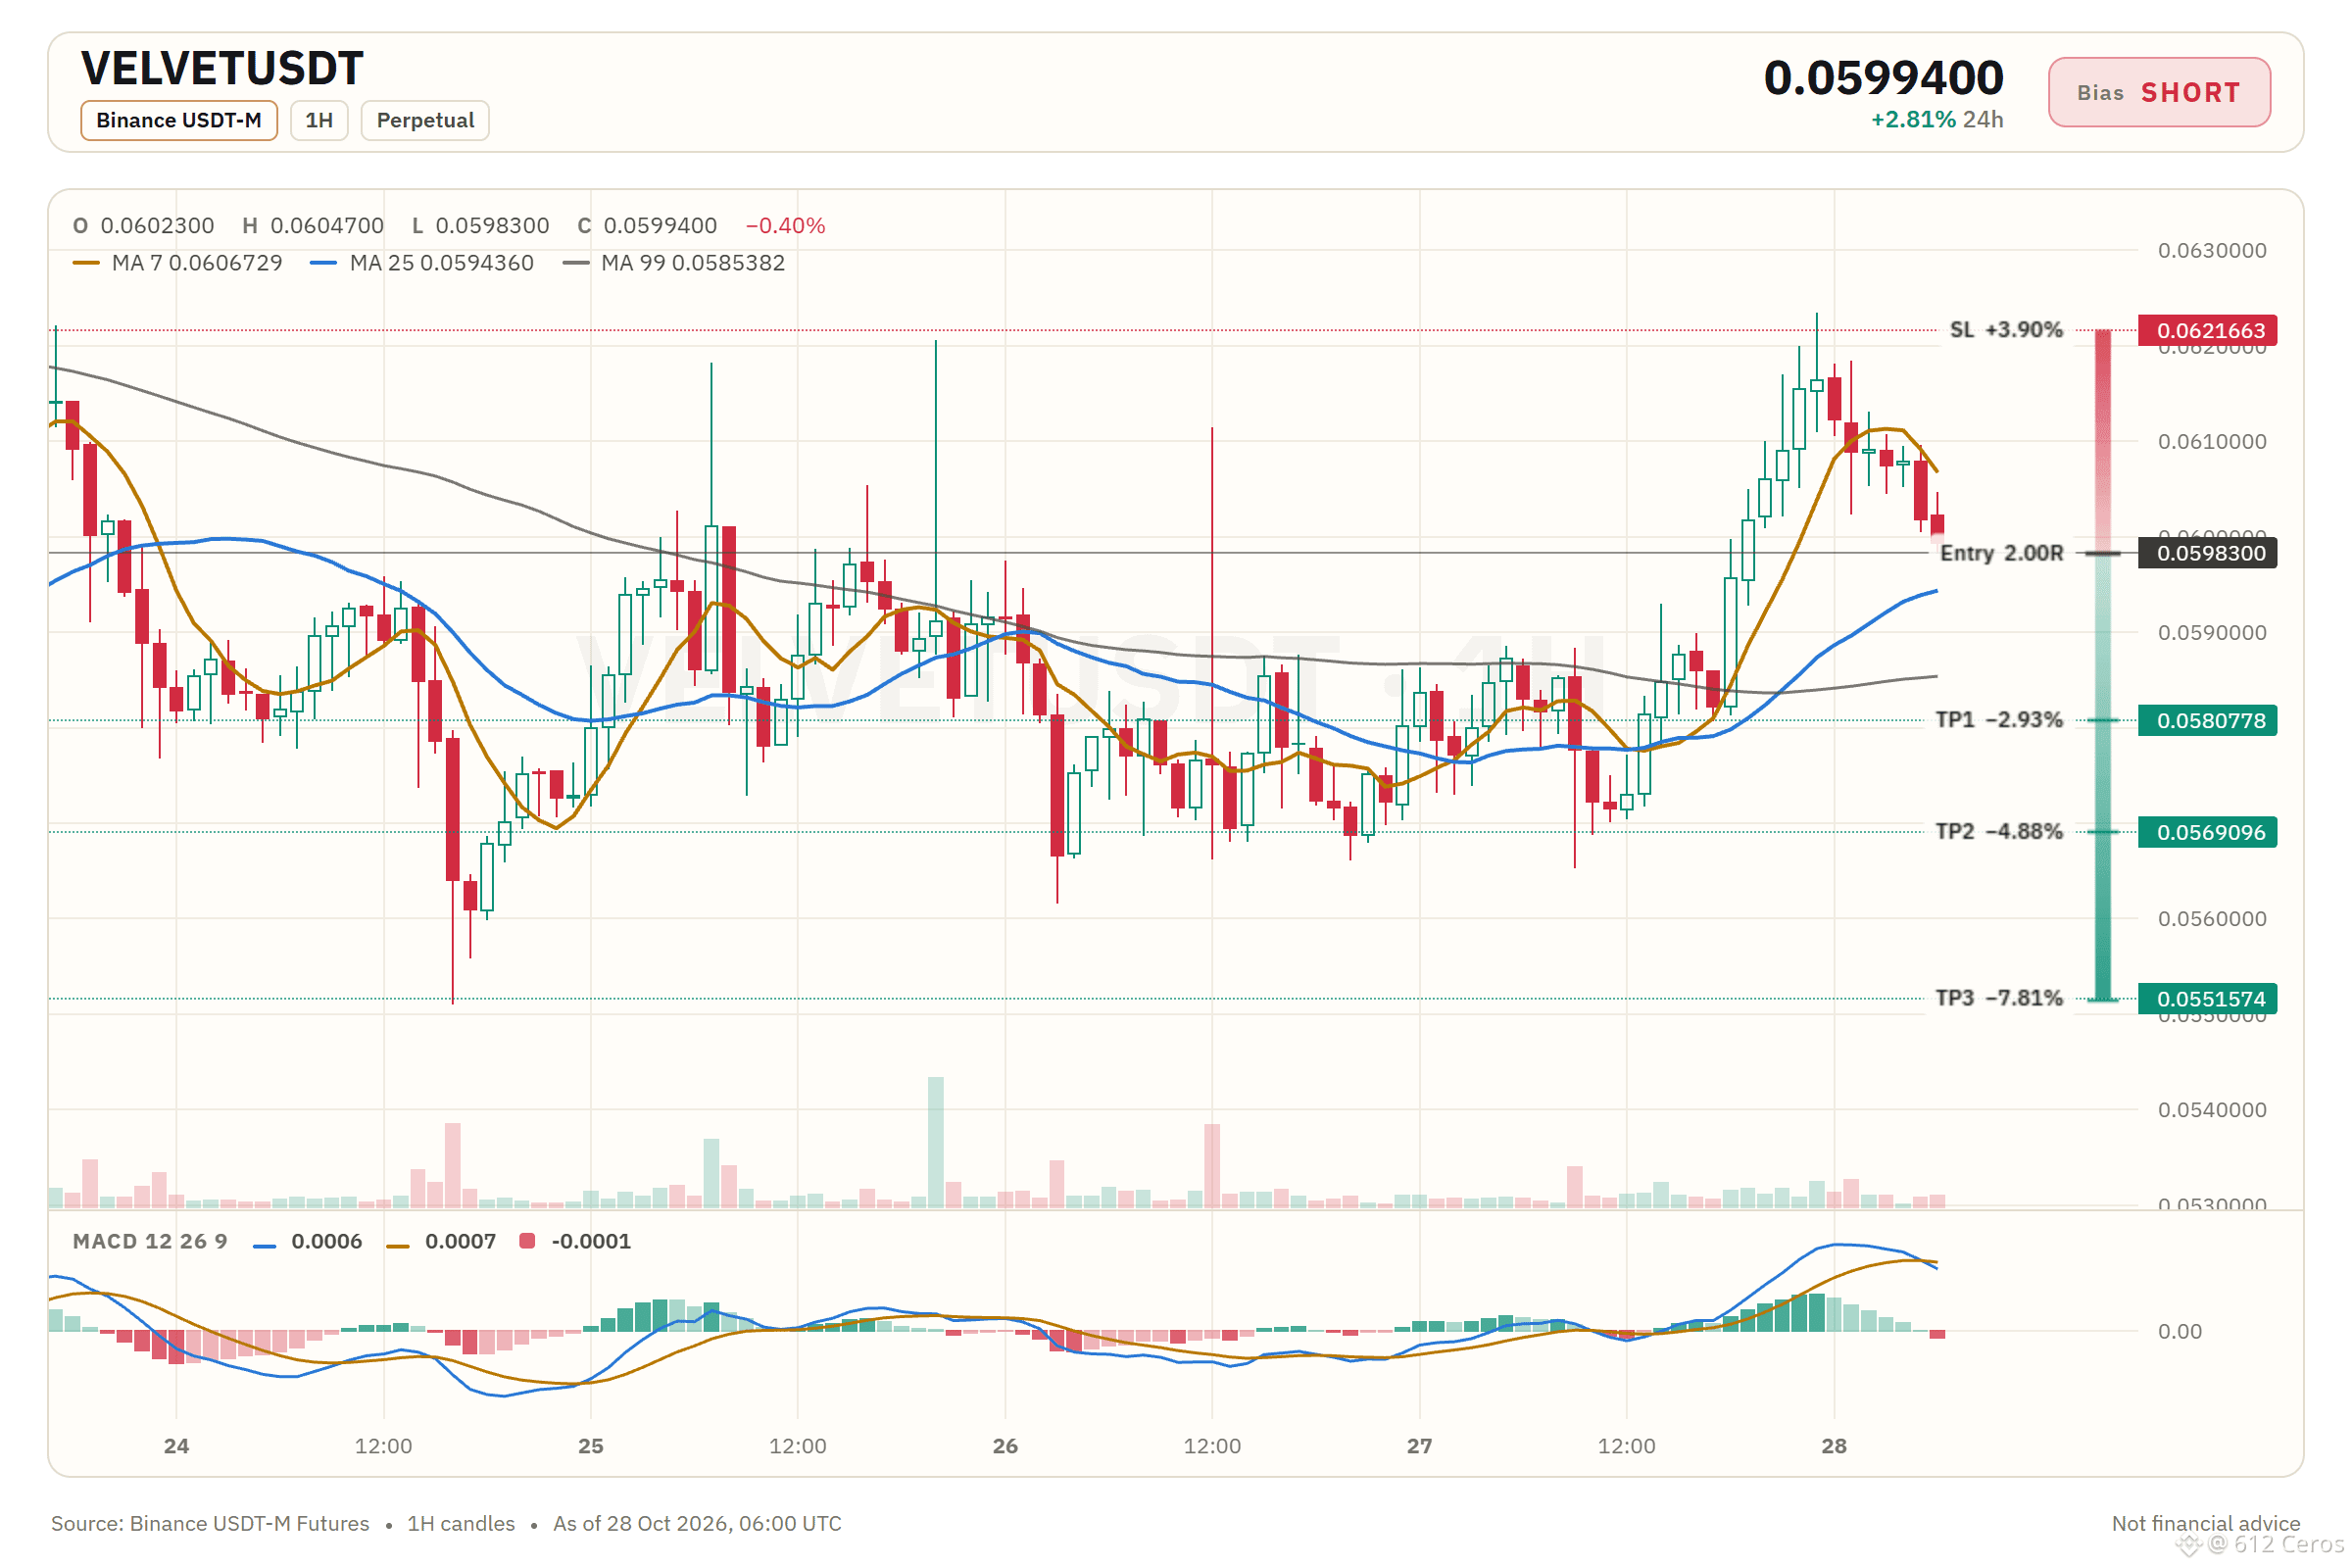
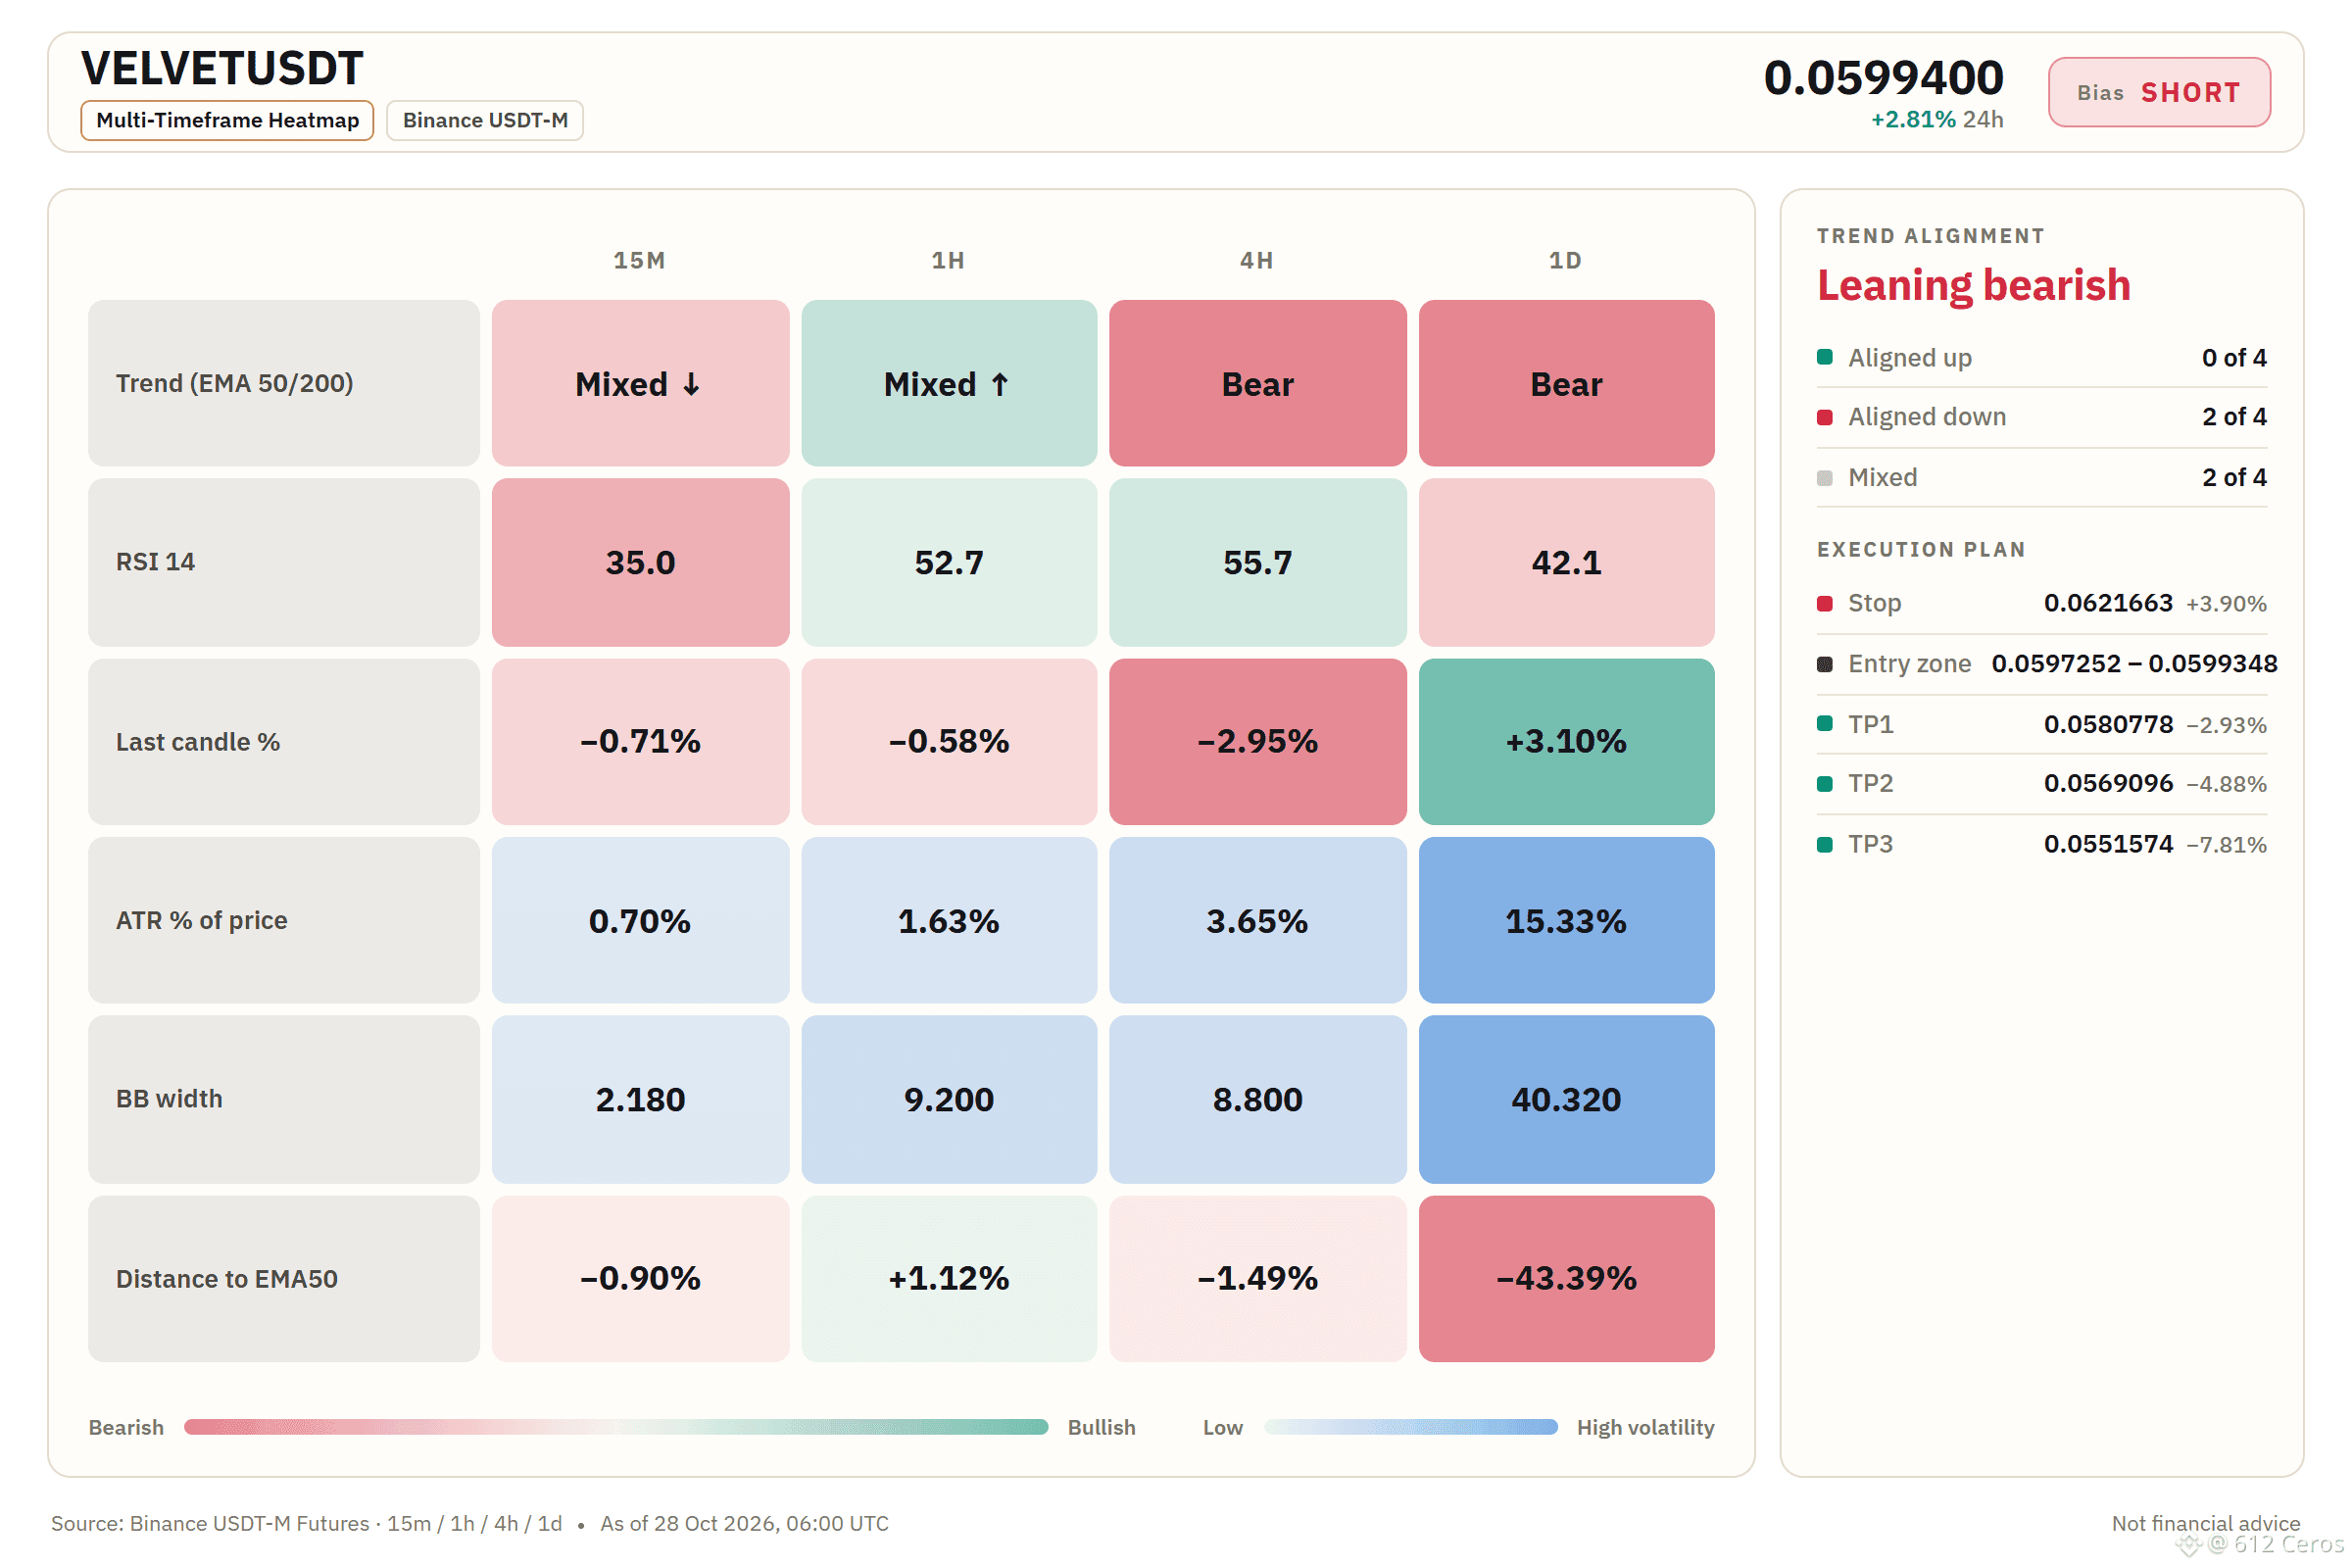
VELVET keeps sliding, the daily stack stays bearish.
🔴 SHORT $VELVET /USDT: expecting price to go DOWN
Bias: SHORT · Leaning
Entry: 0.0597252 – 0.0599348
TP1: 0.0580778 (-2.9%)
TP2: 0.0569096 (-4.9%)
TP3: 0.0551574 (-7.8%)
SL: 0.0621663 (+3.9%)
Plan: enter only inside the zone, close 50% at TP1, 25% at TP2, 25% at TP3, and move the stop to entry after TP1.
Note: moderate conviction only, keep size light.
Why SHORT? 4/12 signals agree, 2 against.
• Daily trend down (below EMA50 & EMA200)
• 4h trend down (below EMA50 & EMA200)
• Sellers are driving the move (15m ADX 22.4)
Risk: Buyers have the momentum (4h RSI 55.7)
In plain words:
The daily trend is bearish, with price below the 50 and 200 EMA, and the 4h trend is down as well. The 1h price sits just below the 4h entry low at 0.0597252, and sellers still have the momentum on the 15m chart.
Where do you set your invalidation if you are not short?
Chart with every level below.
{future}(VELVETUSDT)
📲 Want more of my latest signals? Join me here:
[https://app.binance.com/uni-qr/D26WbL9t](https://app.binance.com/uni-qr/D26WbL9t)
⚠️ Personal market analysis only. NFA — manage risk and DYOR.
Educational content, not investment advice or a recommendation to buy, sell, deposit, or withdraw any asset. No paid promotion or referral/affiliate links.
VELVET keeps sliding, the daily stack stays bearish.
🔴 SHORT $VELVET /USDT: expecting price to go DOWN
Bias: SHORT · Leaning
Entry: 0.0597252 – 0.0599348
TP1: 0.0580778 (-2.9%)
TP2: 0.0569096 (-4.9%)
TP3: 0.0551574 (-7.8%)
SL: 0.0621663 (+3.9%)
Plan: enter only inside the zone, close 50% at TP1, 25% at TP2, 25% at TP3, and move the stop to entry after TP1.
Note: moderate conviction only, keep size light.
Why SHORT? 4/12 signals agree, 2 against.
• Daily trend down (below EMA50 & EMA200)
• 4h trend down (below EMA50 & EMA200)
• Sellers are driving the move (15m ADX 22.4)
Risk: Buyers have the momentum (4h RSI 55.7)
In plain words:
The daily trend is bearish, with price below the 50 and 200 EMA, and the 4h trend is down as well. The 1h price sits just below the 4h entry low at 0.0597252, and sellers still have the momentum on the 15m chart.
Where do you set your invalidation if you are not short?
Chart with every level below.
📲 Want more of my latest signals? Join me here:
https://app.binance.com/uni-qr/D26WbL9t
⚠️ Personal market analysis only. NFA — manage risk and DYOR.
Educational content, not investment advice or a recommendation to buy, sell, deposit, or withdraw any asset. No paid promotion or referral/affiliate links.
426
·
--
Haussier
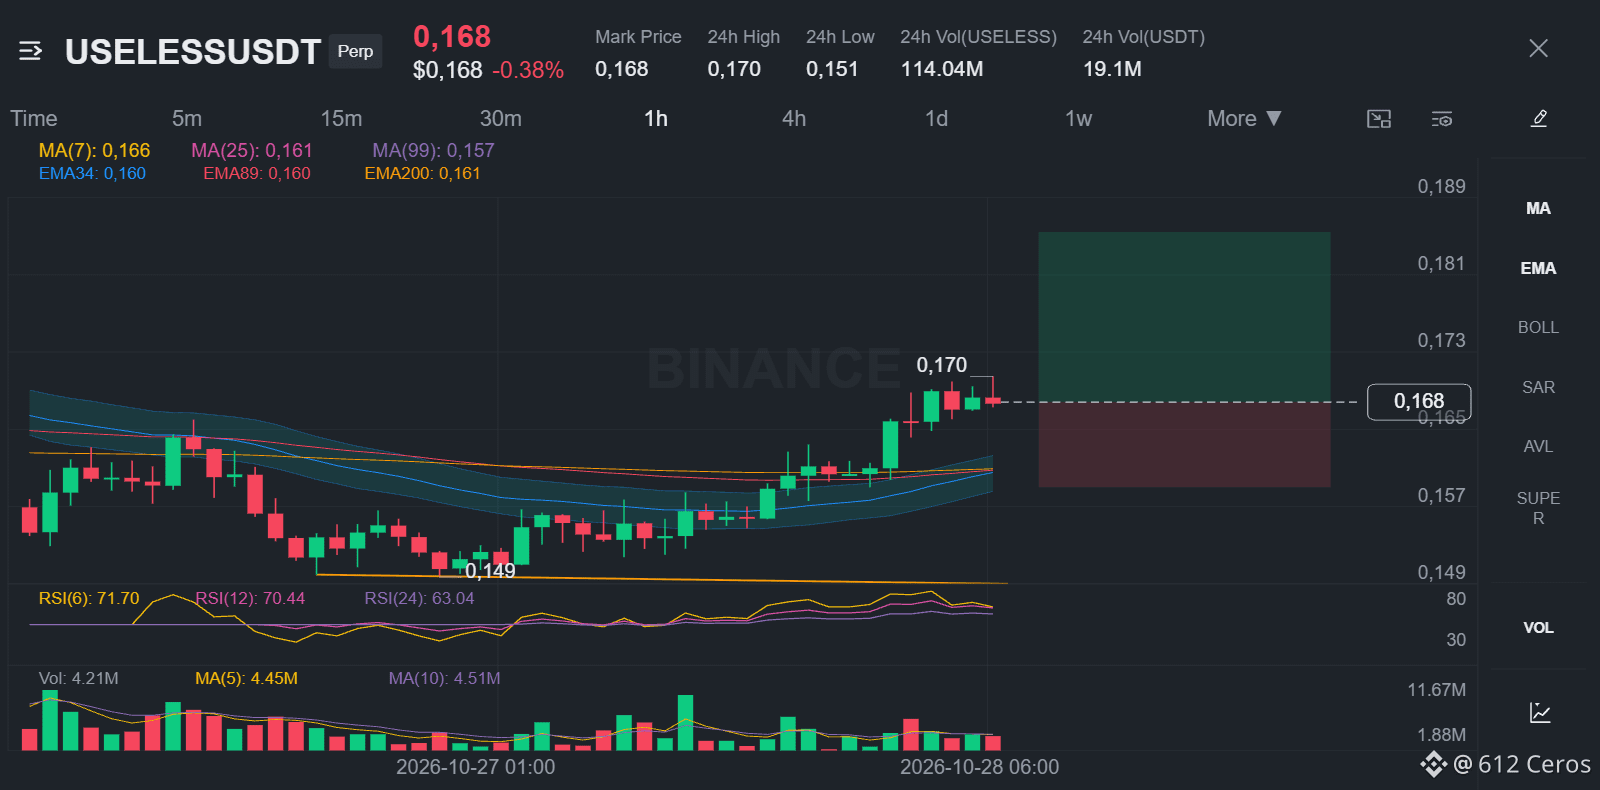
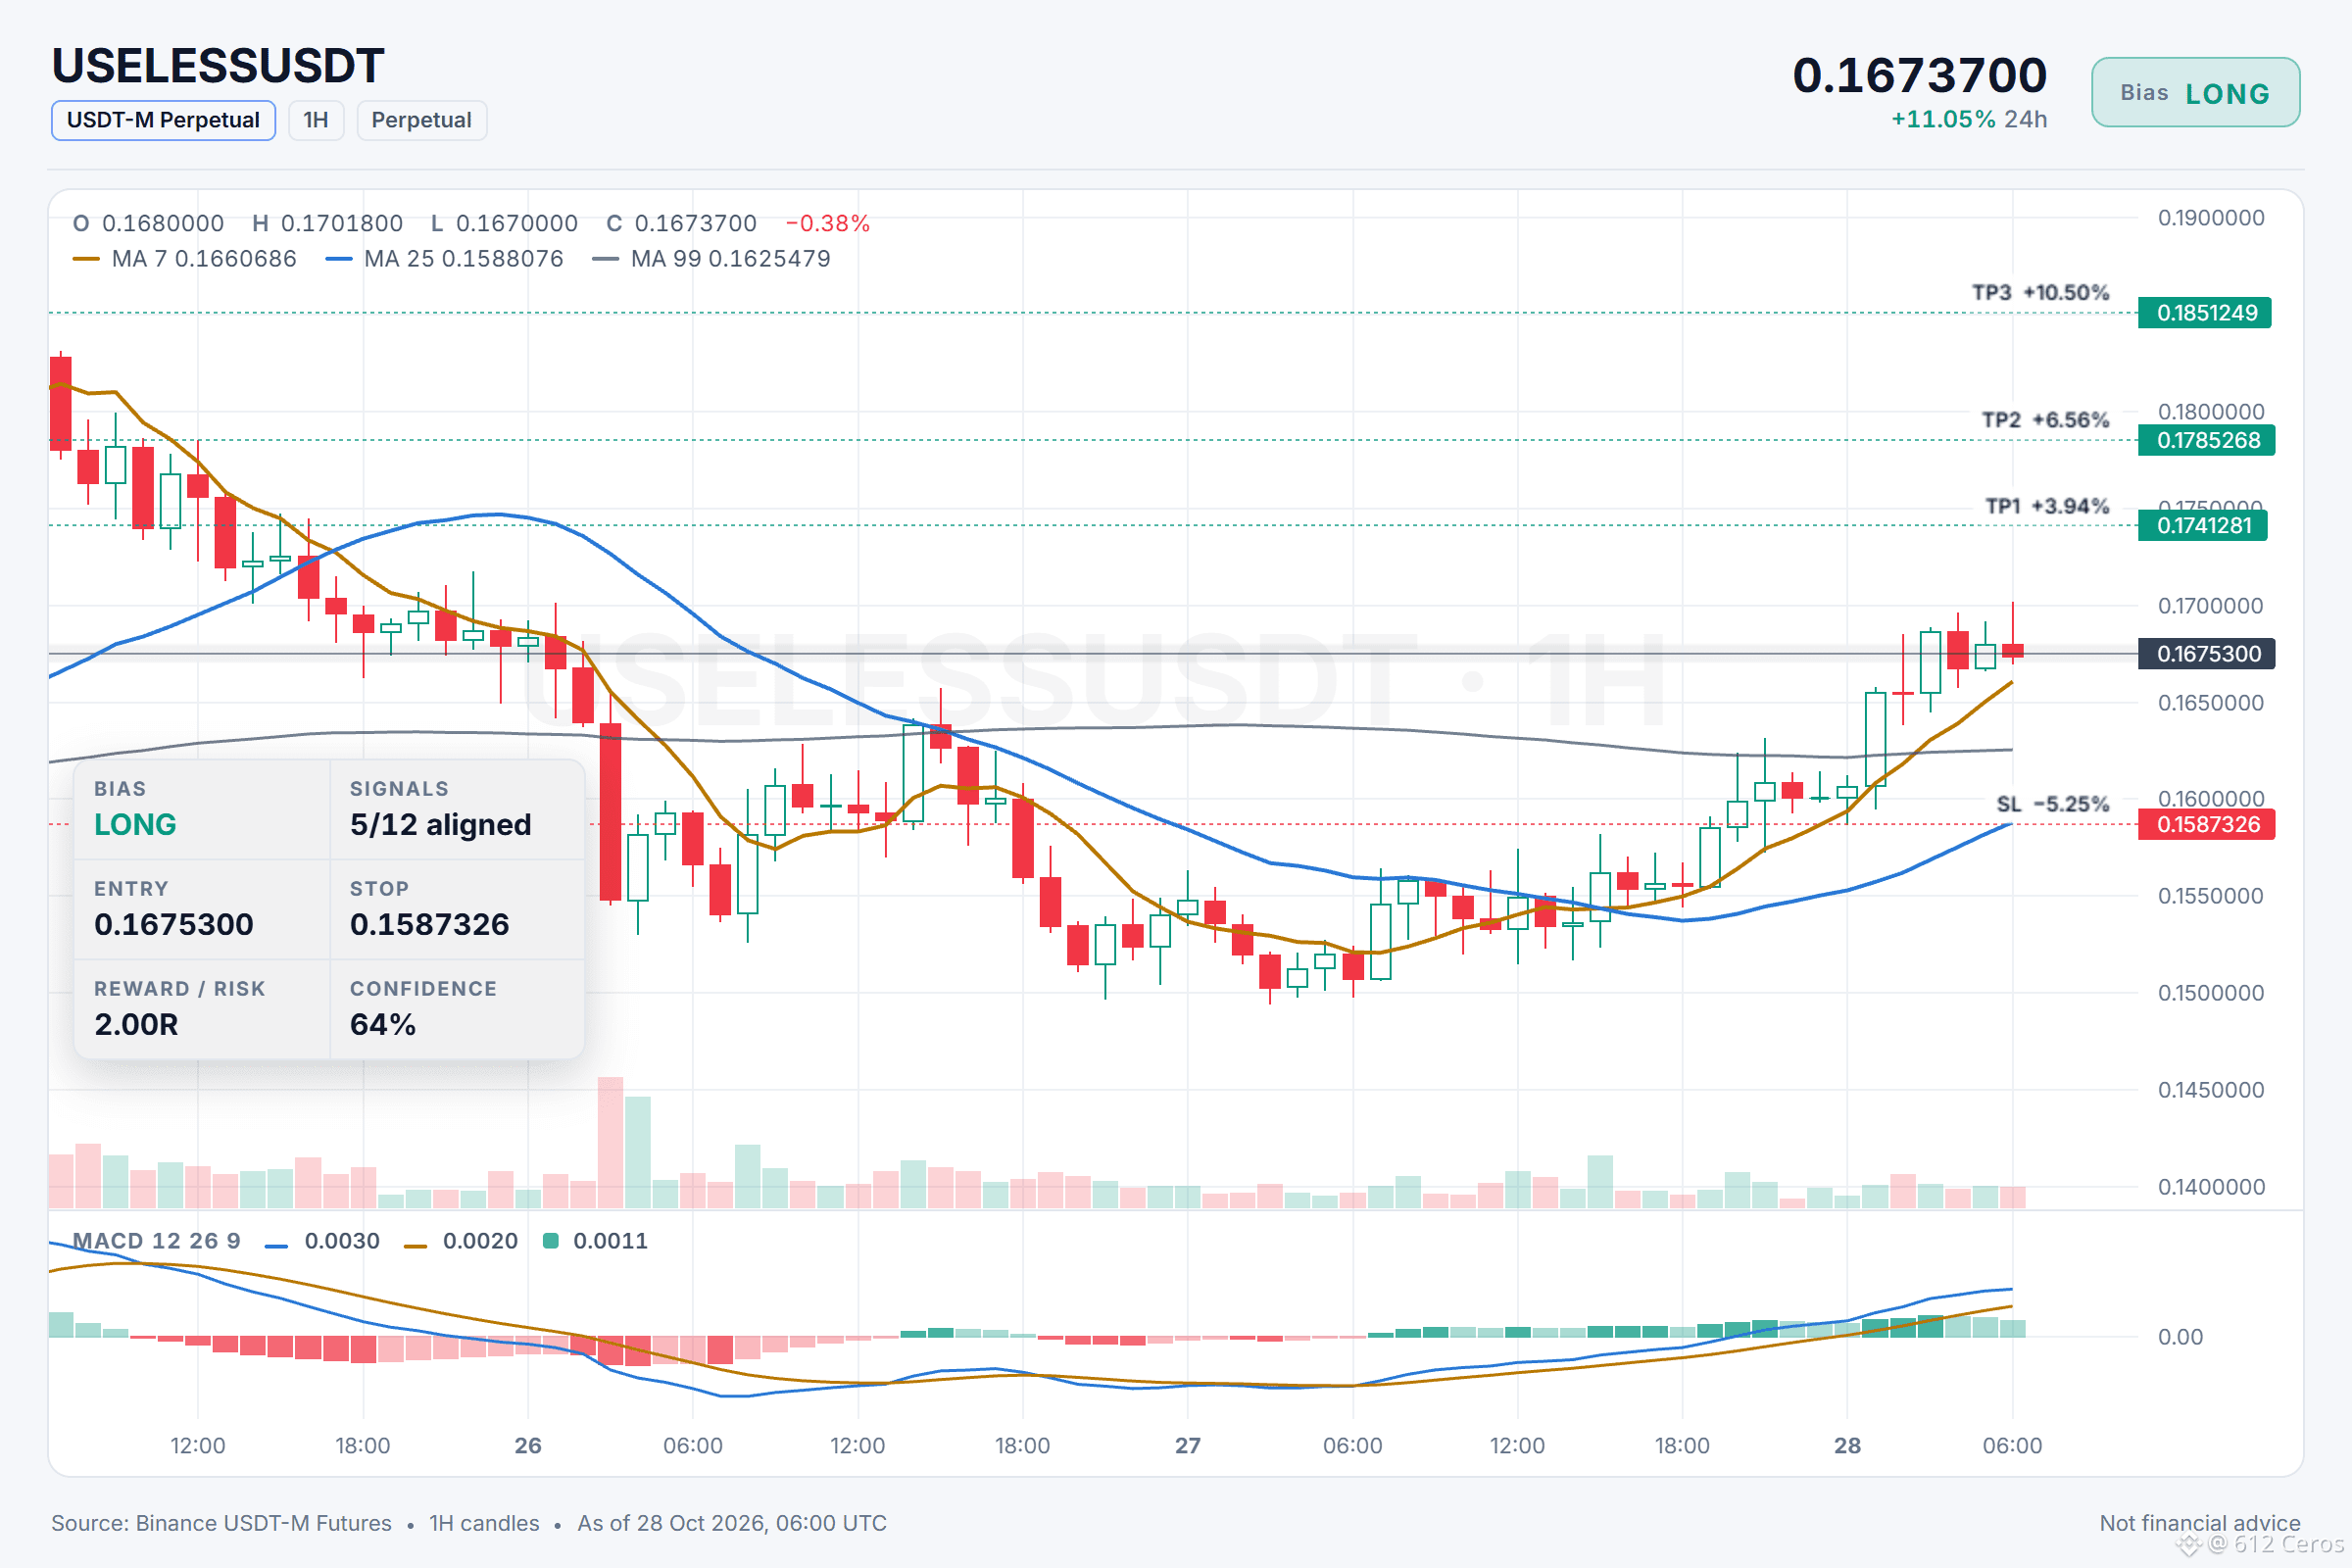
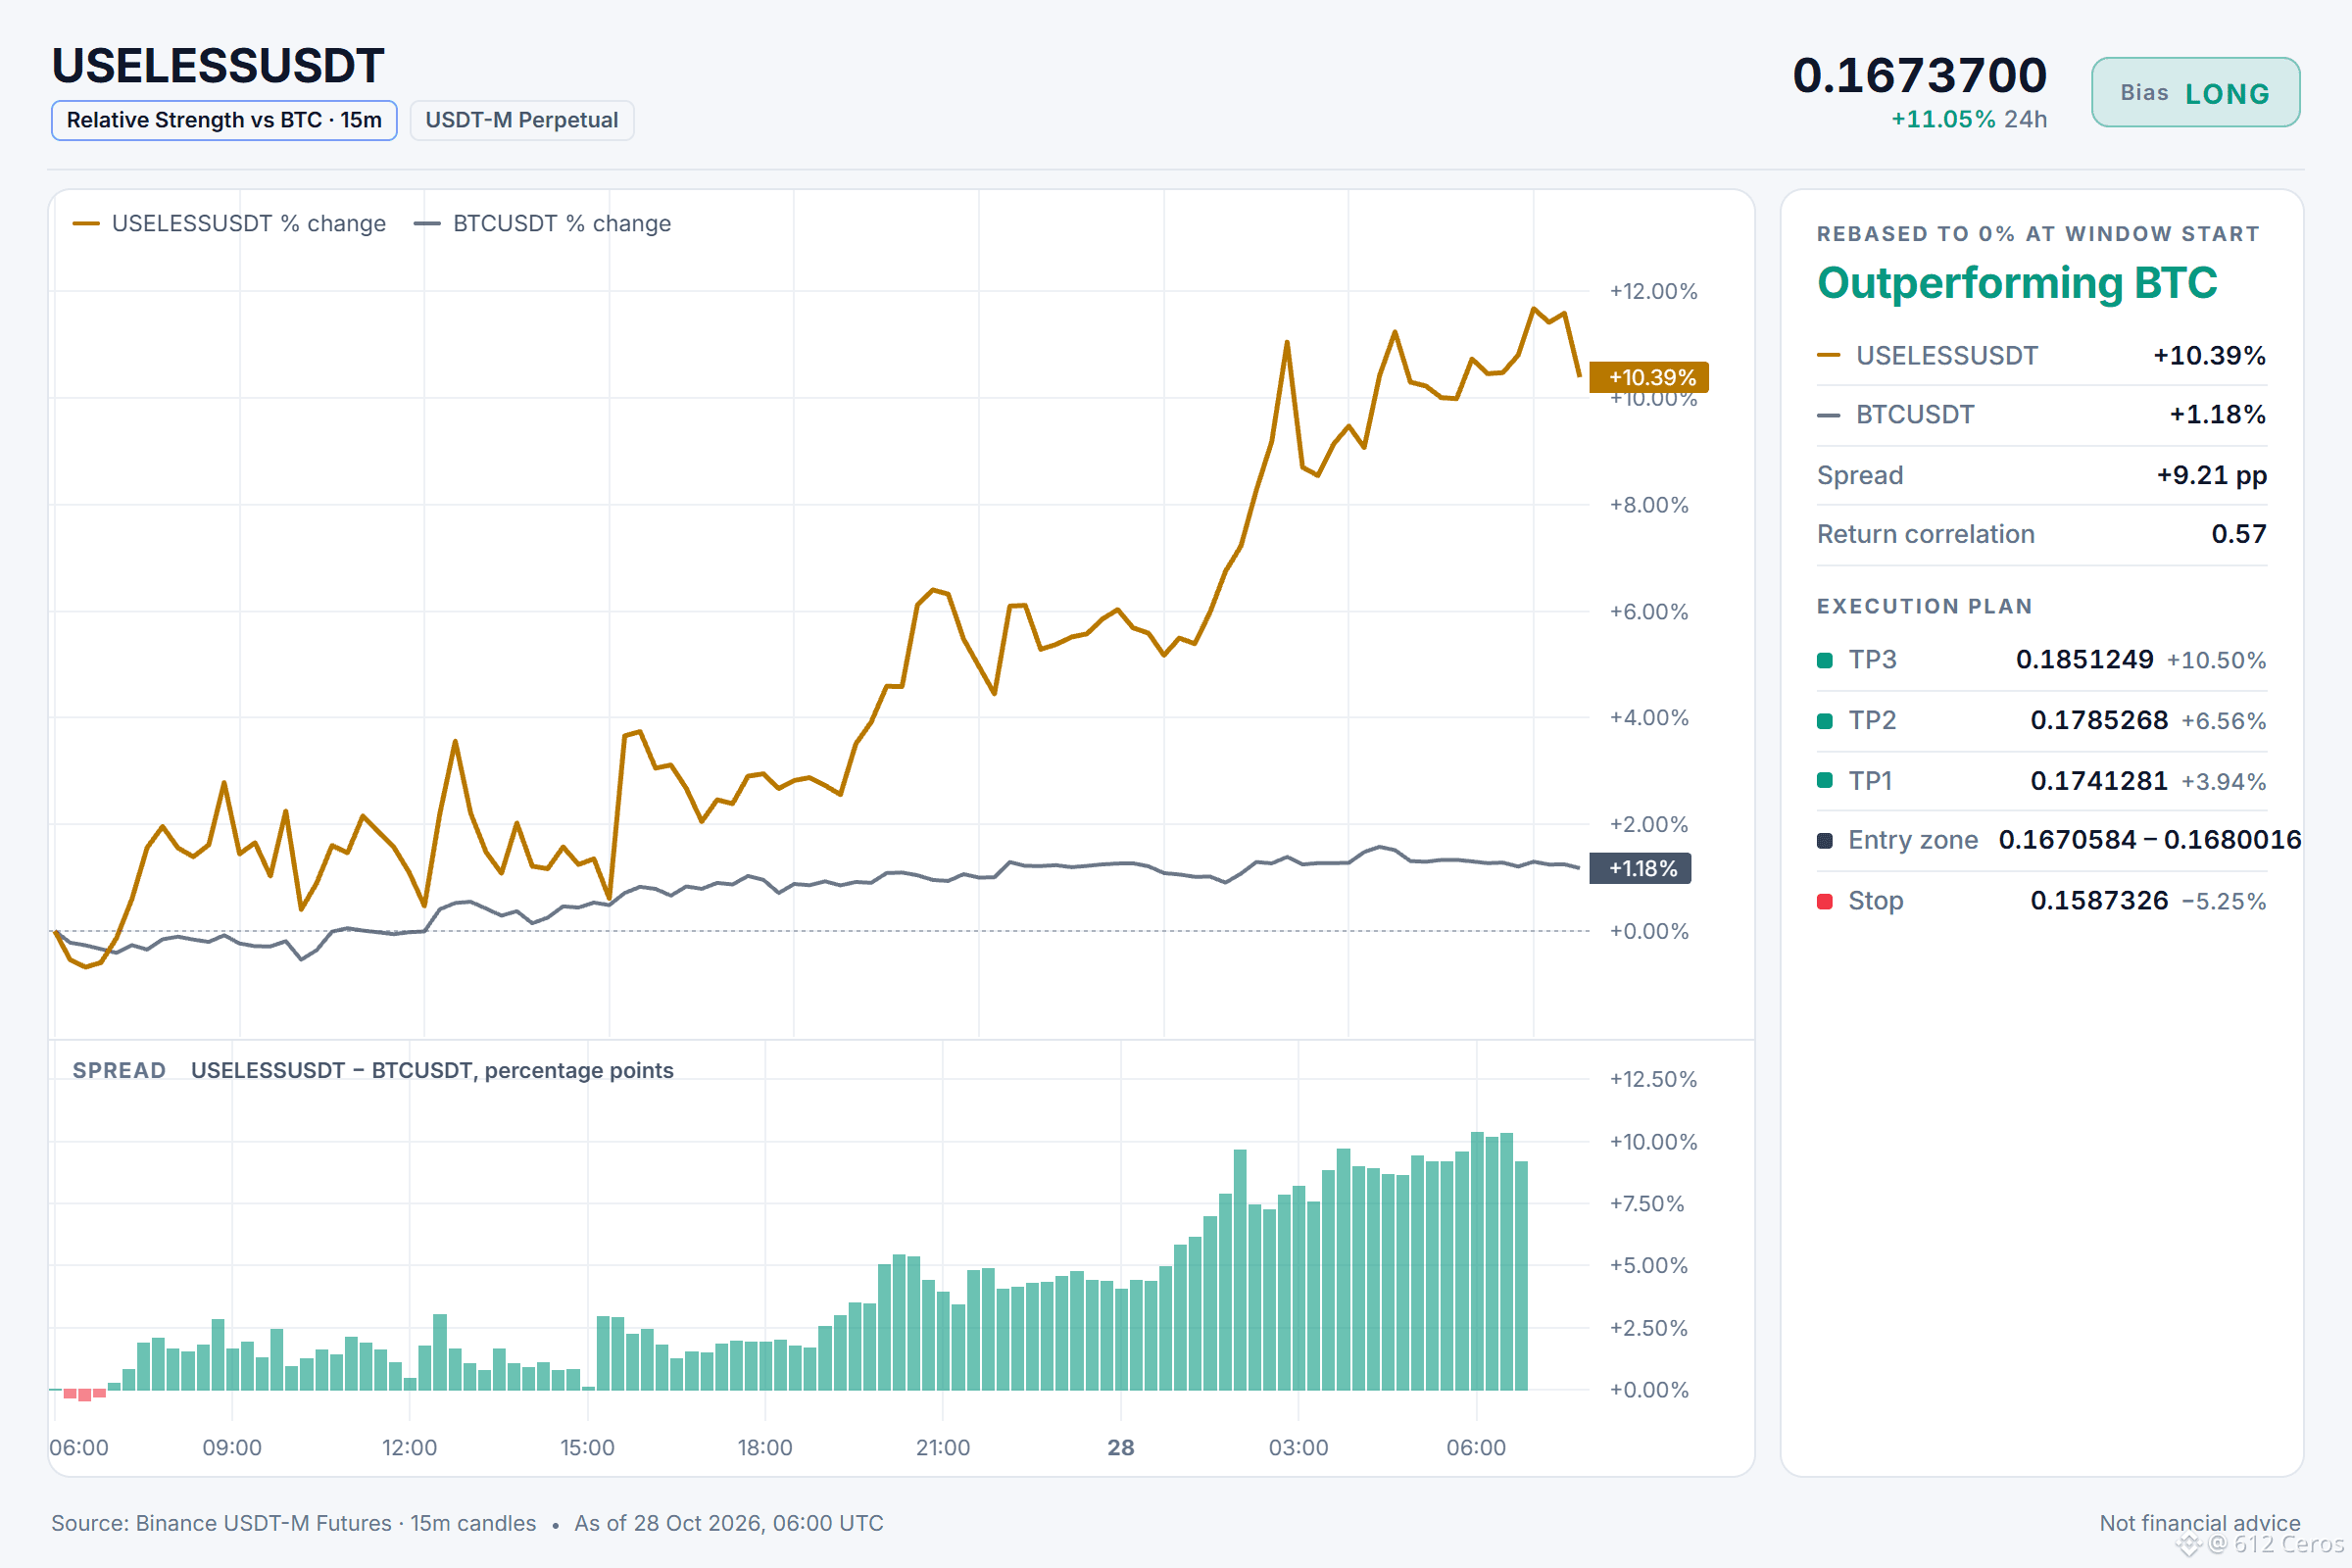
🟢 LONG $USELESS /USDT: expecting price to go UP
Bias: LONG · Leaning
Entry: 0.1670584 – 0.1680016
TP1: 0.1741281 (+3.9%)
TP2: 0.1785268 (+6.6%)
TP3: 0.1851249 (+10.5%)
SL: 0.1587326 (-5.3%)
Plan: enter only inside the zone, close 50% at TP1, 25% at TP2, 25% at TP3, and move the stop to entry after TP1.
Note: moderate conviction only, keep size light.
Can USELESS flip bullish on the next 1h candle?
Why LONG? 5/12 signals agree, 1 against.
• 1h trend up (above EMA50 & EMA200)
• Buyers are driving the move (15m ADX 44.6)
• Buyers have the momentum (4h RSI 57.4)
Risk: Sellers are pushing right now (−0.98% 15m candle)
The 1h price is above the 50 and 200 EMA, a bullish stack that means the short-term trend is up, and the 1h RSI sits at 67.4, showing buyers have momentum.
What is your invalidation level if you take this long?
Chart with every level below.
{future}(USELESSUSDT)
📲 Want more of my latest signals? Join me here:
[https://app.binance.com/uni-qr/D26WbL9t](https://app.binance.com/uni-qr/D26WbL9t)
⚠️ Personal market analysis only. NFA — manage risk and DYOR.
Educational content, not investment advice or a recommendation to buy, sell, deposit, or withdraw any asset. No paid promotion or referral/affiliate links.
🟢 LONG $USELESS /USDT: expecting price to go UP
Bias: LONG · Leaning
Entry: 0.1670584 – 0.1680016
TP1: 0.1741281 (+3.9%)
TP2: 0.1785268 (+6.6%)
TP3: 0.1851249 (+10.5%)
SL: 0.1587326 (-5.3%)
Plan: enter only inside the zone, close 50% at TP1, 25% at TP2, 25% at TP3, and move the stop to entry after TP1.
Note: moderate conviction only, keep size light.
Can USELESS flip bullish on the next 1h candle?
Why LONG? 5/12 signals agree, 1 against.
• 1h trend up (above EMA50 & EMA200)
• Buyers are driving the move (15m ADX 44.6)
• Buyers have the momentum (4h RSI 57.4)
Risk: Sellers are pushing right now (−0.98% 15m candle)
The 1h price is above the 50 and 200 EMA, a bullish stack that means the short-term trend is up, and the 1h RSI sits at 67.4, showing buyers have momentum.
What is your invalidation level if you take this long?
Chart with every level below.
📲 Want more of my latest signals? Join me here:
https://app.binance.com/uni-qr/D26WbL9t
⚠️ Personal market analysis only. NFA — manage risk and DYOR.
Educational content, not investment advice or a recommendation to buy, sell, deposit, or withdraw any asset. No paid promotion or referral/affiliate links.
4
710
Connectez-vous pour découvrir plus de contenu
Rejoignez la communauté mondiale des adeptes de cryptomonnaies sur Binance Square
⚡️ Suviez les dernières informations importantes sur les cryptomonnaies.
💬 Jugé digne de confiance par la plus grande plateforme d’échange de cryptomonnaies au monde.
👍 Découvrez les connaissances que partagent les créateurs vérifiés.
Adresse e-mail/Nº de téléphone