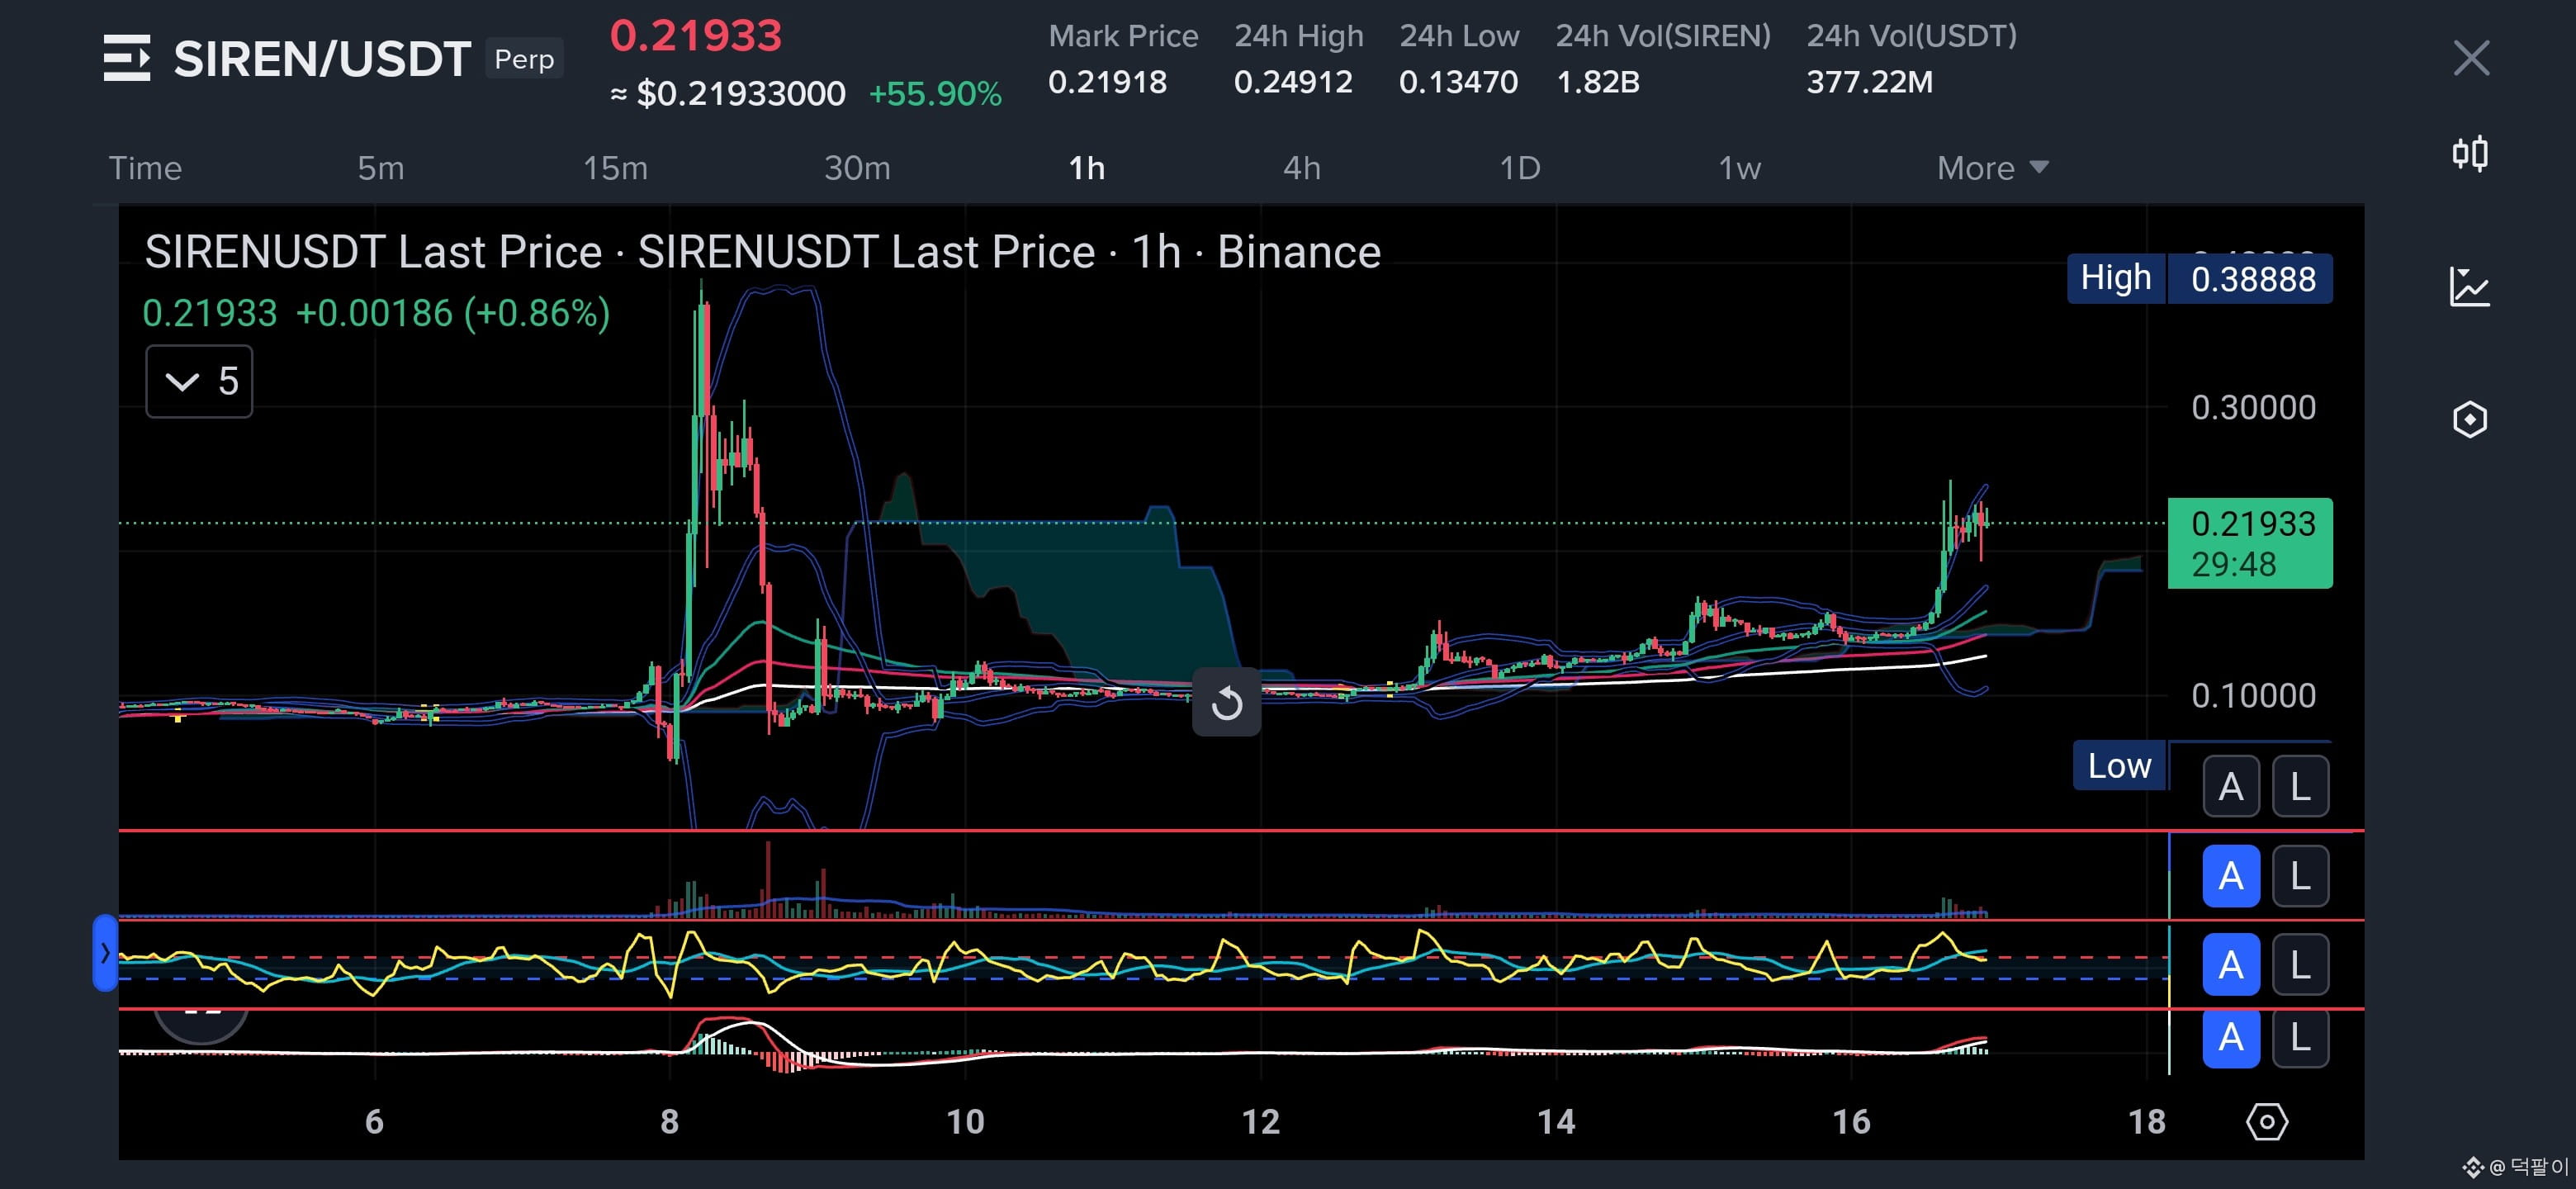
$SIREN
📊 SIRENUSDT Long 59% vs Short 41% — Momentum Building After Expansion
Please take a moment to check this out! Follow to stay ahead together.
🟢 Long (59%)
📈 Price reclaimed key moving averages and is holding above the cloud support.
🧠 Higher lows structure after the impulse suggests accumulation rather than distribution.
💧 Volume expanded during the breakout and cooled during consolidation, supporting trend continuation.
⚡ As long as support holds, upside liquidity remains the primary target.
📊 CCI is holding above the midline, showing sustained bullish momentum.
📈 MACD histogram is expanding again, signaling strengthening upside pressure.
🔴 Short (41%)
👀 Strong upper wick near recent highs shows sellers still defending resistance.
📉 Failure to maintain current structure could trigger fast long liquidations.
⚠️ Shorts gain control only if price loses the cloud and forms lower highs.
📊 Bollinger Bands are widening, increasing volatility and rejection risk.
📉 Momentum divergence may appear if price stalls while indicators weaken.