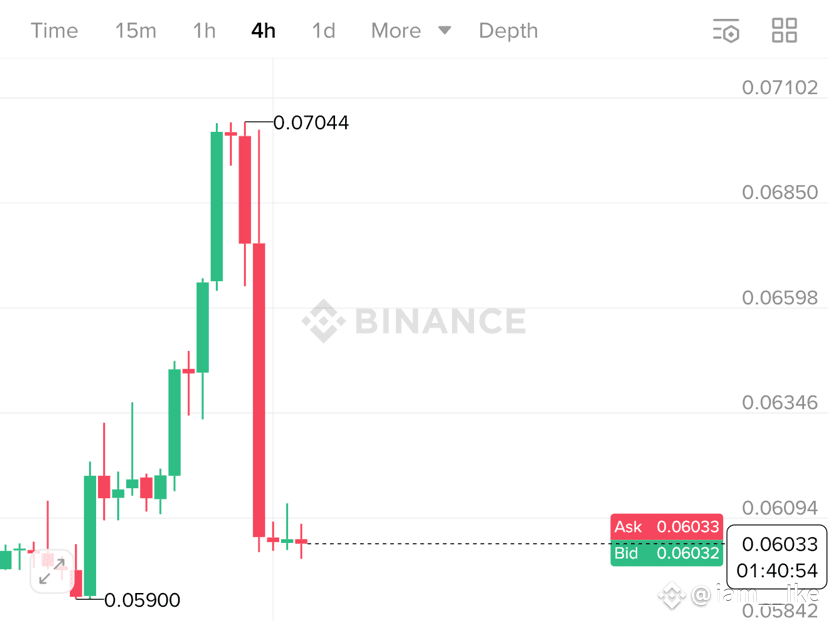
📉 TUT/USDT Price Action: From Breakout to Breakdown
In the past 24 hours, TUT/USDT has experienced a sharp move that highlights the power — and volatility — of candlestick trading on Binance.
⸻
🔹 The Setup
• 24h High: 0.07044 USDT
• 24h Low: 0.05997 USDT
• Current Price: 0.06033 USDT (▼ -13.86%)
• Volume (24h): 154.29M TUT traded
Looking at the 4-hour candlestick chart, TUT initially broke out from a local low at 0.05900 USDT, rallying quickly toward 0.07044 USDT. This bullish surge suggested strong buying momentum.
⸻
🔹 The Breakdown
Almost as quickly as it rose, TUT faced heavy sell pressure. The candlesticks show a rapid reversal:
• Sellers stepped in aggressively near 0.07044, pushing the price back down.
• A tall red candle (bearish engulfing) formed, erasing most of the previous gains.
• Price consolidated near 0.06030, a level just above the day’s low, hinting at indecision between bulls and bears.
⸻
🔹 Order Book Insights
Looking at Binance’s live order book:
• Bid (buyers) are stacking around 0.06032 USDT with heavy volume (10K+ orders).
• Ask (sellers) are crowding the 0.06033–0.06038 USDT zone, slightly outweighing buyers (52.5% sell vs. 47.5% buy).
This imbalance shows downside pressure remains, but bulls are defending the 0.06000 support fiercely.
⸻
🔹 Indicators to Watch
Traders on Binance often add tools like:
• RSI (Relative Strength Index): To see if TUT is oversold after the drop.
• MACD (Moving Average Convergence Divergence): To confirm if bearish momentum will continue.
• Bollinger Bands: To check if price is stretching too far below the midline, signaling a rebound.
⸻
🔹 What’s Next?
• If bulls hold 0.06000, a short-term rebound to 0.06500–0.06600 is possible.
• If sellers break that level, 0.05900 (the recent bottom) becomes the next critical support.
• Long-term traders will watch if volume confirms a reversal — or if this is just the start of deeper correction.#TUTUSD #Binance $TUT