


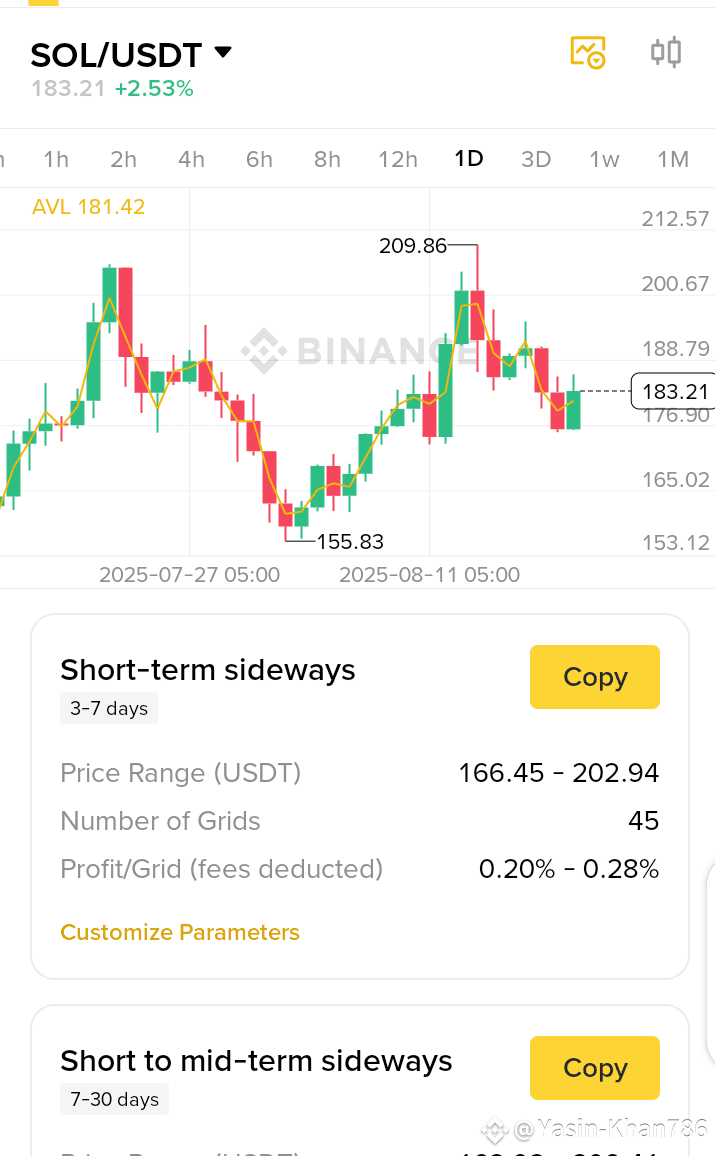
🔎 Chart Observations
Current Price: $183.21 (+2.53%)
Key Levels:
Recent high: $209.86 (strong resistance).
Recent low: $155.83 (support level).
Current trading range: Between $166.45 – $202.94 (Binance suggests this sideways range).
Trend:
The chart shows a strong rally from $155 → $209, followed by a correction.
Now price is stabilizing near $183, close to the average line (AVL 181.42).
The candlesticks show sideways movement — buyers and sellers are balanced.
Short-term sideways: Binance suggests that SOL may move between $166 – $202 in the next 3–7 days with small profit opportunities per grid trade (0.20%–0.28%).
📈 Future Outlook
Bullish Signs:
Price is holding above $181 (average line).
If SOL breaks above $188–190, it can retest $200–210.
Long-term fundamentals of Solana (NFTs, DeFi, high TPS) remain strong.
Bearish Signs:
If price breaks below $176–178, it may fall back toward $166 support.
Strong resistance remains at $200–210.
📊 Prediction
Short-term (3–7 days): Likely sideways between $170–200.
Mid-term (7–30 days): If it holds above $180, SOL could aim for $200+ again.
Downside Risk: If Bitcoin weakens, SOL could test $165–170.
✅ Conclusion:
Right now, SOL is in a consolidation/sideways phase.
If you are trading short-term → Grid trading in the suggested range ($166–202) is safer.
If you are investing mid-term → Watch for a breakout above $190–195 for a bullish move.
Its price will decrease according to chart indication
 SOL118.19-1.63%