

“Indicators won’t make you a millionaire overnight — but they can stop you from making rookie mistakes.”
Let’s break down 3 simple tools that can help you enter trades with more confidence.
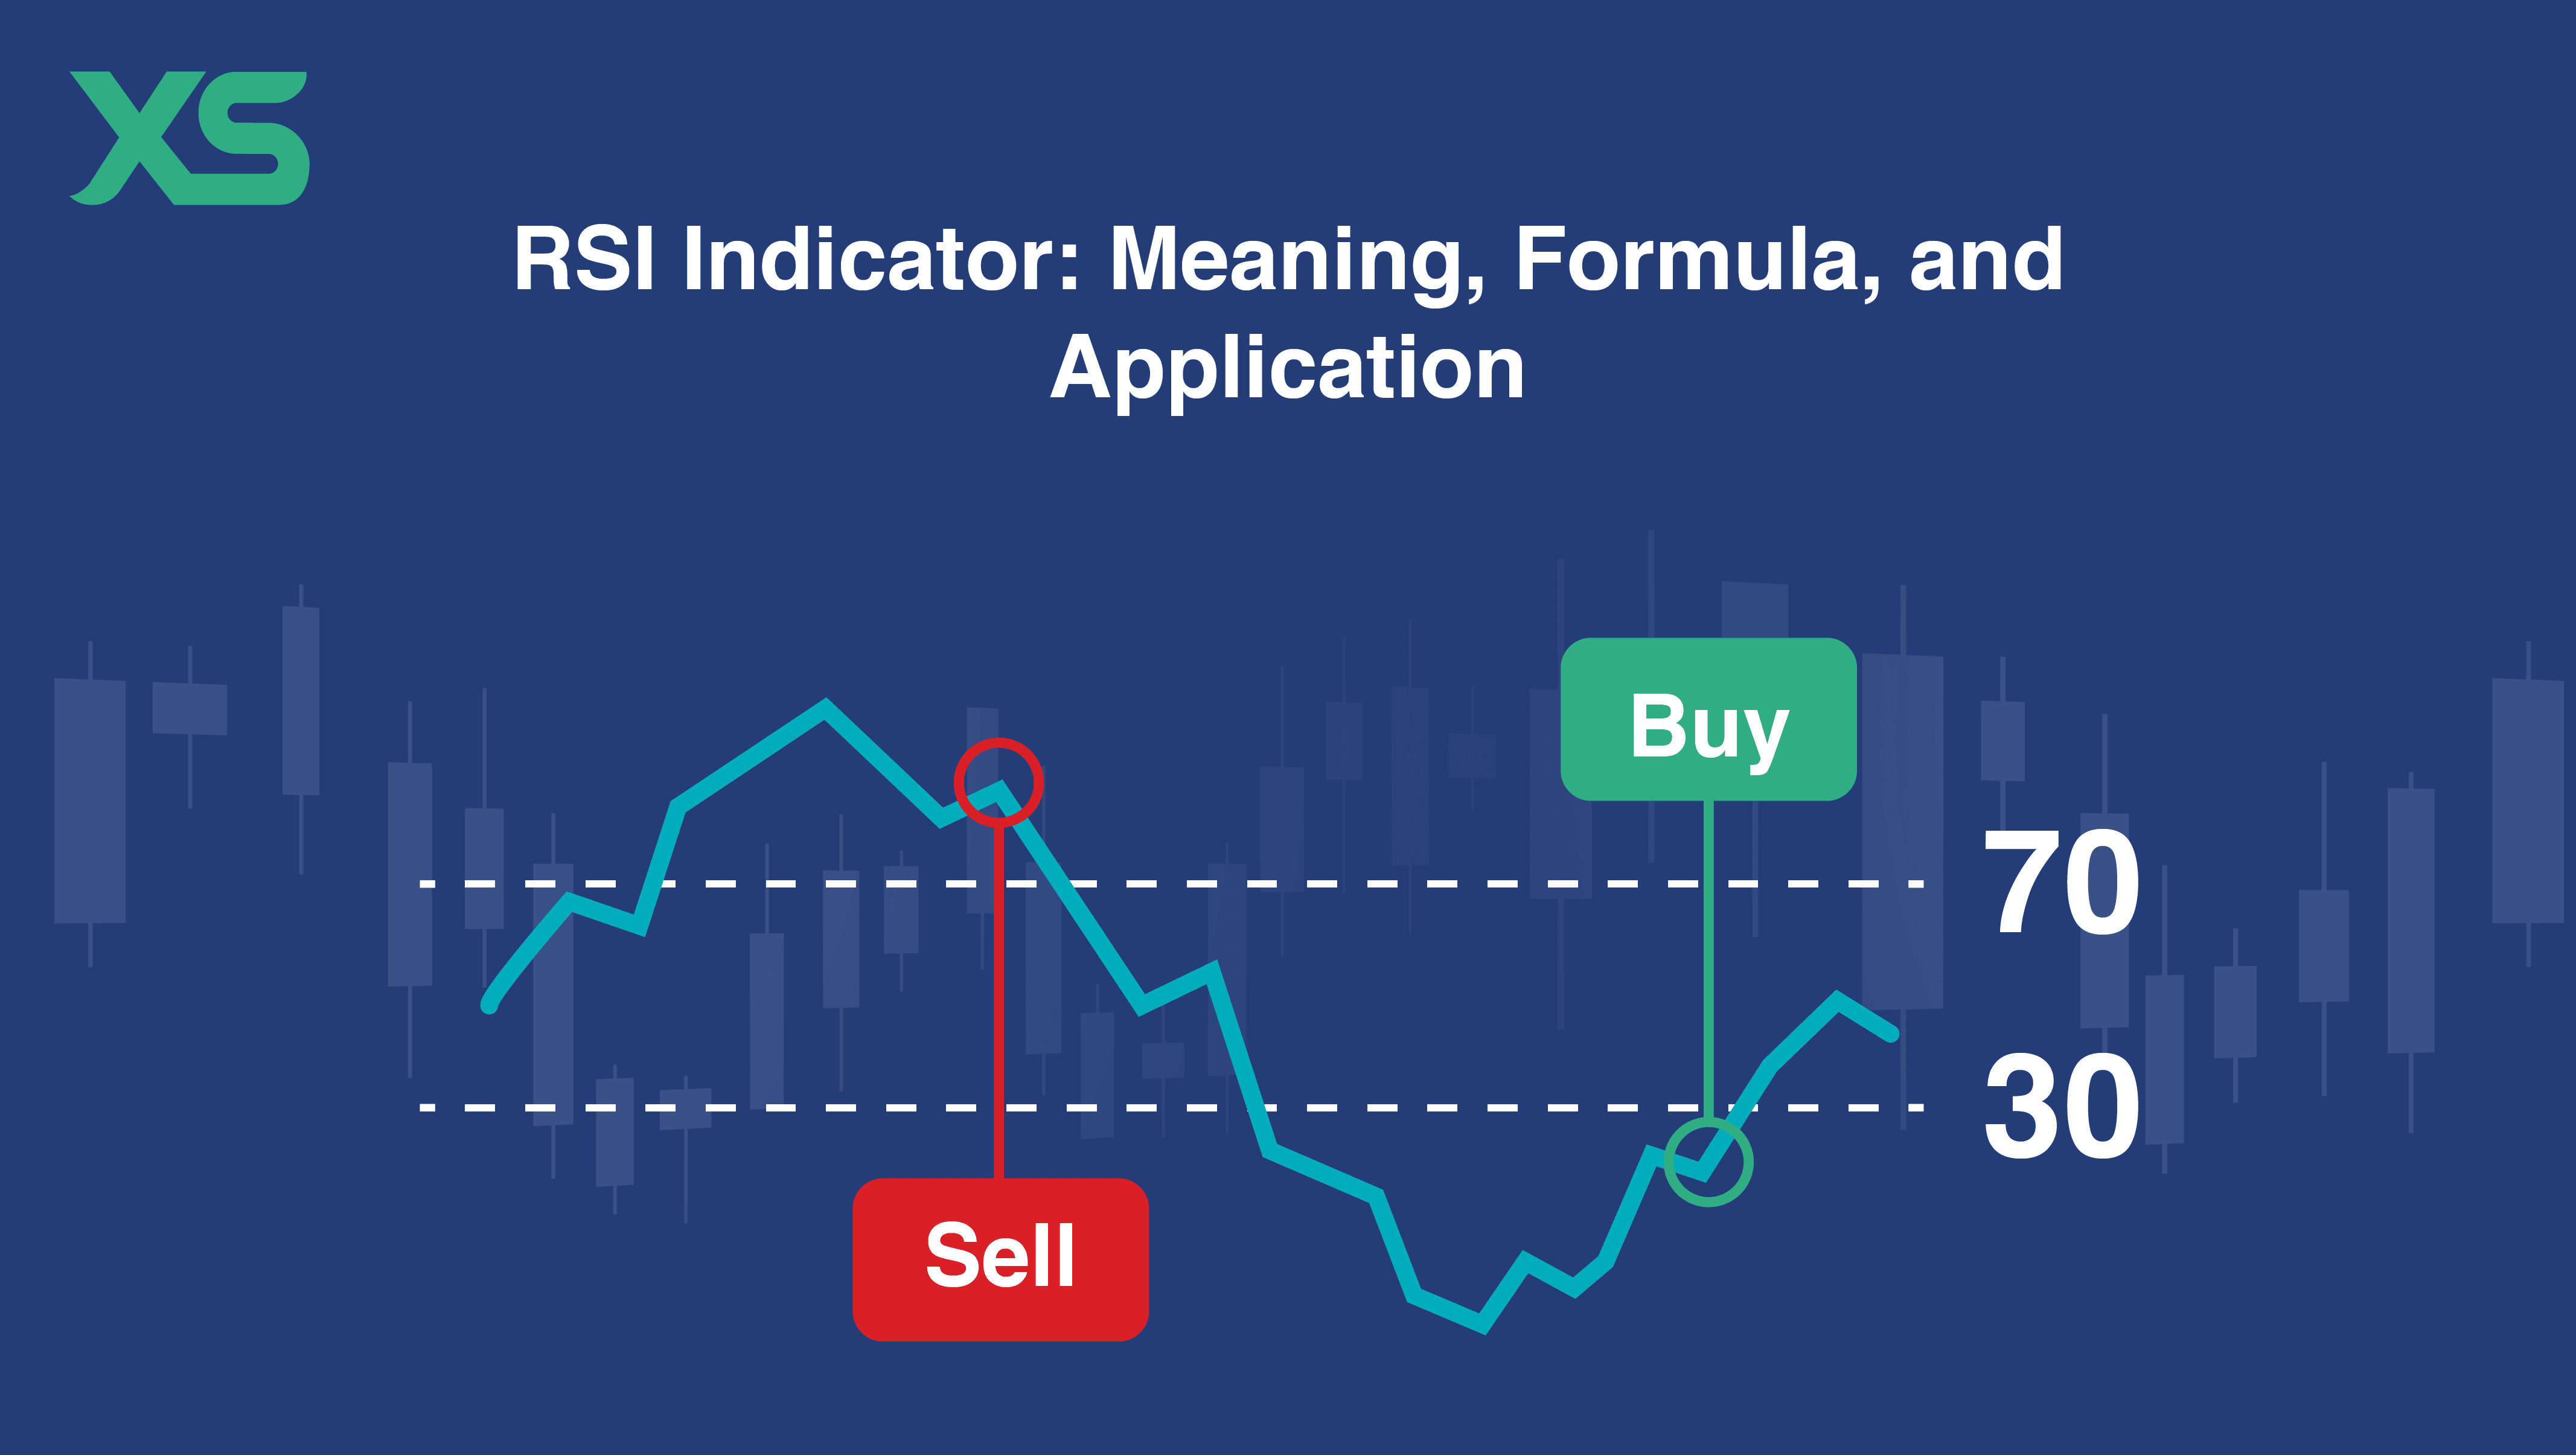
1. RSI (Relative Strength Index)
📉 Over 70 = overbought (possible pullback)
📈 Under 30 = oversold (possible bounce)
Works well in sideways markets to catch reversals.
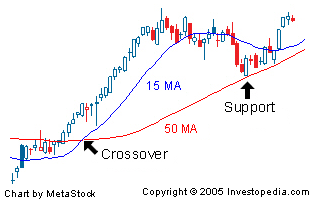
2. Moving Average (MA)
The 50-day MA helps spot short-term trends.
The 200-day MA shows the long-term market bias.
Price above both = bullish strength ✅. Price below both = bearish weakness ❌.
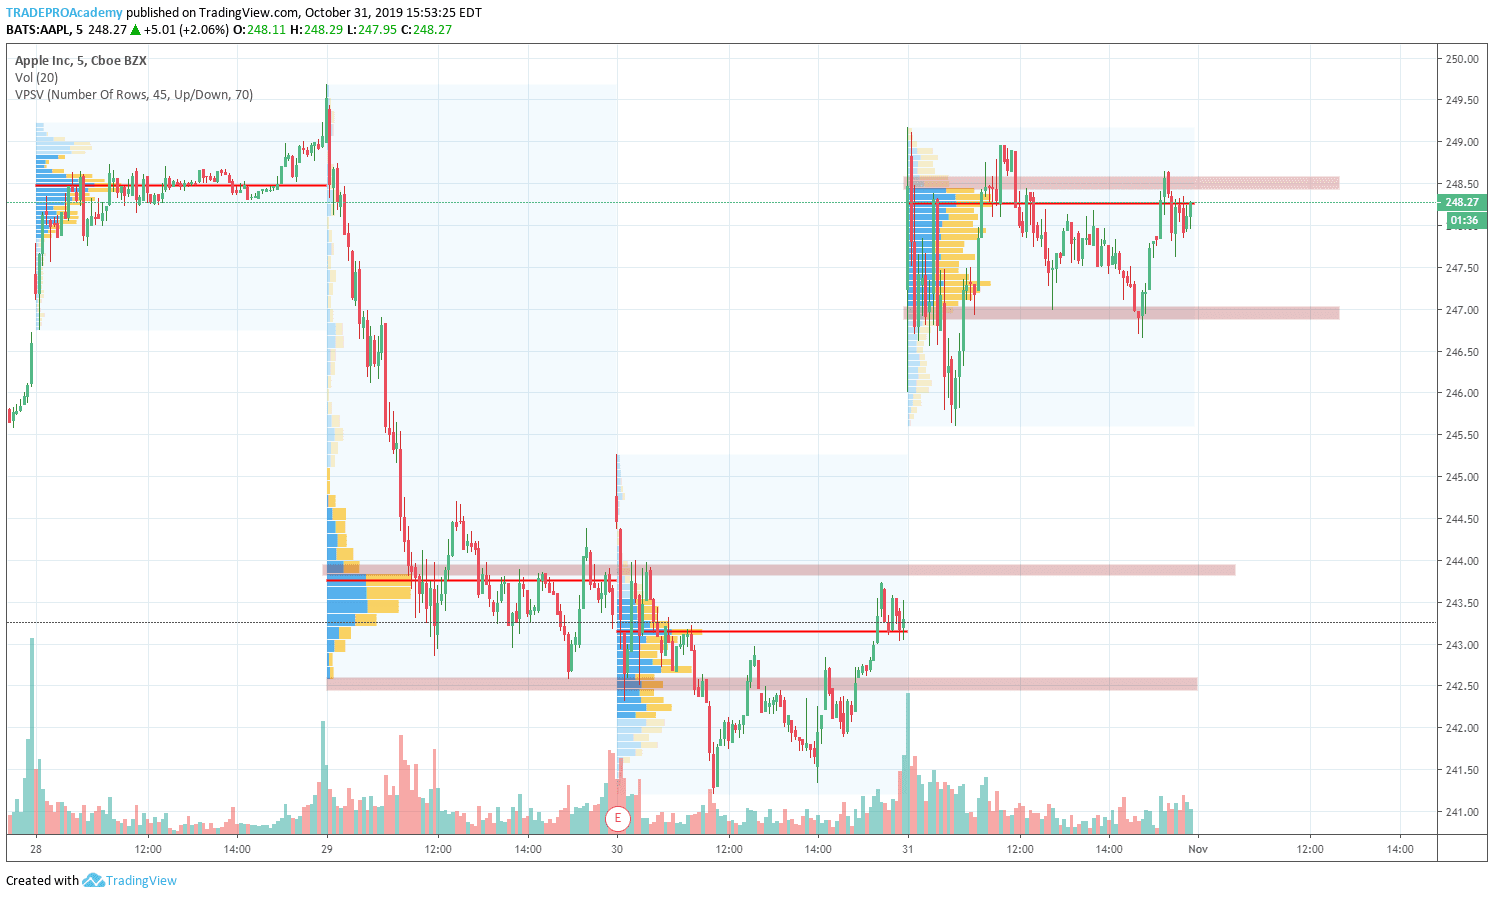
3. Volume
Rising volume with price up = strong move 💪.
Falling volume = move could be losing momentum ⚠️.
Pro Tip:
🔍 Don’t rely on just one indicator — combine them with support/resistance zones for stronger signals.
Conclusion:
The simpler your tools, the faster you can act.
📊 Which indicator is your car go-to? Tell me in the comments — I might cover it in the next post!
#CryptoIndicators #TechnicalAnalysiss #BinanceSquare #tradingStrategy #CryptoEducation💡🚀