$POL
Concise, and no-fluff analysis of the POL/USDC 4H chart
📈 Trend & Price Action
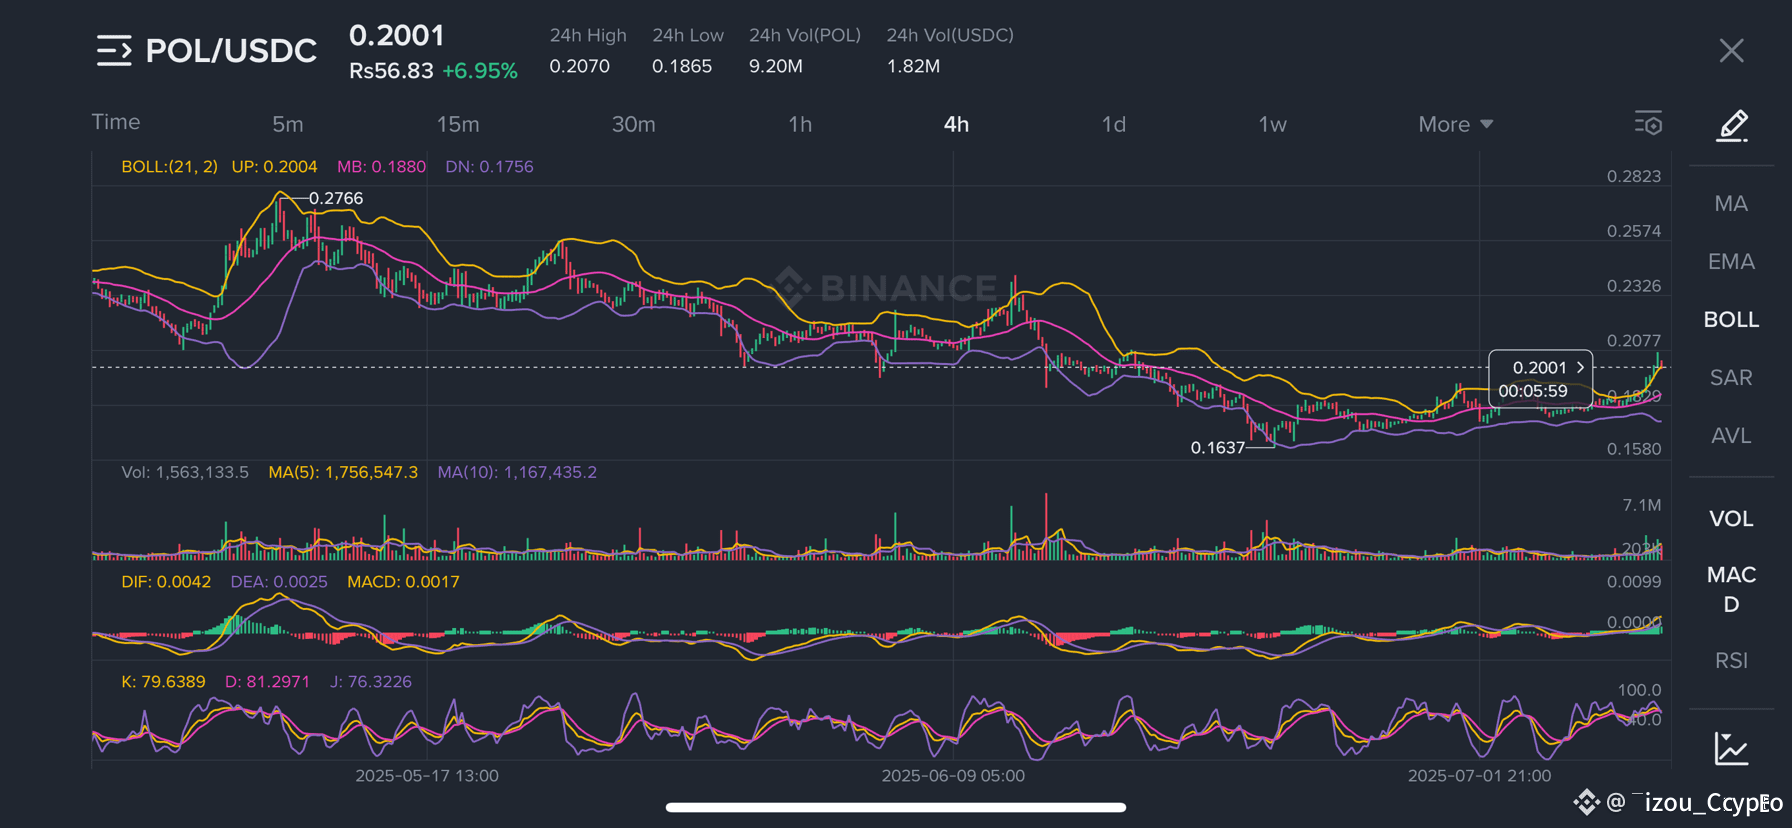
•Price has been in a clear downtrend from the peak at 0.2766, grinding down to a low of 0.1637.
•Recently it broke above the mid-range and is currently trading at 0.2001, showing a short-term bullish reversal attempt.
•Price just crossed above the middle Bollinger Band and is testing the upper band — suggesting buyers are stepping in aggressively here.
🪙 Volume
•Noticeable spike in volume on the current move up — this is healthy and confirms that buyers are serious.
•However, overall volume compared to the peak is moderate — suggests it might still be early accumulation and not full-blown breakout yet.
🔮 Indicators
•Bollinger Bands: Price pushing upper band with bands starting to expand — volatility returning. Bullish in short term but extended already.
•MACD: Positive crossover, but MACD is still near zero line — momentum is building but hasn’t exploded yet.
•Stochastic (K/D/J): Overbought territory (>79), which means some short-term cooling might happen soon before continuation.
📊 Levels to Watch
•Resistance: 0.2077, then 0.2326 (upper highs from previous range).
•Support: 0.1880 (middle Bollinger Band) & 0.1756 (lower support zone).
📝 Prediction & Plan
✅ Bias: Short-term bullish while above 0.1880. Medium trend still bearish until above 0.2326.
✅ Likely scenario: Price could test 0.2077, minor pullback if overbought conditions play out, then possible continuation towards 0.23 if volume sustains.
🚫 Caution: If price fails to hold above 0.1880, it could revisit 0.1756–0.16.
📌 Trade Idea
•Long entry: Around 0.190–0.195 if you catch a small dip.
•Target 1: 0.2077
•Target 2: 0.2326
•Stop loss: Below 0.1750
🔷 In short — momentum is improving, bulls are trying to reverse but it’s still early. Overbought indicators suggest you wait for a minor pullback before entering aggressively.
Concise, and no-fluff analysis of the POL/USDC 4H chart
📈 Trend & Price Action
•Price has been in a clear downtrend from the peak at 0.2766, grinding down to a low of 0.1637.
•Recently it broke above the mid-range and is currently trading at 0.2001, showing a short-term bullish reversal attempt.
•Price just crossed above the middle Bollinger Band and is testing the upper band — suggesting buyers are stepping in aggressively here.
🪙 Volume
•Noticeable spike in volume on the current move up — this is healthy and confirms that buyers are serious.
•However, overall volume compared to the peak is moderate — suggests it might still be early accumulation and not full-blown breakout yet.
🔮 Indicators
•Bollinger Bands: Price pushing upper band with bands starting to expand — volatility returning. Bullish in short term but extended already.
•MACD: Positive crossover, but MACD is still near zero line — momentum is building but hasn’t exploded yet.
•Stochastic (K/D/J): Overbought territory (>79), which means some short-term cooling might happen soon before continuation.
📊 Levels to Watch
•Resistance: 0.2077, then 0.2326 (upper highs from previous range).
•Support: 0.1880 (middle Bollinger Band) & 0.1756 (lower support zone).
📝 Prediction & Plan
✅ Bias: Short-term bullish while above 0.1880. Medium trend still bearish until above 0.2326.
✅ Likely scenario: Price could test 0.2077, minor pullback if overbought conditions play out, then possible continuation towards 0.23 if volume sustains.
🚫 Caution: If price fails to hold above 0.1880, it could revisit 0.1756–0.16.
📌 Trade Idea
•Long entry: Around 0.190–0.195 if you catch a small dip.
•Target 1: 0.2077
•Target 2: 0.2326
•Stop loss: Below 0.1750
🔷 In short — momentum is improving, bulls are trying to reverse but it’s still early. Overbought indicators suggest you wait for a minor pullback before entering aggressively.