#NEAR🚀🚀🚀
#NEARUSDT
#ChartAnalysis #MarketPredictions
📊 NEARUSDT 4H Chart Analysis
🔻 Structure:
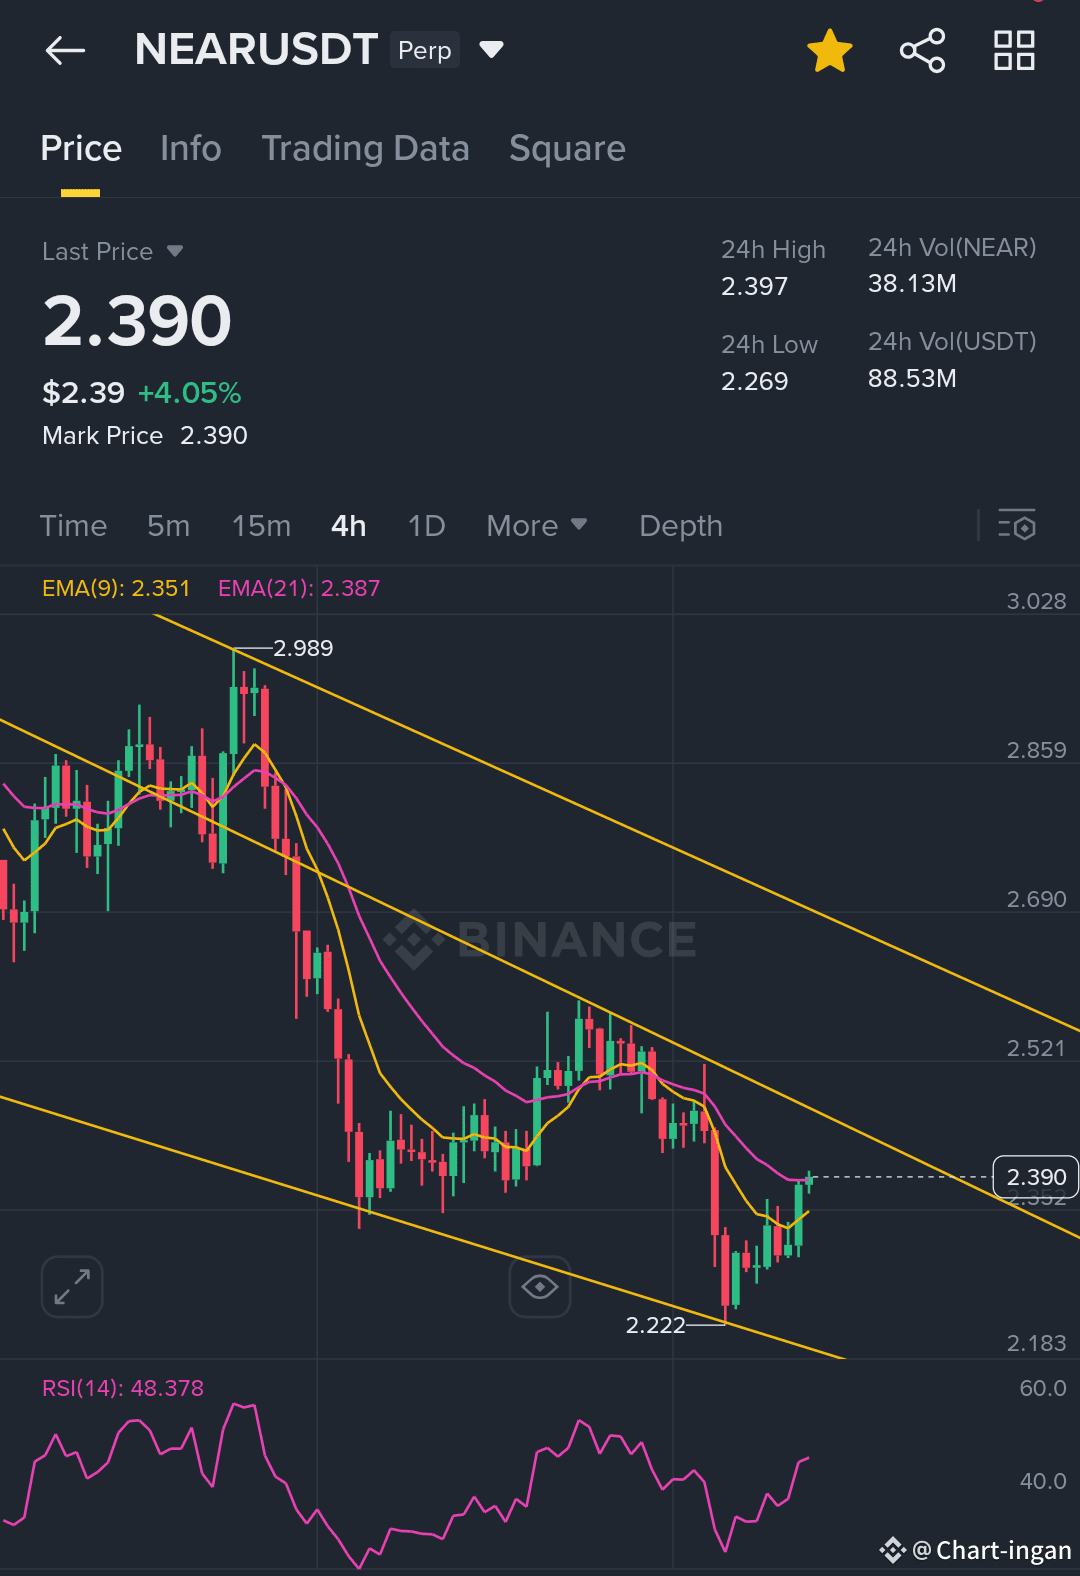
Descending channel active. Strong bounce from $2.22 support.
🔺 EMAs:
Price just moved above EMA-9 (2.35) and EMA-21 (2.38) — sign of momentum shift.
🔺 RSI (14):
At 48.3, recovering. Close to turning bullish (>50).
🔻 Immediate Resistance:
Upper channel + EMA zone at $2.40–$2.42.
🔺 Breakout Trigger:
A strong 4H close above $2.42 can open the path to $2.52–$2.69.
🔻 If Rejected:
Expect pullback to $2.30 or support at $2.22.
📈 Probabilities:
Bullish breakout: 65%
Bearish rejection: 35%
📍 Current bias:
Slightly bullish, but waiting for confirmation above $2.42.
#NEARUSDT
#ChartAnalysis #MarketPredictions
📊 NEARUSDT 4H Chart Analysis
🔻 Structure:
Descending channel active. Strong bounce from $2.22 support.
🔺 EMAs:
Price just moved above EMA-9 (2.35) and EMA-21 (2.38) — sign of momentum shift.
🔺 RSI (14):
At 48.3, recovering. Close to turning bullish (>50).
🔻 Immediate Resistance:
Upper channel + EMA zone at $2.40–$2.42.
🔺 Breakout Trigger:
A strong 4H close above $2.42 can open the path to $2.52–$2.69.
🔻 If Rejected:
Expect pullback to $2.30 or support at $2.22.
📈 Probabilities:
Bullish breakout: 65%
Bearish rejection: 35%
📍 Current bias:
Slightly bullish, but waiting for confirmation above $2.42.