


Hey Binance Square family! 👋
Let's delve into the latest developments surrounding The Graph (GRT) and explore what the charts are telling us.
---
📊 Current Market Snapshot
Current Price: $0.1089
24h Change: -0.031%
24h High / Low: $0.1146 / $0.1077
Market Cap: Approximately $1.07 billion
24h Trading Volume: Around $42.9 million
Circulating Supply: 9.85 billion GRT
GRT is currently trading about 96% below its all-time high of $2.88, reached in February 2021.
---
🔍 Technical Analysis Overview
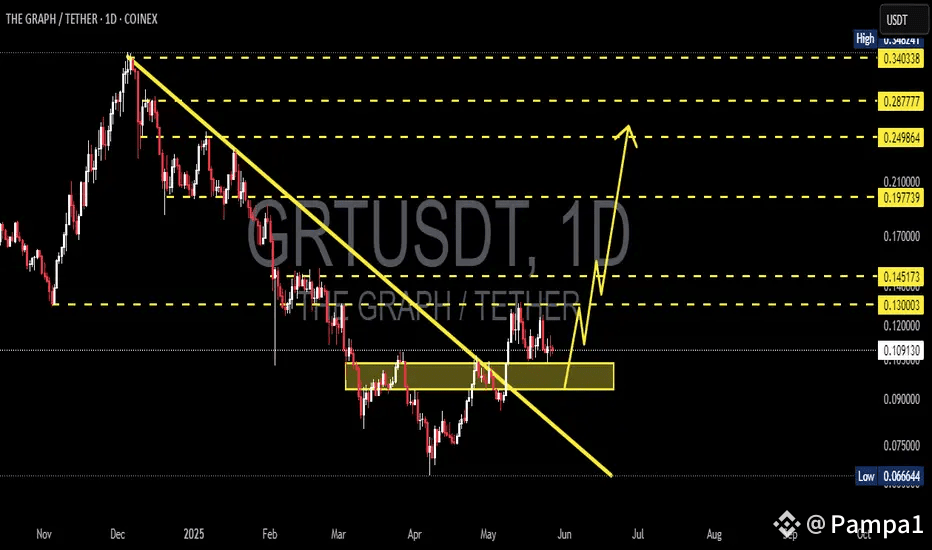
Recent analysis on the daily chart indicates that selling pressure has subsided, and GRT is finding support around the $0.108 level.
Support Zone: $0.108 – $0.110
Resistance Levels: $0.125 and $0.135
The price action suggests a potential for a short-term upward move, especially if GRT can maintain support above $0.108.
---
📈 Technical Indicators
Moving Averages: Short-term moving averages are showing bullish signals, indicating potential upward momentum.
RSI (14): Currently neutral, suggesting room for upward movement without being overbought.
MACD: The MACD line is approaching the signal line from below, which could indicate a bullish crossover if the trend continues.
---
📰 Market Sentiment
The Graph's recent price action has caught the attention of traders, with discussions focusing on its potential for a bullish reversal. The increase in trading volume and stabilization around key support levels contribute to a cautiously optimistic outlook.
---
📌 Final Thoughts
While GRT has experienced significant declines from its all-time high, the current technical setup suggests a potential for a short-term rebound. Traders should monitor key support and resistance levels and watch for confirmation of bullish signals before entering positions.
Happy trading! 📈💰
---
*Disclaimer: This article is for informational purposes only and does not constitute financial advice. Always conduct your own research before making investment decisions.*