


$BTC Okay, let's analyze the BTC/USDT chart 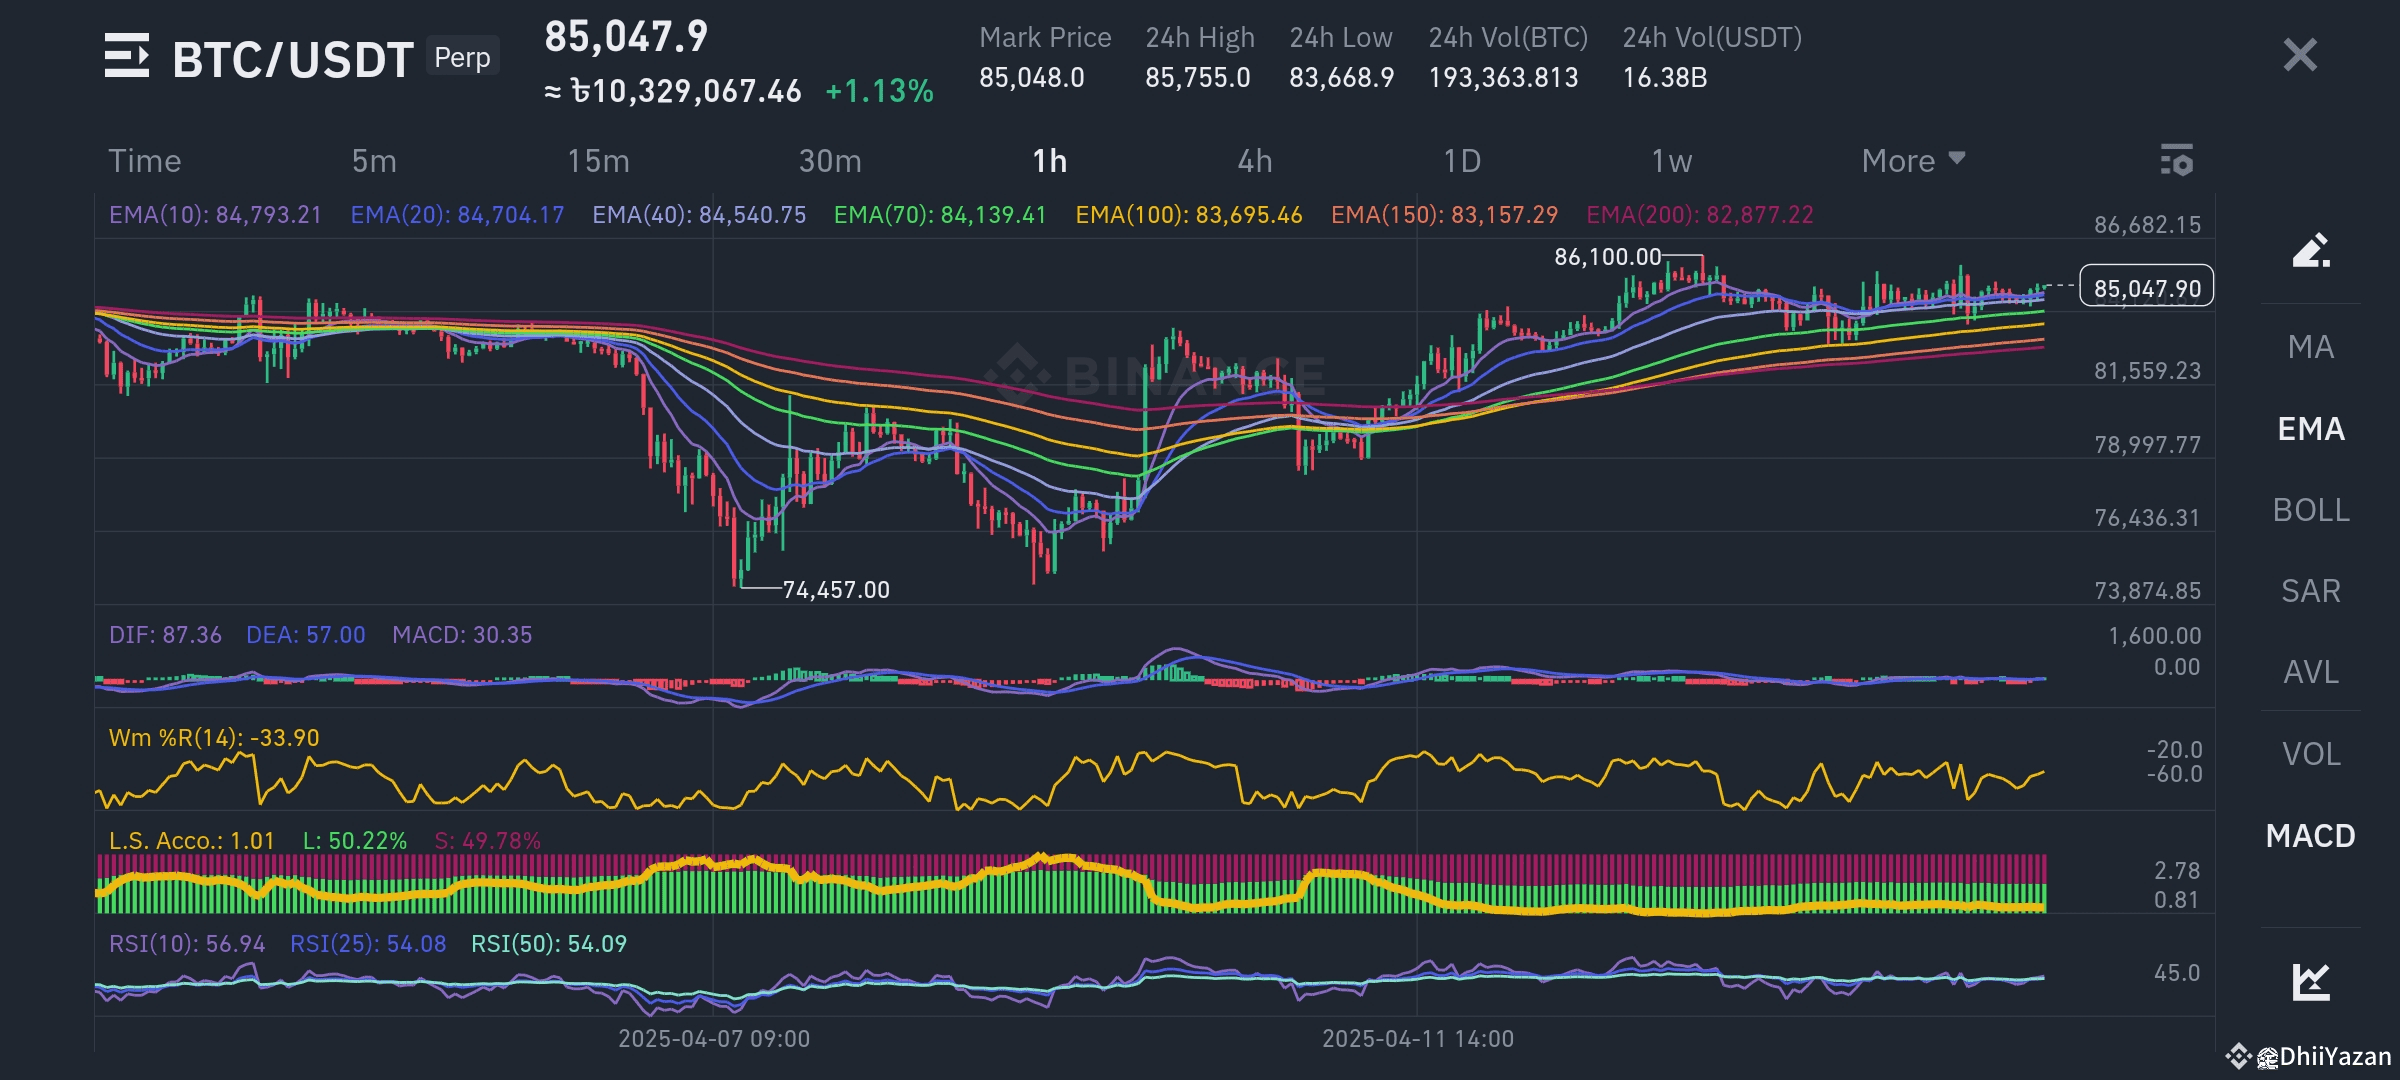 to identify potential support and resistance levels. This chart appears to be on a 1-hour timeframe.
Resistance Levels:
* Around 86,100: This is a clear recent high point on the chart where the price was strongly rejected. This level is likely to act as significant resistance.
* Around the 24h High of 85,755.0: The price reached this level recently and pulled back, indicating it's a short-term resistance.
* Potentially around the current price of 85,047.9: If the price struggles to move higher from this point, it could act as immediate minor resistance.
Support Levels:
* Around the 24h Low of 83,668.9: This is the lowest point reached in the last 24 hours and represents a key short-term support level.
* Around 81,559: This level appears to have acted as support in the past, with the price bouncing up from this area.
* Around 79,997.77: This level also shows signs of previous support, where the price found buying interest.
* Further down, around 76,436.31 and 73,876.85: These levels represent lower potential support zones based on past price action visible on the chart.
Visual Representation (Conceptual):
Imagine horizontal lines drawn at these price levels. When the price approaches these lines:
* Resistance: It might struggle to go above it and could potentially reverse downwards.
* Support: It might struggle to go below it and could potentially bounce upwards.
Important Considerations:
* These are approximate zones: Support and resistance levels are not always precise price points but rather areas where buying or selling pressure tends to increase.
* Timeframe Specific: These levels are identified on an approximate 1-hour chart. Support and resistance levels can vary significantly depending on the timeframe you are analyzing.
* Market Context: The strength of these levels can be influenced by overall market sentiment, news events, and trading volume.
* Breakouts: If the price decisively breaks above a resistance level, that level can then potentially act as support, and vice versa.
In summary, based on the provided BTC/USDT chart:
* Potential Resistance: ≈ 86,100, ≈ 85,755, ≈ 85,048 (current level)
* Potential Support: ≈ 83,669, ≈ 81,559, ≈ 79,998, ≈ 76,436, ≈ 73,877
Remember to use these levels as part of your broader analysis and consider other technical indicators and fundamental factors when making trading decisions.