


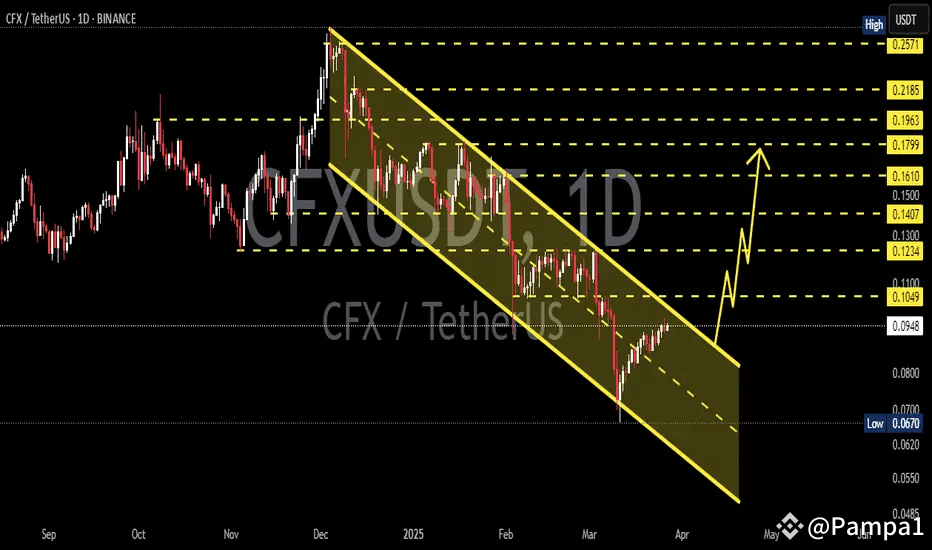
CFX/USDT (Conflux Network) – 1D Chart Analysis
CFX is showing strong potential as it approaches a key resistance level. A successful breakout above this resistance could trigger a significant price surge, making it an attractive buying opportunity.
🔍 Current Market Overview
Timeframe: 1D (Daily Chart)
Key Resistance Level: $0.245 - 0.250 zone
Support Level: Around $0.210
CFX is currently consolidating just below a critical resistance. The price action has been forming higher lows, suggesting increasing buying pressure and a possible bullish breakout soon.
📊 Technical Analysis Highlights
✅ Trend Confirmation:
CFX is respecting the ascending trendline and moving closer to the resistance zone.
RSI is hovering above 50, indicating bullish momentum.
Volume is gradually increasing, signaling growing interest from buyers.
✅ Entry Strategy:
Ideal Entry: Buy gradually once CFX breaks and closes above the resistance level of $0.250 on the daily timeframe.
Confirmation: Look for volume confirmation and a successful retest before committing to the position.
🎯 Target Levels:
✅ 1st Target: $0.275 (+10%)
✅ 2nd Target: $0.298 (+20%)
✅ 3rd Target: $0.320 (+30%)
🛑 Stop Loss:
To manage risk, place a stop-loss below the breakout point, ideally around $0.225.
⚡️ Why CFX Looks Promising?
Strong Support Zone: The price has bounced multiple times from the $0.210 level, strengthening the support.
Market Sentiment: Positive sentiment in the altcoin market could fuel a quick move upward once resistance is breached.
🚨 Risk Management Reminder
As always, ensure proper risk management by allocating a manageable portion of your portfolio to this trade. Breakouts can be volatile, so it's essential to monitor price action closely.
💬 What’s your take on this breakout setup? Are you ready to ride the wave if CFX takes off? Share your thoughts in the comments below!