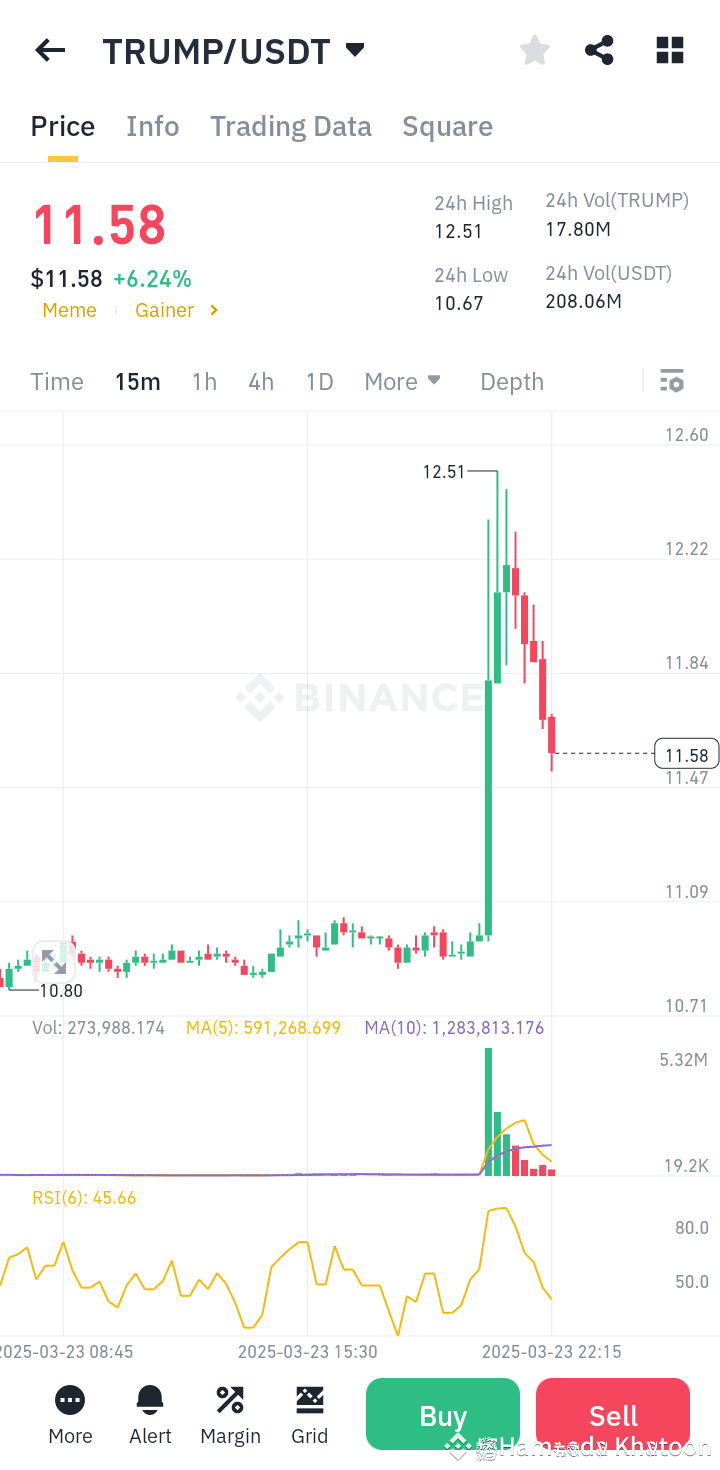
🔥 Trump Coin (TRUMP/USDT) Technical Analysis – Binance 🔥
🔹 Current Price: $11.58 (+6.24%)
🔹 24H High: $12.51
🔹 24H Low: $10.67
🔹 24H Volume: 17.80M TRUMP / 208.06M USDT
📊 Key Technical Insights
1️⃣ Strong Pump Followed by a Dump 📈📉
TRUMP coin saw a massive spike from $10.80 to $12.51 but quickly retraced.
The price failed to hold above $12.00, indicating strong sell pressure at the top.
Currently sitting at $11.58, forming lower highs, signaling potential further correction.
2️⃣ RSI Shows Overbought & Cool Down 🔥➡️❄️
RSI peaked above 80, showing overbought conditions before dropping to 45.66.
This suggests a cooling-off phase, and further downside is possible.
3️⃣ Moving Averages – Bearish Cross Incoming? 🚨
MA(5) = 591,268.699 (Short-term support)
MA(10) = 1,283,813.176 (Potential resistance)
If MA(5) crosses below MA(10), expect further downside pressure.
4️⃣ Volume Surge Then Drop – Caution! 🧐
Biggest volume spike occurred at the top ($12.51), followed by decreasing volume on the dip.
This suggests whales might have taken profits, leaving retail traders holding bags.
⚡ Possible Scenarios & Trade Strategy
✅ Bullish Case – If TRUMP Breaks Above $12.00 Again
Needs high volume push past $12.00-$12.50 to reclaim bullish momentum.
If it breaks $12.50, next target could be $13.00+.
❌ Bearish Case – If TRUMP Drops Below $11.50
Breaking $11.50 could lead to a deeper retrace towards $11.00 or even $10.67 (24H Low).
Best entry for longs would be around $10.80-$11.00 if support holds.
🚀 Ideal Trade:
Entry: Buy above $12.00 or near $10.80 support.
Target: $13.00+ if bullish, or $10.67 if bearish.
Stop-loss: Below $10.50.
#BinanceAlphaAlert #BNBChainMeme #VoteToDelistOnBinance $BTC
🔹 Current Price: $11.58 (+6.24%)
🔹 24H High: $12.51
🔹 24H Low: $10.67
🔹 24H Volume: 17.80M TRUMP / 208.06M USDT
📊 Key Technical Insights
1️⃣ Strong Pump Followed by a Dump 📈📉
TRUMP coin saw a massive spike from $10.80 to $12.51 but quickly retraced.
The price failed to hold above $12.00, indicating strong sell pressure at the top.
Currently sitting at $11.58, forming lower highs, signaling potential further correction.
2️⃣ RSI Shows Overbought & Cool Down 🔥➡️❄️
RSI peaked above 80, showing overbought conditions before dropping to 45.66.
This suggests a cooling-off phase, and further downside is possible.
3️⃣ Moving Averages – Bearish Cross Incoming? 🚨
MA(5) = 591,268.699 (Short-term support)
MA(10) = 1,283,813.176 (Potential resistance)
If MA(5) crosses below MA(10), expect further downside pressure.
4️⃣ Volume Surge Then Drop – Caution! 🧐
Biggest volume spike occurred at the top ($12.51), followed by decreasing volume on the dip.
This suggests whales might have taken profits, leaving retail traders holding bags.
⚡ Possible Scenarios & Trade Strategy
✅ Bullish Case – If TRUMP Breaks Above $12.00 Again
Needs high volume push past $12.00-$12.50 to reclaim bullish momentum.
If it breaks $12.50, next target could be $13.00+.
❌ Bearish Case – If TRUMP Drops Below $11.50
Breaking $11.50 could lead to a deeper retrace towards $11.00 or even $10.67 (24H Low).
Best entry for longs would be around $10.80-$11.00 if support holds.
🚀 Ideal Trade:
Entry: Buy above $12.00 or near $10.80 support.
Target: $13.00+ if bullish, or $10.67 if bearish.
Stop-loss: Below $10.50.
#BinanceAlphaAlert #BNBChainMeme #VoteToDelistOnBinance $BTC