
Bitcoin Weekly Chart Update! 🚀
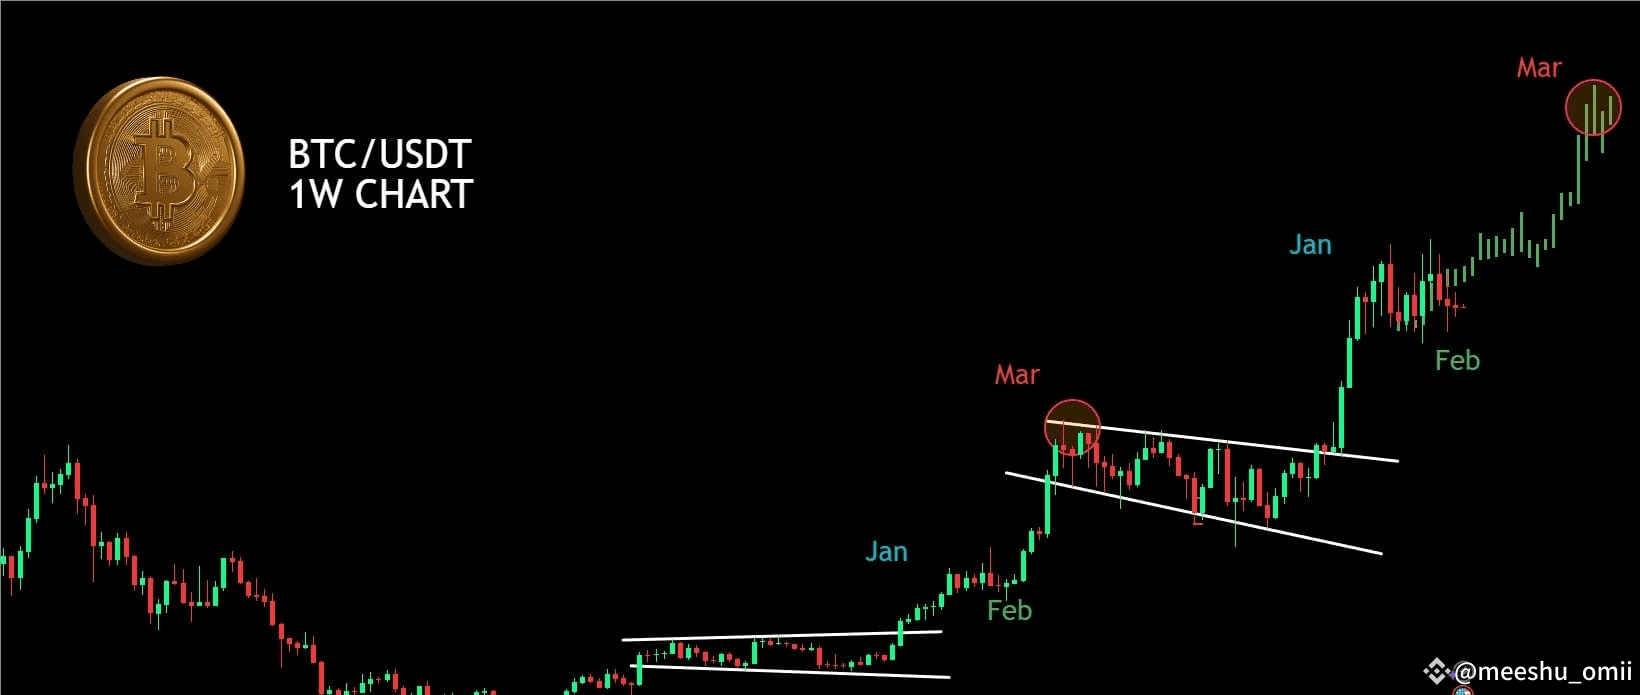
The $BTC /USDT weekly chart continues to show a familiar breakout pattern following consolidation. Here’s the latest:
🔹 January: A breakout from a falling wedge pattern—typically a strong bullish signal. 📊
🔹 February: Momentum remained strong, driving BTC to new highs. 🚀
🔹 March: BTC nears a critical resistance zone around $140K—will we see a breakout to new ATHs or a pullback first? 🤔
With the ongoing breakout–consolidation–rally cycle, history may repeat itself, but volatility remains a key factor at these levels. ⚠️
What’s your BTC outlook for March—new ATH or a correction before the next leg up? Share your thoughts! 👇
#Write2Earn #BNBChainMeme $BTC
The $BTC /USDT weekly chart continues to show a familiar breakout pattern following consolidation. Here’s the latest:
🔹 January: A breakout from a falling wedge pattern—typically a strong bullish signal. 📊
🔹 February: Momentum remained strong, driving BTC to new highs. 🚀
🔹 March: BTC nears a critical resistance zone around $140K—will we see a breakout to new ATHs or a pullback first? 🤔
With the ongoing breakout–consolidation–rally cycle, history may repeat itself, but volatility remains a key factor at these levels. ⚠️
What’s your BTC outlook for March—new ATH or a correction before the next leg up? Share your thoughts! 👇
#Write2Earn #BNBChainMeme $BTC