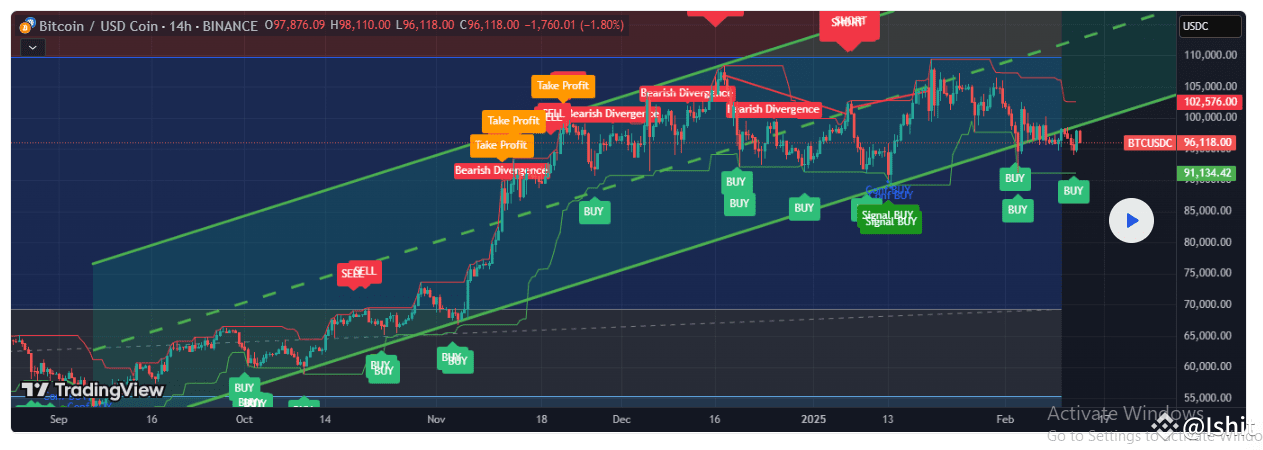
📊 Bitcoin (BTC/USDC) – 14H Indicator Analysis! 🚀
#bitcoin #Btcusdc #BTC #BTCUSDT. #Write2Earn
$USDC
📌 Current
BTC Price : $96,118 (-1.80%)
📈 High : $98,876 |
📉 Low : $96,118
💰 Key Support Levels : $91,134 | $85,000
🚨 Resistance Levels : $102,576 | $110,000
🔍 Market Overview : Bullish & Bearish Signals!
✅ Buy Signals Spotted – Strong green buy zones confirm accumulation phases.
✅ Bearish Divergence Alerts – Momentum slowing near $102K-$105K range.
✅ Take Profit Zones – Ideal sell points near $102K-$110K.
✅ Trend Channel Intact – BTC is still respecting the uptrend channel, but showing weakness near resistance.
📊 14H Indicator Insights : Why It Works?
🔹 More Accurate Than Daytime Charts – Reduces noise & false signals.
🔹 Three Key Timeframes – Enhances trend visibility for strategic trades.
🔹 Buy & Sell Confirmation – BTC remains in a macro uptrend but is losing steam at resistance.
⚠️ What’s Next for BTC?
🔻 If $91K support breaks, expect a potential dip to $85K.
🚀 If BTC reclaims $102K, a push to $110K is likely.
📉 Bearish Divergences suggest a cooldown before next major rally.
💡 Pro-Tip for Traders!
✅ Set stop-loss below $91K to protect profits.
✅ Accumulate near strong buy zones ($91K-$85K) for a better entry.
✅ Watch for breakout confirmation above $102K before going long.
🔮 Conclusion & Investor Advice :
BTC remains in an uptrend, but short-term weakness is evident. The 14H timeframe provides more reliable trade signals, balancing entry precision & risk management. Stay cautious, follow the trend, and trade smart! 💎🚀
#bitcoin #Btcusdc #BTC #BTCUSDT. #Write2Earn
$USDC
📌 Current
BTC Price : $96,118 (-1.80%)
📈 High : $98,876 |
📉 Low : $96,118
💰 Key Support Levels : $91,134 | $85,000
🚨 Resistance Levels : $102,576 | $110,000
🔍 Market Overview : Bullish & Bearish Signals!
✅ Buy Signals Spotted – Strong green buy zones confirm accumulation phases.
✅ Bearish Divergence Alerts – Momentum slowing near $102K-$105K range.
✅ Take Profit Zones – Ideal sell points near $102K-$110K.
✅ Trend Channel Intact – BTC is still respecting the uptrend channel, but showing weakness near resistance.
📊 14H Indicator Insights : Why It Works?
🔹 More Accurate Than Daytime Charts – Reduces noise & false signals.
🔹 Three Key Timeframes – Enhances trend visibility for strategic trades.
🔹 Buy & Sell Confirmation – BTC remains in a macro uptrend but is losing steam at resistance.
⚠️ What’s Next for BTC?
🔻 If $91K support breaks, expect a potential dip to $85K.
🚀 If BTC reclaims $102K, a push to $110K is likely.
📉 Bearish Divergences suggest a cooldown before next major rally.
💡 Pro-Tip for Traders!
✅ Set stop-loss below $91K to protect profits.
✅ Accumulate near strong buy zones ($91K-$85K) for a better entry.
✅ Watch for breakout confirmation above $102K before going long.
🔮 Conclusion & Investor Advice :
BTC remains in an uptrend, but short-term weakness is evident. The 14H timeframe provides more reliable trade signals, balancing entry precision & risk management. Stay cautious, follow the trend, and trade smart! 💎🚀