$TRUMP Next Moves:
Short-Term Outlook:
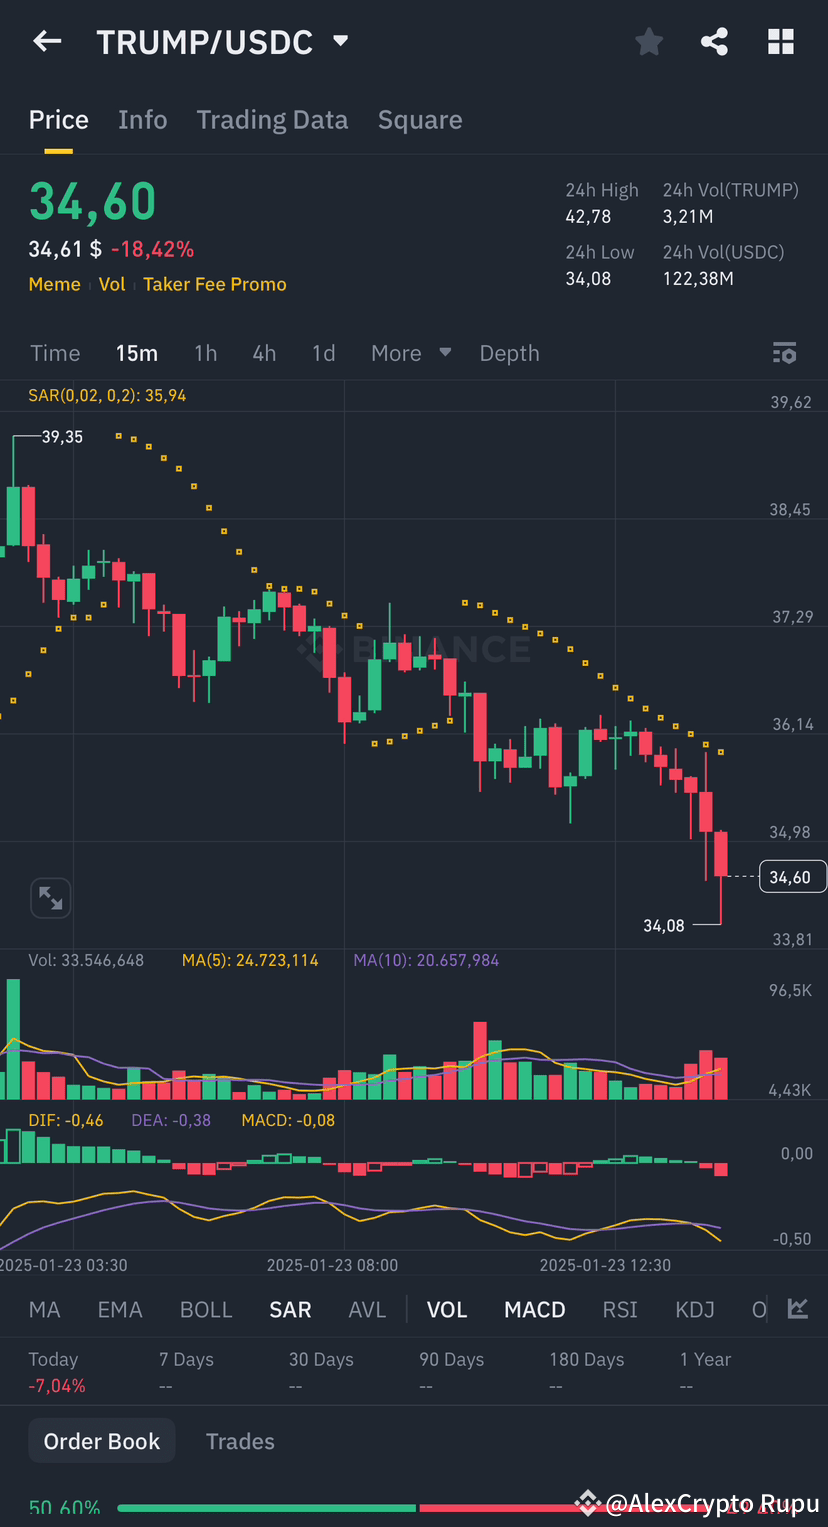
The chart shows no clear signs of reversal yet. The downtrend remains intact as indicated by the Parabolic SAR and MACD.
Watch closely if 34.08 holds. A strong bounce with increased buying volume could suggest a potential recovery.
Potential Scenarios:
If 34.08 Breaks: The price could fall to the next psychological level (e.g., 33.00 or lower).
If 34.08 Holds: Look for a green candle with strong buying volume and signs of reversal in MACD or Parabolic SAR to confirm an upward move.
Should You Buy Now?
Not Yet. It is safer to wait for confirmation of a reversal (e.g., a bullish MACD crossover, Parabolic SAR flipping below candles, or higher lows forming).
If you want to take a risk, enter near the support level of 34.08 with a tight stop-loss below this level (e.g., 33.80) to limit potential losses.
Indicators:
Parabolic SAR: Dots are still above the candles, confirming the ongoing downtrend.
MACD: The MACD line and the signal line are both negative, and the histogram shows increasing bearish momentum.
Volume: There’s an increase in volume during the downward move, indicating strong selling pressure.
Support Levels:
The current support level is 34.08 (the 24-hour low). If this level breaks, the price could drop further.
If the support holds, there could be a short-term bounce.
Resistance Levels:
Immediate resistance is around 35.94, which aligns with the previous consolidation zone.
For more information, follow & like me thank you
Short-Term Outlook:
The chart shows no clear signs of reversal yet. The downtrend remains intact as indicated by the Parabolic SAR and MACD.
Watch closely if 34.08 holds. A strong bounce with increased buying volume could suggest a potential recovery.
Potential Scenarios:
If 34.08 Breaks: The price could fall to the next psychological level (e.g., 33.00 or lower).
If 34.08 Holds: Look for a green candle with strong buying volume and signs of reversal in MACD or Parabolic SAR to confirm an upward move.
Should You Buy Now?
Not Yet. It is safer to wait for confirmation of a reversal (e.g., a bullish MACD crossover, Parabolic SAR flipping below candles, or higher lows forming).
If you want to take a risk, enter near the support level of 34.08 with a tight stop-loss below this level (e.g., 33.80) to limit potential losses.
Indicators:
Parabolic SAR: Dots are still above the candles, confirming the ongoing downtrend.
MACD: The MACD line and the signal line are both negative, and the histogram shows increasing bearish momentum.
Volume: There’s an increase in volume during the downward move, indicating strong selling pressure.
Support Levels:
The current support level is 34.08 (the 24-hour low). If this level breaks, the price could drop further.
If the support holds, there could be a short-term bounce.
Resistance Levels:
Immediate resistance is around 35.94, which aligns with the previous consolidation zone.
For more information, follow & like me thank you