




BTC
82,187.69
-1.12%
BTCUSDT
Perp
82,130.7
-1.22%
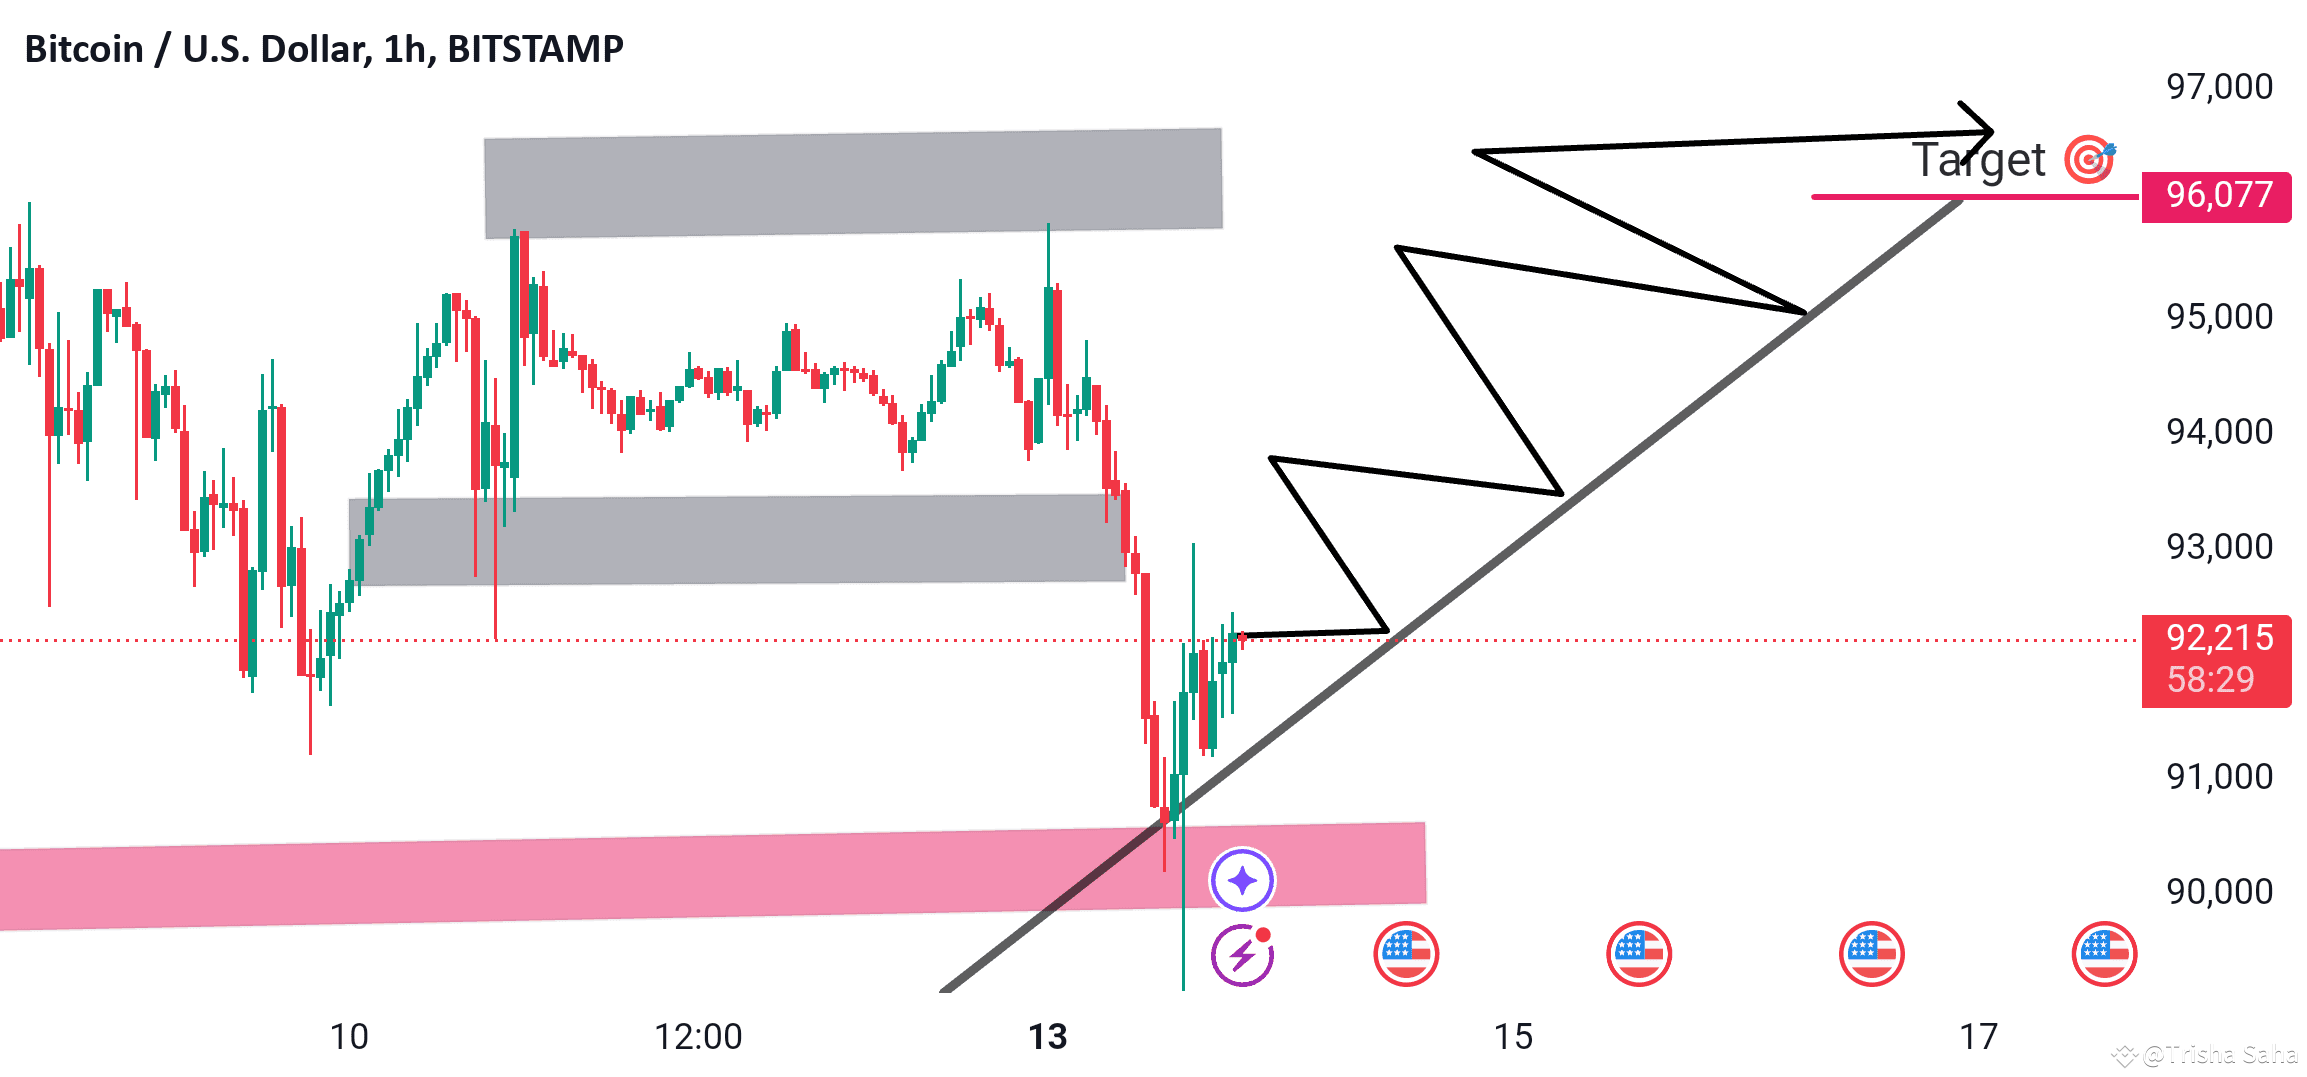
BTC/USD technical analysis highlights key market.
1. Support and Resistance Levels:
The resistance zone, shaded in gray, marks a potential area of selling pressure where the price may struggle to break higher.
The support zone, shaded in pink, indicates a level where buying interest is expected to stabilize the price.
2. Trend Analysis:
The upward-sloping trend line reflects a bullish market sentiment, suggesting a continuation of the upward price movement.
3. Price Projection:
The chart outlines a potential price trajectory with a target at 96,077, signifying the next significant resistance level.
#DollarRally110 #CryptoETFNextWave #AltcoinBoom #GuessBTCsBottom #10DaysToTrump