


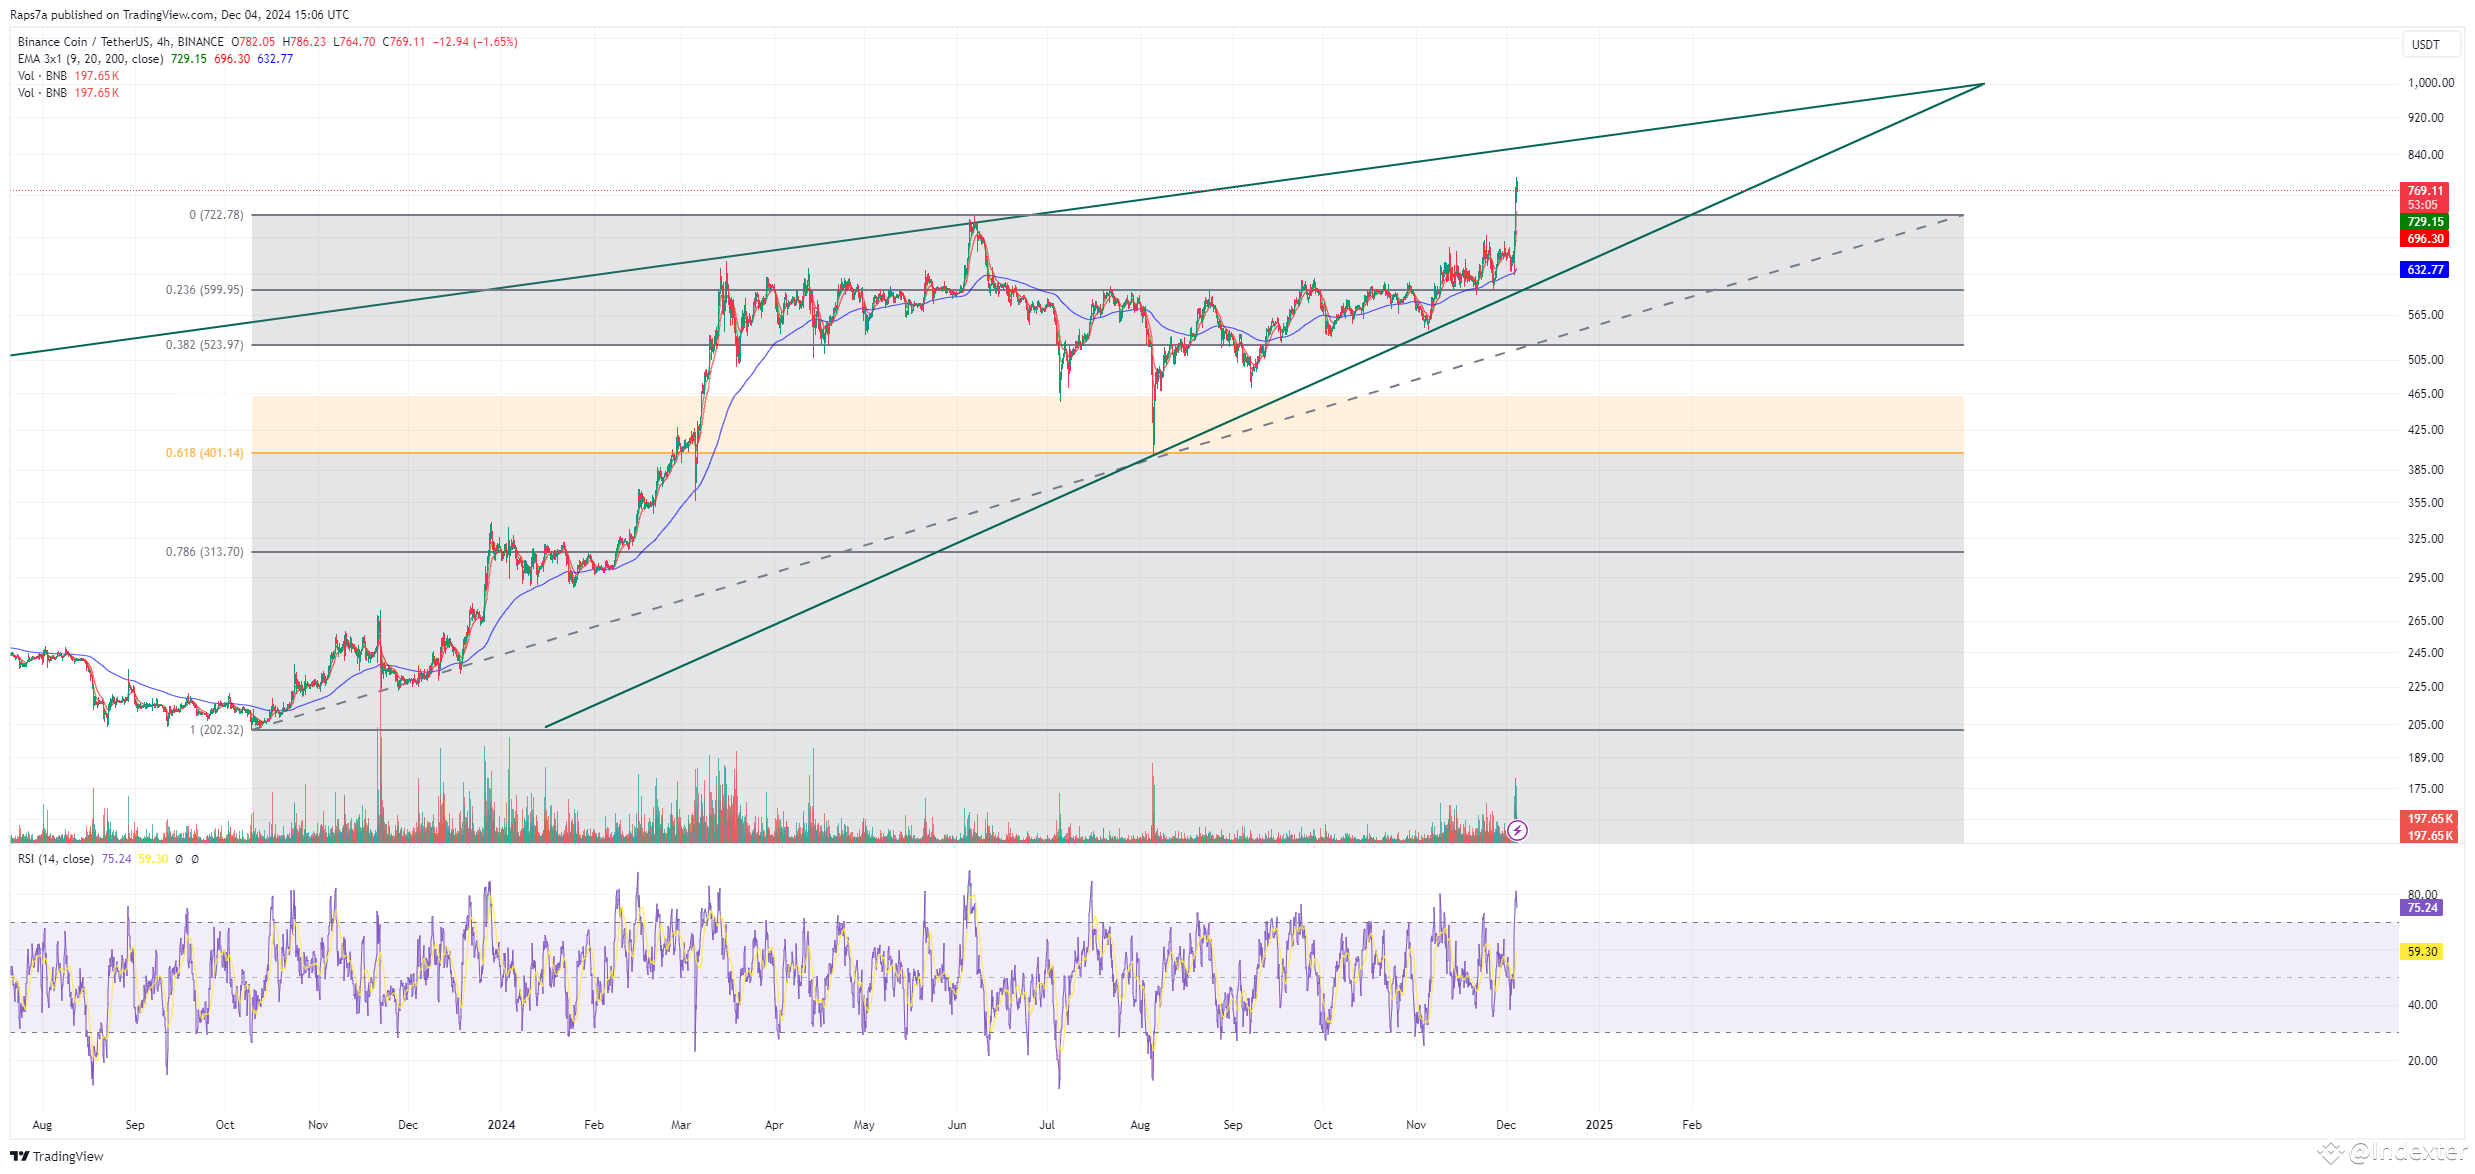
Binance Coin (BNB/USDT) 4-Hour Chart
Binance Coin (BNB) is showing strong bullish momentum, trading within a well-defined ascending wedge pattern. Despite this being a typically bearish structure, the current market dynamics suggest that BNB has the potential to break higher, targeting the $999.95 level in the coming sessions. Here’s a detailed look at why BNB might be headed for this significant psychological and technical milestone.

1. Ascending Wedge and Price Momentum
BNB is currently trading near the upper boundary of an ascending wedge pattern, a key resistance level around $759.49. This level has been tested multiple times, indicating that a breakout is becoming increasingly likely. If the price breaks above this wedge with strong volume, the next target aligns with the Fibonacci 0.236 retracement level at $999.95.
The wedge formation also shows a strong upward bias, supported by the consistent higher lows and the ongoing uptrend, suggesting that bullish momentum remains intact.
2. Fibonacci Levels Indicating Key Targets
Fibonacci retracement levels provide critical insights into BNB’s potential price trajectory:
Immediate Resistance: $759.49, near the top of the wedge.
Key Target: $999.95, the 0.236 Fibonacci level, which aligns with psychological resistance. A breakout above $759.49 could lead to a sharp rally toward this level.
Support Levels: If a pullback occurs, strong support is present at $696.16 (20 EMA) and $401.14 (0.618 Fibonacci retracement), ensuring stability even in case of a correction.
3. Moving Averages Supporting Bullish Momentum
BNB is currently trading well above its 9, 20, and 200 EMAs, confirming a strong bullish trend. The 20 EMA at $696.16 is acting as a dynamic support level, helping sustain the ongoing rally. Long-term trends remain bullish as long as the price stays above these key EMAs.
4. RSI Signals Overbought Conditions
The Relative Strength Index (RSI) at 74.58 has entered the overbought zone, indicating strong buying pressure. While this suggests a potential short-term pullback or consolidation, it also highlights the strength of the ongoing rally. A consolidation phase near current levels could give BNB the momentum to break past $759.49 and aim for $999.95.
5. Volume Analysis: Breakout Confirmation
Recent volume spikes show that buyers are stepping in, supporting the current upward move. For BNB to reach $999.95, sustained or increasing volume will be crucial. A breakout above $759.49 accompanied by strong volume would validate the bullish case.
Potential Scenarios
Bullish Breakout:
If BNB breaks above $759.49 with volume, it could target $999.95, aligning with the 0.236 Fibonacci level and psychological resistance.Support Bounce:
A pullback to $696.16 (20 EMA) or $401.14 (0.618 Fibonacci) could attract buyers, offering another opportunity for the price to surge.Bearish Risk:
Failure to sustain above the ascending wedge and a breakdown below $696.16 could lead to a deeper correction, but strong support at $401.14 would likely limit losses.
Conclusion: BNB Eyes $999.95
BNB’s technical setup is undeniably bullish, supported by key Fibonacci levels, strong moving averages, and rising volume. While the overbought RSI signals a potential short-term pause, a breakout above $759.49 could drive the price toward $999.95, a critical psychological and technical target.
As BNB continues to demonstrate strength, traders and investors should watch for confirmation of the breakout, while keeping an eye on support levels in case of a pullback.
$BTC $ETH
#BNB #BinanceCoin #CryptoAnalysis #BNBUSDT #TechnicalAnalysis #Altcoins #CryptoTrading #Binance