---$REZ

REZ/USDT Analysis: Potential Breakout Setup
We’re closely watching the REZ/USDT pair as it approaches a critical setup with strong support and resistance zones defining a range-bound movement. This kind of setup often provides valuable insights into future price action, especially if we see a breakout or breakdown from these key levels. Let’s break down the technicals and potential trading opportunities here.
Chart Overview
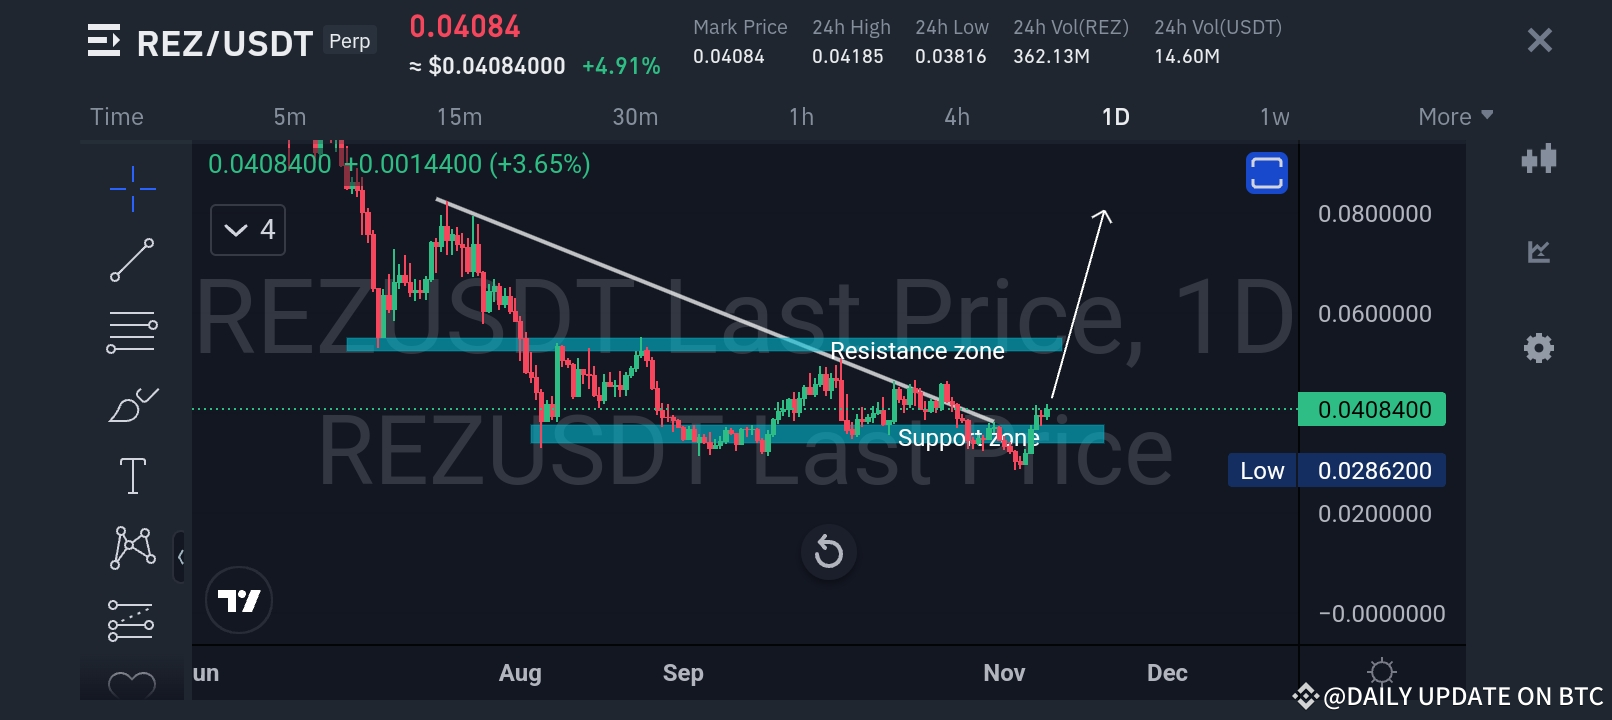
In the provided chart, we see REZ/USDT moving within a well-defined Support Zone and Resistance Zone:
Support Zone: Around the 0.0286 level, where buyers have repeatedly stepped in to prevent further downside.
Resistance Zone: Around the 0.0460 level, a price ceiling that has held strong against previous rallies.
The price has recently bounced off the support zone and appears to be trending upward, which could signal an upcoming test of the resistance.
Technical Analysis
1. Support Zone Test: The price has shown resilience at the support level, making this area critical for buyers. Holding above this zone indicates buyer strength and a potential for reversal if momentum builds.
2. Resistance Zone Test: As REZ/USDT approaches the resistance zone, this area will be pivotal. A breakout above this level, especially with high volume, could signal a strong bullish move and open the door to higher price targets.
3. Descending Resistance Line: The chart shows a downward sloping resistance line that has acted as a barrier to upward price movements. Breaking through this line, along with the resistance zone, would be a bullish signal indicating that the downward pressure may be ending.
4. Volume Observation: Monitoring volume during these moves is key. An increase in volume as the price approaches the resistance line would signal buying interest, increasing the likelihood of a successful breakout.
Potential Scenarios
Bullish Breakout: If the price breaks above the descending resistance line and the resistance zone, it could lead to a strong bullish rally. This move would likely attract more buyers, pushing the price to test higher levels. The next target could be around 0.0600, but traders should watch for volume to confirm this breakout.
Bearish Rejection: If the price fails to break the resistance and faces rejection, we could see a return to the support zone. This would keep REZ/USDT in its range-bound structure, making it an opportunity for range traders to capitalize on the bounce between support and resistance.
Trade Setup and Risk Management
For Long Entries: Wait for a breakout above the resistance zone with a daily close and volume confirmation. Set a stop loss slightly below the breakout level to manage risk in case of a false breakout.
For Short Entries: If the price fails to break above the resistance and shows signs of reversal, consider shorting with a target back to the support zone. Use a stop loss above the resistance zone to protect against unexpected moves.
Key Takeaways for Traders
1. Patience and Confirmation: Wait for confirmation of a breakout or breakdown before entering a position. This will reduce the risk of getting caught in false moves.
2. Volume is Crucial: A strong breakout with low volume may not sustain, while a breakout with high volume indicates significant buying interest.
3. Risk Management: Always have a stop loss in place to protect capital, especially when trading around key levels where reversals are possible.
Conclusion
REZ/USDT is at a key inflection point, with clear levels of support and resistance guiding potential moves. This setup is favorable for both breakout traders and range traders, depending on whether the price breaks the resistance or stays range-bound. As always, patience and disciplined execution are essential.
Stay tuned for updates, and watch these levels closely. Let’s see how REZ/USDT reacts in the coming days!
---