
#xec
xec
1.4M vues
3,442 mentions
Populaire
Récents


Article
Voir la traduction
What is XEC !?🤔Well !
According to #Binance info page.
Built by an experienced team of bitcoin developers who founded Bitcoin Cash, eCash is a fork of bitcoin with a more aggressive technical roadmap.
Guided by the academic vision of Milton Friedman, eCash aims to deliver on key blockchain scaling promises. An innovative Avalanche consensus layer and its own token layer are unique technical highlights of eCash. eCash also aims to introduce features never before seen in a Bitcoin project such as staking, fork-free network upgrades, and subchains.
XEC is the native token of the eCash network and has the following use cases.
- Token minting: XEC holders can mint tokens with a custom name, supply, decimal places, and icon via the eCash platform. Users will need to pay for network transaction fees in XEC tokens. The eToken protocol also supports NFTs.
- Staking: XEC token holders will be able to participate in Avalanche Staking, which will be a part of eCash governance.
🤔🙄After this acknowledgment of the $XEC
{spot}(XECUSDT)
I see its a good utility token to invest in. With growing development with a well experienced developers. It make it a reliable token to invest in for long term gains .
Use my given link on page for purchase or convert to #XEC , if you wish to support @Square-Creator-Babadola
#InvestWise 👌🥰
#writetoearn
What is XEC !?🤔
Well !
According to #Binance info page.
Built by an experienced team of bitcoin developers who founded Bitcoin Cash, eCash is a fork of bitcoin with a more aggressive technical roadmap.
Guided by the academic vision of Milton Friedman, eCash aims to deliver on key blockchain scaling promises. An innovative Avalanche consensus layer and its own token layer are unique technical highlights of eCash. eCash also aims to introduce features never before seen in a Bitcoin project such as staking, fork-free network upgrades, and subchains.
XEC is the native token of the eCash network and has the following use cases.
- Token minting: XEC holders can mint tokens with a custom name, supply, decimal places, and icon via the eCash platform. Users will need to pay for network transaction fees in XEC tokens. The eToken protocol also supports NFTs.
- Staking: XEC token holders will be able to participate in Avalanche Staking, which will be a part of eCash governance.
🤔🙄After this acknowledgment of the $XEC
I see its a good utility token to invest in. With growing development with a well experienced developers. It make it a reliable token to invest in for long term gains .
Use my given link on page for purchase or convert to #XEC , if you wish to support @Babadola Cryptology
#InvestWise 👌🥰
#writetoearn
According to #Binance info page.
Built by an experienced team of bitcoin developers who founded Bitcoin Cash, eCash is a fork of bitcoin with a more aggressive technical roadmap.
Guided by the academic vision of Milton Friedman, eCash aims to deliver on key blockchain scaling promises. An innovative Avalanche consensus layer and its own token layer are unique technical highlights of eCash. eCash also aims to introduce features never before seen in a Bitcoin project such as staking, fork-free network upgrades, and subchains.
XEC is the native token of the eCash network and has the following use cases.
- Token minting: XEC holders can mint tokens with a custom name, supply, decimal places, and icon via the eCash platform. Users will need to pay for network transaction fees in XEC tokens. The eToken protocol also supports NFTs.
- Staking: XEC token holders will be able to participate in Avalanche Staking, which will be a part of eCash governance.
🤔🙄After this acknowledgment of the $XEC
I see its a good utility token to invest in. With growing development with a well experienced developers. It make it a reliable token to invest in for long term gains .
Use my given link on page for purchase or convert to #XEC , if you wish to support @Babadola Cryptology
#InvestWise 👌🥰
#writetoearn
228


·
--
Haussier
$XEC ... L’élan haussier se renforce
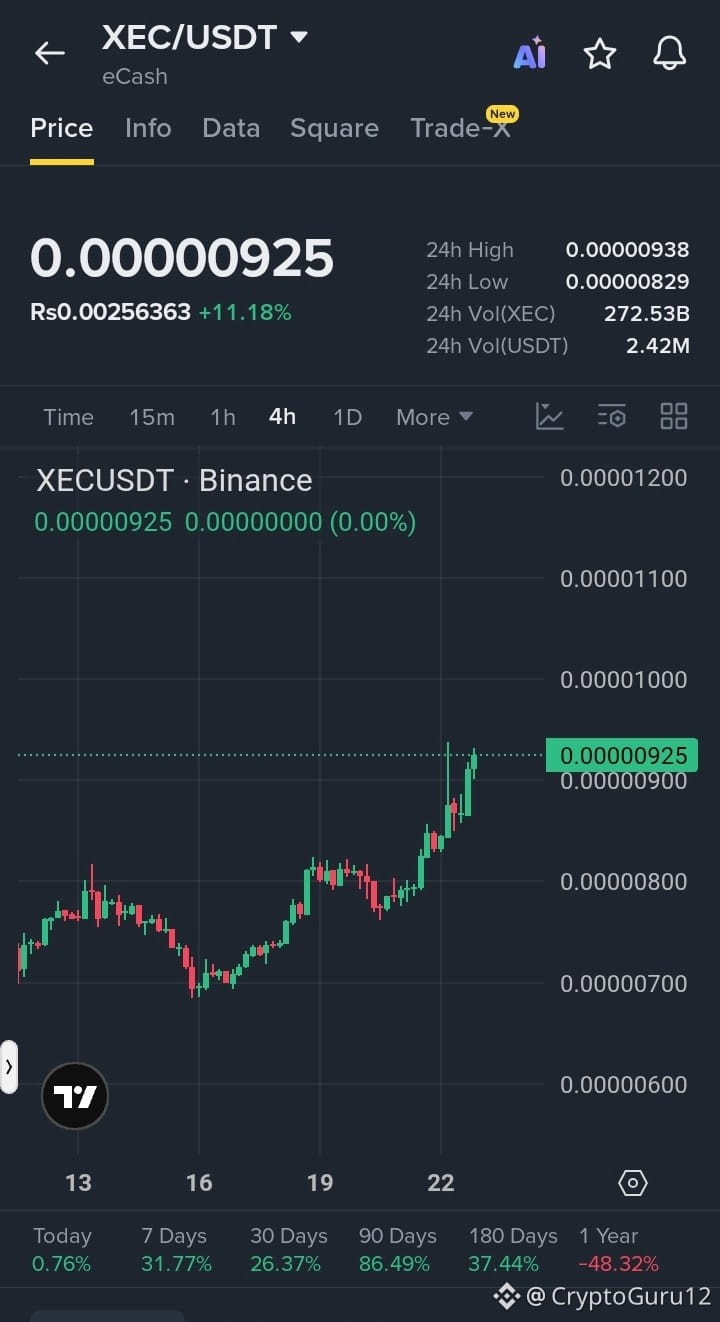
#XEC maintient une forte tendance haussière en 4H, avec des bougies consécutives plus hautes et une cassure au-dessus de la zone des 0,00000900 $. La dernière bougie reste haussière, proche du plus haut local.
Configuration Longue
Entrée : 0,00000920 $–0,00000930 $
TP1 : 0,00000945 $
TP2 : 0,00000965 $
TP3 : 0,00000985 $
SL : 0,00000890 $
Acheter et Trader
{spot}(XECUSDT)
$ZEC
{future}(ZECUSDT)
$MUBARAK
{future}(MUBARAKUSDT)
$XEC ... L’élan haussier se renforce
#XEC maintient une forte tendance haussière en 4H, avec des bougies consécutives plus hautes et une cassure au-dessus de la zone des 0,00000900 $. La dernière bougie reste haussière, proche du plus haut local.
Configuration Longue
Entrée : 0,00000920 $–0,00000930 $
TP1 : 0,00000945 $
TP2 : 0,00000965 $
TP3 : 0,00000985 $
SL : 0,00000890 $
Acheter et Trader
$ZEC
$MUBARAK
#XEC maintient une forte tendance haussière en 4H, avec des bougies consécutives plus hautes et une cassure au-dessus de la zone des 0,00000900 $. La dernière bougie reste haussière, proche du plus haut local.
Configuration Longue
Entrée : 0,00000920 $–0,00000930 $
TP1 : 0,00000945 $
TP2 : 0,00000965 $
TP3 : 0,00000985 $
SL : 0,00000890 $
Acheter et Trader
$ZEC
$MUBARAK
1
678

💥 $XEC CONFIRME UNE RUPTURE HEBDOMADAIRE ET UN RETEST POUR UNE REPRISE EXPLOSIVE ! 🚀
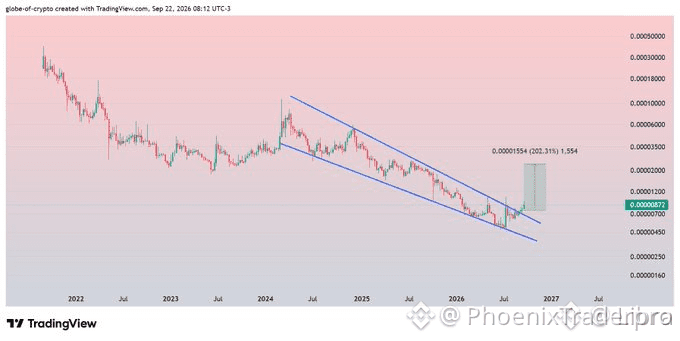
📌 Le graphique hebdomadaire sur $XEC vient de livrer une rupture et un retest dignes d’un manuel, signalant que les vendeurs ont totalement épuisé leur élan baissier. 📊 Lorsque la structure du marché à plus long terme s’inverse, passant d’une forte résistance à une demande structurelle, les acheteurs institutionnels absorbent discrètement l’offre tandis que le retail hésite.
💡 La patience macro offre la récompense la plus élevée, et cette validation structurelle propre ouvre une fenêtre idéale pour une poursuite sur plusieurs semaines. 💬 Enchérissez-vous sur ce retest hebdomadaire confirmé, ou attendez-vous que le volume retail poursuive le deuxième pic ? 👇
⚠️ Ceci n’est pas un conseil financier. Gérez toujours votre risque. 🛡️
🏷️ #XEC #Altcoins #WeeklyBreakout #Crypto
🎯 ⚡
💥 $XEC CONFIRME UNE RUPTURE HEBDOMADAIRE ET UN RETEST POUR UNE REPRISE EXPLOSIVE ! 🚀
📌 Le graphique hebdomadaire sur $XEC vient de livrer une rupture et un retest dignes d’un manuel, signalant que les vendeurs ont totalement épuisé leur élan baissier. 📊 Lorsque la structure du marché à plus long terme s’inverse, passant d’une forte résistance à une demande structurelle, les acheteurs institutionnels absorbent discrètement l’offre tandis que le retail hésite.
💡 La patience macro offre la récompense la plus élevée, et cette validation structurelle propre ouvre une fenêtre idéale pour une poursuite sur plusieurs semaines. 💬 Enchérissez-vous sur ce retest hebdomadaire confirmé, ou attendez-vous que le volume retail poursuive le deuxième pic ? 👇
⚠️ Ceci n’est pas un conseil financier. Gérez toujours votre risque. 🛡️
🏷️ #XEC #Altcoins #WeeklyBreakout #Crypto
🎯 ⚡
📌 Le graphique hebdomadaire sur $XEC vient de livrer une rupture et un retest dignes d’un manuel, signalant que les vendeurs ont totalement épuisé leur élan baissier. 📊 Lorsque la structure du marché à plus long terme s’inverse, passant d’une forte résistance à une demande structurelle, les acheteurs institutionnels absorbent discrètement l’offre tandis que le retail hésite.
💡 La patience macro offre la récompense la plus élevée, et cette validation structurelle propre ouvre une fenêtre idéale pour une poursuite sur plusieurs semaines. 💬 Enchérissez-vous sur ce retest hebdomadaire confirmé, ou attendez-vous que le volume retail poursuive le deuxième pic ? 👇
⚠️ Ceci n’est pas un conseil financier. Gérez toujours votre risque. 🛡️
🏷️ #XEC #Altcoins #WeeklyBreakout #Crypto
🎯 ⚡
150

💥 $XEC CONFIRME UNE RUPTURE DE MACRO ET UN RETEST SUR LE CADRE TEMPOREL HEBDOMADAIRE ! 🚀
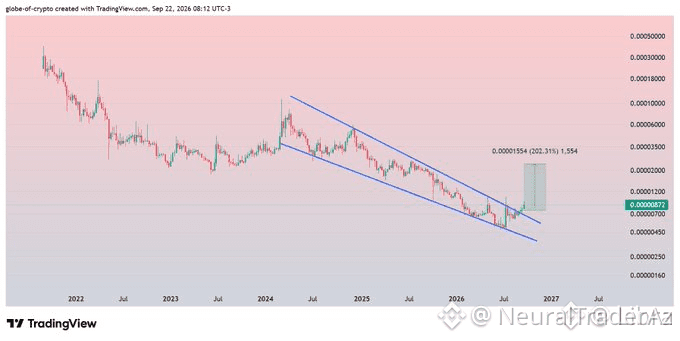
La structure macro sur $XEC s’est officiellement retournée. Une cassure hebdomadaire à forte confluence suivie d’un retest impeccable signale que la demande institutionnelle a réussi à absorber l’offre située au-dessus. 📊
Avec un support structurel qui tient bon, le flux d’ordres penche maintenant fortement vers l’expansion, car les poches d’inefficacité au-dessus deviennent des zones d’attraction de premier choix au cours des prochaines semaines. 🔍
💡 Un alignement sur des unités de temps supérieures comme celle-ci fournit un avantage structurel défini pour le positionnement macro. 💬 Construisez-vous une exposition sur cette confirmation hebdomadaire ou attendez-vous des entrées via un déclencheur sur un horizon plus court ? 👇
⚠️ Ceci n’est pas un conseil financier. Gérez toujours votre risque. 🛡️
🏷️ #XEC #Breakout #Crypto #MarketStructure #Altcoins
🎯 🦈
💥 $XEC CONFIRME UNE RUPTURE DE MACRO ET UN RETEST SUR LE CADRE TEMPOREL HEBDOMADAIRE ! 🚀
La structure macro sur $XEC s’est officiellement retournée. Une cassure hebdomadaire à forte confluence suivie d’un retest impeccable signale que la demande institutionnelle a réussi à absorber l’offre située au-dessus. 📊
Avec un support structurel qui tient bon, le flux d’ordres penche maintenant fortement vers l’expansion, car les poches d’inefficacité au-dessus deviennent des zones d’attraction de premier choix au cours des prochaines semaines. 🔍
💡 Un alignement sur des unités de temps supérieures comme celle-ci fournit un avantage structurel défini pour le positionnement macro. 💬 Construisez-vous une exposition sur cette confirmation hebdomadaire ou attendez-vous des entrées via un déclencheur sur un horizon plus court ? 👇
⚠️ Ceci n’est pas un conseil financier. Gérez toujours votre risque. 🛡️
🏷️ #XEC #Breakout #Crypto #MarketStructure #Altcoins
🎯 🦈
La structure macro sur $XEC s’est officiellement retournée. Une cassure hebdomadaire à forte confluence suivie d’un retest impeccable signale que la demande institutionnelle a réussi à absorber l’offre située au-dessus. 📊
Avec un support structurel qui tient bon, le flux d’ordres penche maintenant fortement vers l’expansion, car les poches d’inefficacité au-dessus deviennent des zones d’attraction de premier choix au cours des prochaines semaines. 🔍
💡 Un alignement sur des unités de temps supérieures comme celle-ci fournit un avantage structurel défini pour le positionnement macro. 💬 Construisez-vous une exposition sur cette confirmation hebdomadaire ou attendez-vous des entrées via un déclencheur sur un horizon plus court ? 👇
⚠️ Ceci n’est pas un conseil financier. Gérez toujours votre risque. 🛡️
🏷️ #XEC #Breakout #Crypto #MarketStructure #Altcoins
🎯 🦈
117


·
--
Haussier
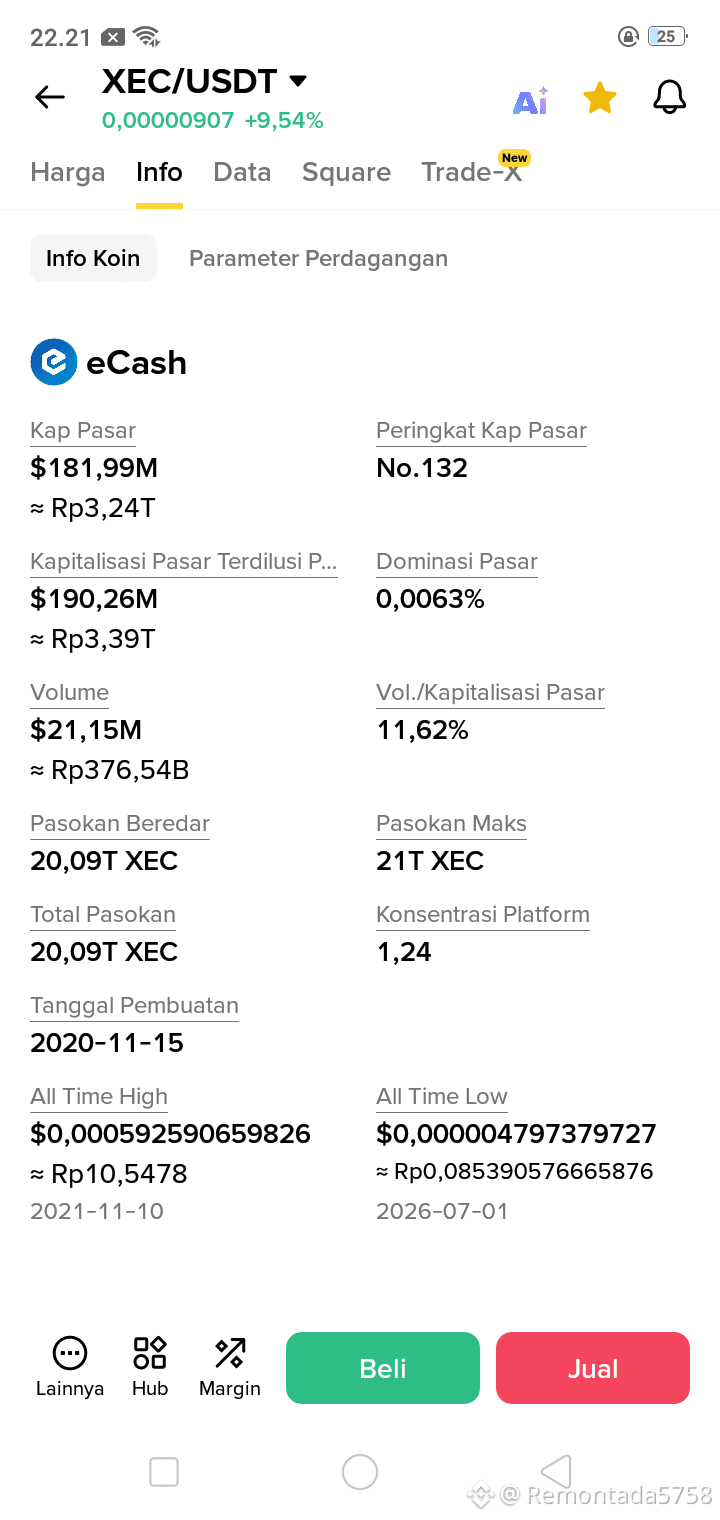
Beaucoup de gens disent que $XEC est $BTC sous une autre forme, mais en regardant les données de $XEC lui-même, je suis un peu sceptique. Pourquoi ?
Parce que les données montrent que #XEC , publié en 2020, avec une offre d’environ 20 billions de pièces, et qu’il a atteint son plus haut prix seulement un an après la publication, à un chiffre de 0,0005 $.
Même si #XEC devait connaître une hausse de prix extraordinaire, selon moi, 0,08 $ est son meilleur scénario. Ce n’est pas un conseil financier pour vous, mais simplement une illustration de mon analyse personnelle de #XEC , souvent appelé $btc sous une autre forme.
#pantaumarket
{spot}(XECUSDT)
{spot}(BTCUSDT)
Beaucoup de gens disent que $XEC est $BTC sous une autre forme, mais en regardant les données de $XEC lui-même, je suis un peu sceptique. Pourquoi ?
Parce que les données montrent que #XEC , publié en 2020, avec une offre d’environ 20 billions de pièces, et qu’il a atteint son plus haut prix seulement un an après la publication, à un chiffre de 0,0005 $.
Même si #XEC devait connaître une hausse de prix extraordinaire, selon moi, 0,08 $ est son meilleur scénario. Ce n’est pas un conseil financier pour vous, mais simplement une illustration de mon analyse personnelle de #XEC , souvent appelé $btc sous une autre forme.
#pantaumarket
Parce que les données montrent que #XEC , publié en 2020, avec une offre d’environ 20 billions de pièces, et qu’il a atteint son plus haut prix seulement un an après la publication, à un chiffre de 0,0005 $.
Même si #XEC devait connaître une hausse de prix extraordinaire, selon moi, 0,08 $ est son meilleur scénario. Ce n’est pas un conseil financier pour vous, mais simplement une illustration de mon analyse personnelle de #XEC , souvent appelé $btc sous une autre forme.
#pantaumarket
1
1
1.2k

·
--
Voir la traduction
⚡ $NIL 半小时净买入 227万,量能放到 3.5 倍
📈 $XEC 近 3.0 小时持仓增 11.0%,有人在建仓
💰 NIL 0.08580 偏多
🟢 站稳 0.08850
目标 0.09120 / 0.09450 / 0.09780
止损 0.08220
🔴 跌破 0.08250
下看 0.07920 / 0.07650
🎯 主力利用大户多空比 1.42 强势做多,主动成交比 1.10 显示买盘承接,近 3.0 小时持仓量 +14.94%,需维持才能确认趋势延续;主力正在拉升 NIL,仍缺半小时量能和主动成交比的确认,若半小时量能超过 5 倍且主动成交比上升至 1.5…。
━━━━━━━━━
💰 XEC 0.009546 偏多
🟢 站稳 0.009800
目标 0.010200 / 0.010800 / 0.011400
止损 0.009200
🔴 跌破 0.009300
下看 0.008800 / 0.008300
🎯 主力利用大户多空比 1.88 强势做多,主动成交比 0.62 显示卖盘主动,近 3.0 小时持仓量 +10.98%,需维持才能确认趋势延续;主力正在追多 XEC,仍缺大户多空比的进一步上升和资金费率的增加,若大户多空比上升至 2.5 以上且资金费…。
—
🕒 数据取自 09-23 09:00(UTC+8)币安合约行情,可自行核对
客观数据呈现,非投资建议,注意风险。
#NIL #XEC
⚡ $NIL 半小时净买入 227万,量能放到 3.5 倍
📈 $XEC 近 3.0 小时持仓增 11.0%,有人在建仓
💰 NIL 0.08580 偏多
🟢 站稳 0.08850
目标 0.09120 / 0.09450 / 0.09780
止损 0.08220
🔴 跌破 0.08250
下看 0.07920 / 0.07650
🎯 主力利用大户多空比 1.42 强势做多,主动成交比 1.10 显示买盘承接,近 3.0 小时持仓量 +14.94%,需维持才能确认趋势延续;主力正在拉升 NIL,仍缺半小时量能和主动成交比的确认,若半小时量能超过 5 倍且主动成交比上升至 1.5…。
━━━━━━━━━
💰 XEC 0.009546 偏多
🟢 站稳 0.009800
目标 0.010200 / 0.010800 / 0.011400
止损 0.009200
🔴 跌破 0.009300
下看 0.008800 / 0.008300
🎯 主力利用大户多空比 1.88 强势做多,主动成交比 0.62 显示卖盘主动,近 3.0 小时持仓量 +10.98%,需维持才能确认趋势延续;主力正在追多 XEC,仍缺大户多空比的进一步上升和资金费率的增加,若大户多空比上升至 2.5 以上且资金费…。
—
🕒 数据取自 09-23 09:00(UTC+8)币安合约行情,可自行核对
客观数据呈现,非投资建议,注意风险。
#NIL #XEC
📈 $XEC 近 3.0 小时持仓增 11.0%,有人在建仓
💰 NIL 0.08580 偏多
🟢 站稳 0.08850
目标 0.09120 / 0.09450 / 0.09780
止损 0.08220
🔴 跌破 0.08250
下看 0.07920 / 0.07650
🎯 主力利用大户多空比 1.42 强势做多,主动成交比 1.10 显示买盘承接,近 3.0 小时持仓量 +14.94%,需维持才能确认趋势延续;主力正在拉升 NIL,仍缺半小时量能和主动成交比的确认,若半小时量能超过 5 倍且主动成交比上升至 1.5…。
━━━━━━━━━
💰 XEC 0.009546 偏多
🟢 站稳 0.009800
目标 0.010200 / 0.010800 / 0.011400
止损 0.009200
🔴 跌破 0.009300
下看 0.008800 / 0.008300
🎯 主力利用大户多空比 1.88 强势做多,主动成交比 0.62 显示卖盘主动,近 3.0 小时持仓量 +10.98%,需维持才能确认趋势延续;主力正在追多 XEC,仍缺大户多空比的进一步上升和资金费率的增加,若大户多空比上升至 2.5 以上且资金费…。
—
🕒 数据取自 09-23 09:00(UTC+8)币安合约行情,可自行核对
客观数据呈现,非投资建议,注意风险。
#NIL #XEC
9
·
--
Haussier
$XEC adalah $BTC dalam bentuk autre, est-ce que c'est vrai ??🤔
Au cours des six dernières années depuis que $XEC a été publié, le prix le plus élevé qui ait pu être enregistré n'est qu'un montant de $0,0005...
#XEC #BTC #pantaumarket #BullishMomentum
{spot}(XECUSDT)
{spot}(BTCUSDT)
$XEC adalah $BTC dalam bentuk autre, est-ce que c'est vrai ??🤔
Au cours des six dernières années depuis que $XEC a été publié, le prix le plus élevé qui ait pu être enregistré n'est qu'un montant de $0,0005...
#XEC #BTC #pantaumarket #BullishMomentum
Au cours des six dernières années depuis que $XEC a été publié, le prix le plus élevé qui ait pu être enregistré n'est qu'un montant de $0,0005...
#XEC #BTC #pantaumarket #BullishMomentum
Remontada5758
·
--
HaussierBeaucoup de gens disent que $XEC est $BTC sous une autre forme, mais en regardant les données de $XEC lui-même, je suis un peu sceptique. Pourquoi ?
Parce que les données montrent que #XEC , publié en 2020, avec une offre d’environ 20 billions de pièces, et qu’il a atteint son plus haut prix seulement un an après la publication, à un chiffre de 0,0005 $.
Même si #XEC devait connaître une hausse de prix extraordinaire, selon moi, 0,08 $ est son meilleur scénario. Ce n’est pas un conseil financier pour vous, mais simplement une illustration de mon analyse personnelle de #XEC , souvent appelé $btc sous une autre forme.
#pantaumarket
Parce que les données montrent que #XEC , publié en 2020, avec une offre d’environ 20 billions de pièces, et qu’il a atteint son plus haut prix seulement un an après la publication, à un chiffre de 0,0005 $.
Même si #XEC devait connaître une hausse de prix extraordinaire, selon moi, 0,08 $ est son meilleur scénario. Ce n’est pas un conseil financier pour vous, mais simplement une illustration de mon analyse personnelle de #XEC , souvent appelé $btc sous une autre forme.
#pantaumarket
3
371
·
--
Voir la traduction
$XEC 半小时净买入 30万,量能放到 6.1 倍
$FORM 今日涨 18.4%,量价配合
💰 XEC 0.008823 偏多
🟢 站稳 0.008859
目标 0.009075 / 0.009183 / 0.009291
止损 0.008715
🔴 跌破 0.008787
下看 0.008571 / 0.008463
🎯 主力正在拉升,半小时量能 6.1 倍,仍缺信号链中的连续放量拉升确认。
━━━━━━━━━
💰 FORM 0.3324 偏多
🟢 站稳 0.3338
目标 0.3422 / 0.3464 / 0.3506
止损 0.3282
🔴 跌破 0.3310
下看 0.3226 / 0.3184
🎯 主力利用大户多空比 1.34 强势做多,主动成交比 0.97 显示多空拉锯,近 3.0 小时持仓量 +10.48%,需维持才能确认趋势延续;等待站稳确认后再跟随。
—
🕒 数据取自 09-22 19:05(UTC+8)币安合约行情,可自行核对
客观数据呈现,非投资建议,注意风险。
#XEC #FORM
$XEC 半小时净买入 30万,量能放到 6.1 倍
$FORM 今日涨 18.4%,量价配合
💰 XEC 0.008823 偏多
🟢 站稳 0.008859
目标 0.009075 / 0.009183 / 0.009291
止损 0.008715
🔴 跌破 0.008787
下看 0.008571 / 0.008463
🎯 主力正在拉升,半小时量能 6.1 倍,仍缺信号链中的连续放量拉升确认。
━━━━━━━━━
💰 FORM 0.3324 偏多
🟢 站稳 0.3338
目标 0.3422 / 0.3464 / 0.3506
止损 0.3282
🔴 跌破 0.3310
下看 0.3226 / 0.3184
🎯 主力利用大户多空比 1.34 强势做多,主动成交比 0.97 显示多空拉锯,近 3.0 小时持仓量 +10.48%,需维持才能确认趋势延续;等待站稳确认后再跟随。
—
🕒 数据取自 09-22 19:05(UTC+8)币安合约行情,可自行核对
客观数据呈现,非投资建议,注意风险。
#XEC #FORM
$FORM 今日涨 18.4%,量价配合
💰 XEC 0.008823 偏多
🟢 站稳 0.008859
目标 0.009075 / 0.009183 / 0.009291
止损 0.008715
🔴 跌破 0.008787
下看 0.008571 / 0.008463
🎯 主力正在拉升,半小时量能 6.1 倍,仍缺信号链中的连续放量拉升确认。
━━━━━━━━━
💰 FORM 0.3324 偏多
🟢 站稳 0.3338
目标 0.3422 / 0.3464 / 0.3506
止损 0.3282
🔴 跌破 0.3310
下看 0.3226 / 0.3184
🎯 主力利用大户多空比 1.34 强势做多,主动成交比 0.97 显示多空拉锯,近 3.0 小时持仓量 +10.48%,需维持才能确认趋势延续;等待站稳确认后再跟随。
—
🕒 数据取自 09-22 19:05(UTC+8)币安合约行情,可自行核对
客观数据呈现,非投资建议,注意风险。
#XEC #FORM
123
·
--
Haussier
Le prince de la grenouille $PEPE et E-Cash $XEC obtiennent aussi #BullishMomentum , les deux affichent des mouvements forts pour la propulser vers le haut. À l’heure actuelle, #PEPE est échangée à 0,000003 $ et #XEC se négocie à un prix légèrement plus élevé, soit 0,000007 $. Il n’est pas excessif de penser que les deux visent une position de prix plus élevée ; regarder le chiffre de 0,0001 $ reste peut-être encore réaliste, compte tenu du soutien de la communauté et d’une augmentation de liquidité assez importante.
{spot}(PEPEUSDT)
{spot}(XECUSDT)
Le prince de la grenouille $PEPE et E-Cash $XEC obtiennent aussi #BullishMomentum , les deux affichent des mouvements forts pour la propulser vers le haut. À l’heure actuelle, #PEPE est échangée à 0,000003 $ et #XEC se négocie à un prix légèrement plus élevé, soit 0,000007 $. Il n’est pas excessif de penser que les deux visent une position de prix plus élevée ; regarder le chiffre de 0,0001 $ reste peut-être encore réaliste, compte tenu du soutien de la communauté et d’une augmentation de liquidité assez importante.
3
1.1k

·
--
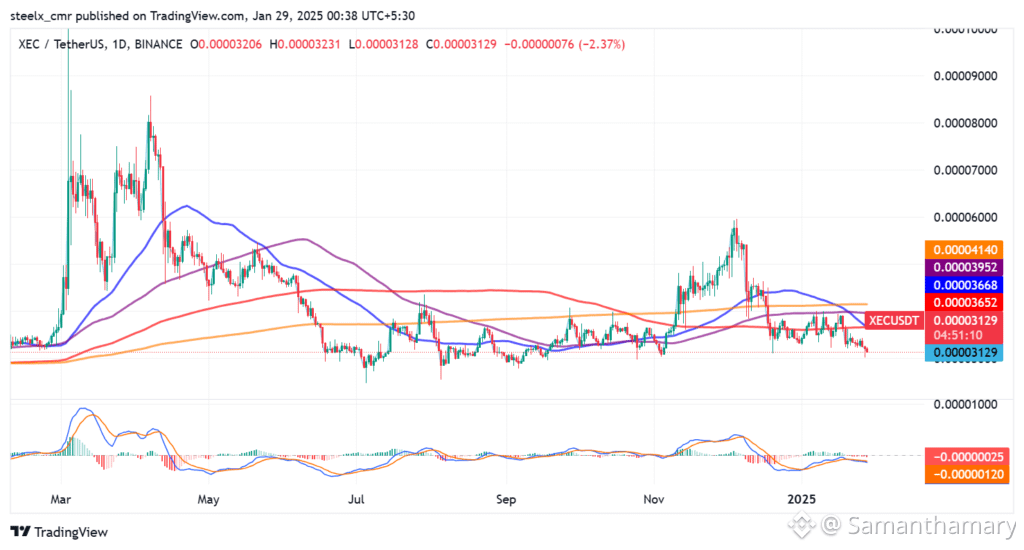
$XEC semble actuellement faible, mais je le garde à l’œil. 👀
Comme XEC évolue souvent avec le marché plus large du BTC, une forte reprise du Bitcoin pourrait aussi insuffler un nouvel élan à XEC.
Si le BTC atteint la zone des 100 000 $ d’ici fin 2026, je surveille 0,00012 $ comme cible possible pour XEC.
Que pensez-vous de XEC ? Partagez vos réflexions ci-dessous. 👇
⚠️ Ceci n’est pas un conseil financier. Faites vos propres recherches.
#XEC #Bitcoin #BTC #crypto #BinanceFeed
{spot}(XECUSDT)
$XEC semble actuellement faible, mais je le garde à l’œil. 👀
Comme XEC évolue souvent avec le marché plus large du BTC, une forte reprise du Bitcoin pourrait aussi insuffler un nouvel élan à XEC.
Si le BTC atteint la zone des 100 000 $ d’ici fin 2026, je surveille 0,00012 $ comme cible possible pour XEC.
Que pensez-vous de XEC ? Partagez vos réflexions ci-dessous. 👇
⚠️ Ceci n’est pas un conseil financier. Faites vos propres recherches.
#XEC #Bitcoin #BTC #crypto #BinanceFeed
Comme XEC évolue souvent avec le marché plus large du BTC, une forte reprise du Bitcoin pourrait aussi insuffler un nouvel élan à XEC.
Si le BTC atteint la zone des 100 000 $ d’ici fin 2026, je surveille 0,00012 $ comme cible possible pour XEC.
Que pensez-vous de XEC ? Partagez vos réflexions ci-dessous. 👇
⚠️ Ceci n’est pas un conseil financier. Faites vos propres recherches.
#XEC #Bitcoin #BTC #crypto #BinanceFeed
403

·
--
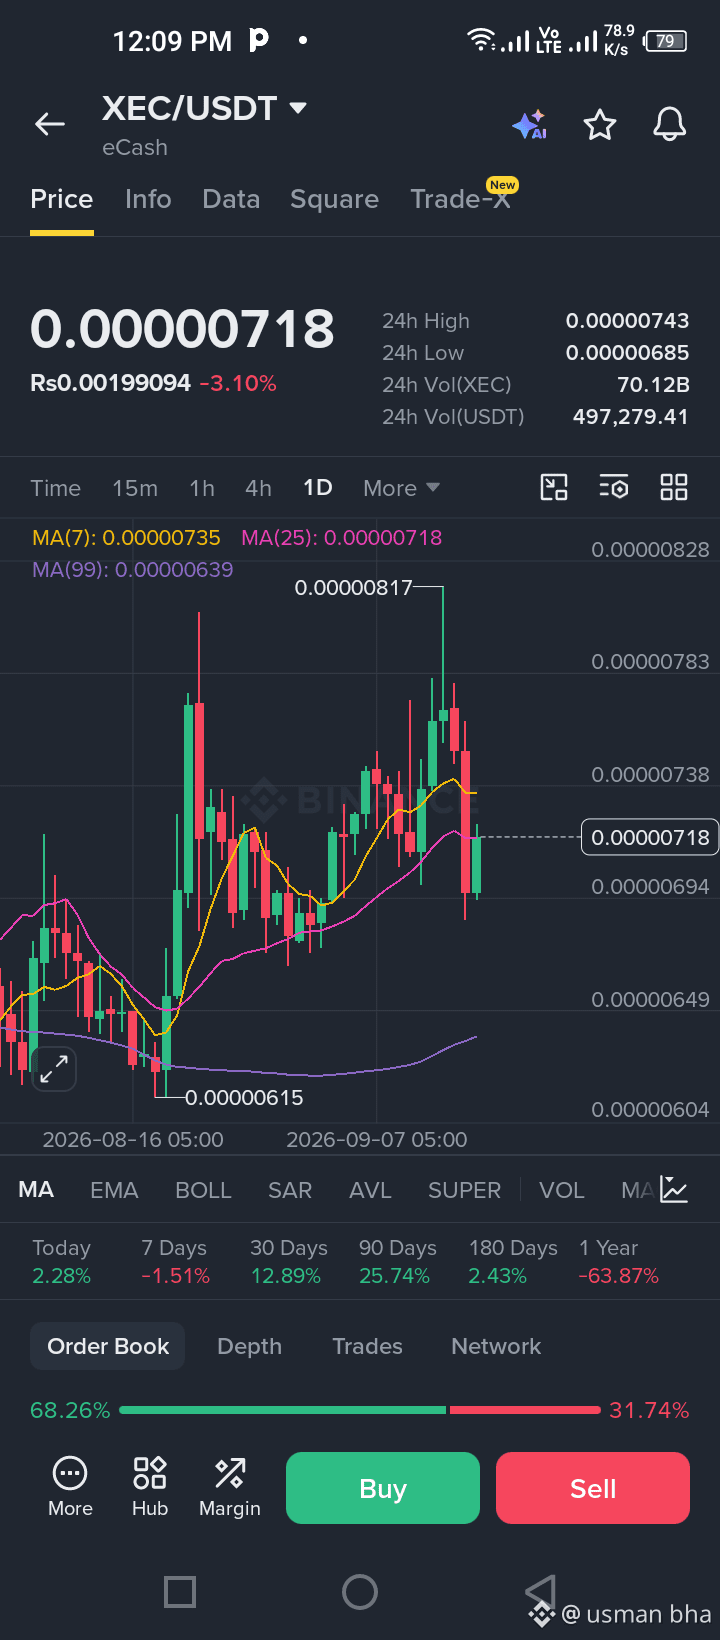
$XEC subit actuellement une certaine pression vendeuse, en baisse d’environ 3,1% 📉
Comme XEC a tendance à évoluer de concert avec l’ensemble du marché crypto, une forte hausse du Bitcoin pourrait potentiellement insuffler un nouvel élan à XEC également. 🚀
Je surveille personnellement le niveau de 0,00012 $ comme objectif possible à long terme si le marché repasse haussier.
Que pensez-vous de $XEC ? 👀 Dites-moi ce que vous en pensez en commentaires ! 💬
#XEC #BTC
$XEC subit actuellement une certaine pression vendeuse, en baisse d’environ 3,1% 📉
Comme XEC a tendance à évoluer de concert avec l’ensemble du marché crypto, une forte hausse du Bitcoin pourrait potentiellement insuffler un nouvel élan à XEC également. 🚀
Je surveille personnellement le niveau de 0,00012 $ comme objectif possible à long terme si le marché repasse haussier.
Que pensez-vous de $XEC ? 👀 Dites-moi ce que vous en pensez en commentaires ! 💬
#XEC #BTC
Comme XEC a tendance à évoluer de concert avec l’ensemble du marché crypto, une forte hausse du Bitcoin pourrait potentiellement insuffler un nouvel élan à XEC également. 🚀
Je surveille personnellement le niveau de 0,00012 $ comme objectif possible à long terme si le marché repasse haussier.
Que pensez-vous de $XEC ? 👀 Dites-moi ce que vous en pensez en commentaires ! 💬
#XEC #BTC
228

·
--
Baissier
$XEC Perspective du marché 📊
{spot}(XECUSDT)
$XEC subit actuellement une pression, tandis que sa tendance de marché plus large reste étroitement influencée par le Bitcoin et le sentiment général du secteur crypto.
Si le BTC prend un élan fort, $XEC pourrait susciter un regain d’intérêt à l’achat. Le niveau à 0,00012 $ mérite d’être surveillé comme cible potentielle, mais rien n’est garanti.
Quel est votre avis sur $XEC ? 👇
#XEC #Bitcoin #Crypto #MarketAnalysis #Trading
$XEC Perspective du marché 📊
$XEC subit actuellement une pression, tandis que sa tendance de marché plus large reste étroitement influencée par le Bitcoin et le sentiment général du secteur crypto.
Si le BTC prend un élan fort, $XEC pourrait susciter un regain d’intérêt à l’achat. Le niveau à 0,00012 $ mérite d’être surveillé comme cible potentielle, mais rien n’est garanti.
Quel est votre avis sur $XEC ? 👇
#XEC #Bitcoin #Crypto #MarketAnalysis #Trading
$XEC subit actuellement une pression, tandis que sa tendance de marché plus large reste étroitement influencée par le Bitcoin et le sentiment général du secteur crypto.
Si le BTC prend un élan fort, $XEC pourrait susciter un regain d’intérêt à l’achat. Le niveau à 0,00012 $ mérite d’être surveillé comme cible potentielle, mais rien n’est garanti.
Quel est votre avis sur $XEC ? 👇
#XEC #Bitcoin #Crypto #MarketAnalysis #Trading
264

·
--
Je suis haussier sur $XEC ce soir. L’expansion du volume ne peut pas être ignorée. Gardez le graphique ouvert.
$SHIB $BNB Haussier
#XEC #momentum #watchlist prochain mouvement
Je suis haussier sur $XEC ce soir. L’expansion du volume ne peut pas être ignorée. Gardez le graphique ouvert.
$SHIB $BNB Haussier
#XEC #momentum #watchlist prochain mouvement
$SHIB $BNB Haussier
#XEC #momentum #watchlist prochain mouvement
2
290

·
--
Haussier
🔥 Mes 3 crypto-monnaies préférées — Peu importe le prix
🥇 $ZEC — La confidentialité avec choix
Zcash se distingue à mes yeux parce qu’il utilise la technologie de preuve à connaissance nulle pour permettre des transactions privées tout en offrant aux utilisateurs la possibilité de transiger de façon transparente. J’aime la flexibilité d’avoir de la confidentialité quand j’en ai besoin.
🥈 $XMR — La confidentialité par défaut
Monero adopte une approche différente. La confidentialité est intégrée au réseau par défaut : les transactions sont conçues pour masquer l’expéditeur, le destinataire et le montant. Je respecte son fort engagement envers la fongibilité et la confidentialité financière.
⚡ ZEC vs XMR — La différence clé :
ZEC = confidentialité optionnelle. 🛡️
XMR = confidentialité par défaut. 🔒
🥉 $XEC — Conçu pour les paiements du quotidien
eCash m’intéresse grâce à son orientation vers une monnaie numérique rapide et peu coûteuse, pensée pour un usage quotidien. L’idée de rendre la crypto plus proche d’une vraie monnaie numérique, c’est ce qui m’attire.
💎 Ce ne sont pas mes favoris à cause du prix d’aujourd’hui.
Je les apprécie pour leur technologie, leur vision et les problèmes qu’elles cherchent à résoudre.
Les prix changent. Les récits changent.
La conviction vient de la compréhension de ce que vous détenez. 🧠⚡
#AnalystKakashi #XMR #XEC #zec
{future}(ZECUSDT)
{future}(XMRUSDT)
{spot}(XECUSDT)
🔥 Mes 3 crypto-monnaies préférées — Peu importe le prix
🥇 $ZEC — La confidentialité avec choix
Zcash se distingue à mes yeux parce qu’il utilise la technologie de preuve à connaissance nulle pour permettre des transactions privées tout en offrant aux utilisateurs la possibilité de transiger de façon transparente. J’aime la flexibilité d’avoir de la confidentialité quand j’en ai besoin.
🥈 $XMR — La confidentialité par défaut
Monero adopte une approche différente. La confidentialité est intégrée au réseau par défaut : les transactions sont conçues pour masquer l’expéditeur, le destinataire et le montant. Je respecte son fort engagement envers la fongibilité et la confidentialité financière.
⚡ ZEC vs XMR — La différence clé :
ZEC = confidentialité optionnelle. 🛡️
XMR = confidentialité par défaut. 🔒
🥉 $XEC — Conçu pour les paiements du quotidien
eCash m’intéresse grâce à son orientation vers une monnaie numérique rapide et peu coûteuse, pensée pour un usage quotidien. L’idée de rendre la crypto plus proche d’une vraie monnaie numérique, c’est ce qui m’attire.
💎 Ce ne sont pas mes favoris à cause du prix d’aujourd’hui.
Je les apprécie pour leur technologie, leur vision et les problèmes qu’elles cherchent à résoudre.
Les prix changent. Les récits changent.
La conviction vient de la compréhension de ce que vous détenez. 🧠⚡
#AnalystKakashi #XMR #XEC #zec
🥇 $ZEC — La confidentialité avec choix
Zcash se distingue à mes yeux parce qu’il utilise la technologie de preuve à connaissance nulle pour permettre des transactions privées tout en offrant aux utilisateurs la possibilité de transiger de façon transparente. J’aime la flexibilité d’avoir de la confidentialité quand j’en ai besoin.
🥈 $XMR — La confidentialité par défaut
Monero adopte une approche différente. La confidentialité est intégrée au réseau par défaut : les transactions sont conçues pour masquer l’expéditeur, le destinataire et le montant. Je respecte son fort engagement envers la fongibilité et la confidentialité financière.
⚡ ZEC vs XMR — La différence clé :
ZEC = confidentialité optionnelle. 🛡️
XMR = confidentialité par défaut. 🔒
🥉 $XEC — Conçu pour les paiements du quotidien
eCash m’intéresse grâce à son orientation vers une monnaie numérique rapide et peu coûteuse, pensée pour un usage quotidien. L’idée de rendre la crypto plus proche d’une vraie monnaie numérique, c’est ce qui m’attire.
💎 Ce ne sont pas mes favoris à cause du prix d’aujourd’hui.
Je les apprécie pour leur technologie, leur vision et les problèmes qu’elles cherchent à résoudre.
Les prix changent. Les récits changent.
La conviction vient de la compréhension de ce que vous détenez. 🧠⚡
#AnalystKakashi #XMR #XEC #zec

1
3
768
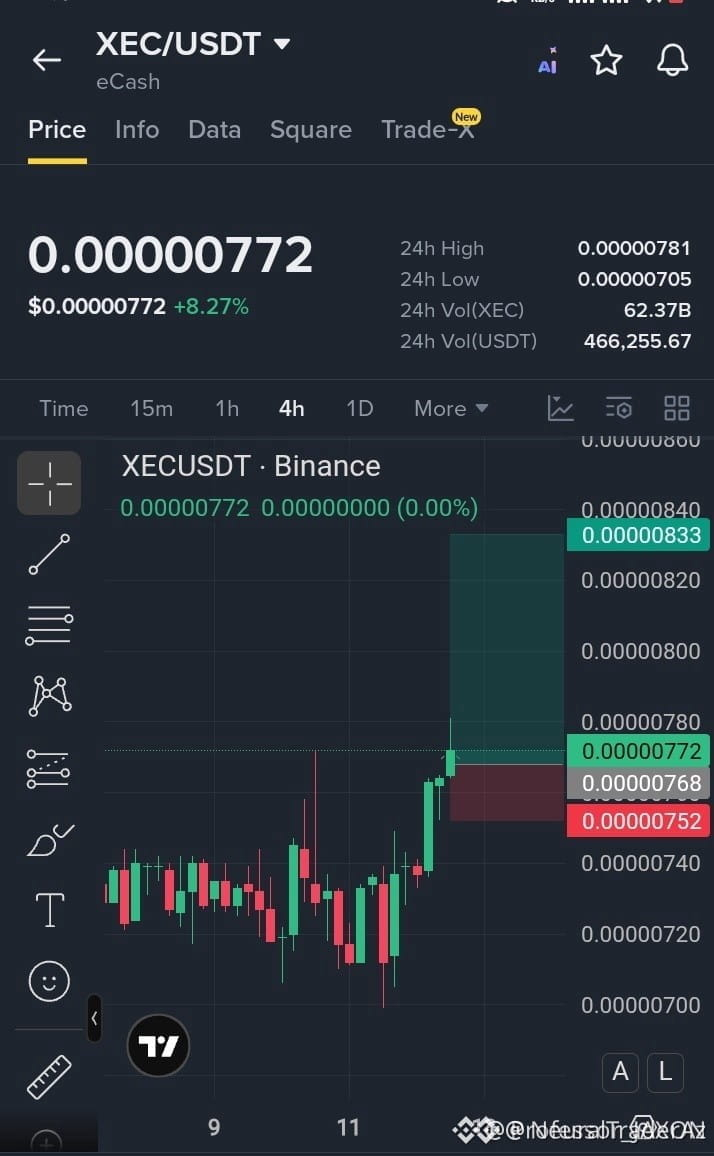
🚨 $XEC REPRISE CONSOLIDATION RANGÉE AVEC FORTE CONTINUATION D’ACHATS VERS LA LIQUIDITÉ CLÉ ! ⚡
Entrée : 0.00000768 - 0.00000772 🟢
Objectif : 0.00000833 🎯
Stop Loss : 0.00000752 ⚠️
📌 $XEC a réussi à franchir à la hausse sa structure de consolidation, avec un volume d’achats soutenu défendant la zone de cassure. Tant que ce nouveau support établi tient bon, la structure de marché favorise une expansion méthodique vers l’objectif de liquidité supérieur à 0.00000833. 📊
💡 Les “smart money” continuent d’absorber la pression vendeuse sur les replis peu profonds, maintenant le prix proprement au-dessus du précédent plus haut de la fourchette. 🔍 Ce positionnement structurel offre une configuration à forte conviction à mesure que l’élan haussier s’accélère. 💬 Tu fais partie de ceux qui suivent cette retouche de cassure, ou tu attends un pullback plus profond vers la zone de demande ? 👇
⚠️ Ceci ne constitue pas un conseil financier. Gérez toujours votre risque. 🛡️
🏷️ #XEC #Altcoins #Breakout #LongSetup
⚡ 🎯
🚨 $XEC REPRISE CONSOLIDATION RANGÉE AVEC FORTE CONTINUATION D’ACHATS VERS LA LIQUIDITÉ CLÉ ! ⚡
Entrée : 0.00000768 - 0.00000772 🟢
Objectif : 0.00000833 🎯
Stop Loss : 0.00000752 ⚠️
📌 $XEC a réussi à franchir à la hausse sa structure de consolidation, avec un volume d’achats soutenu défendant la zone de cassure. Tant que ce nouveau support établi tient bon, la structure de marché favorise une expansion méthodique vers l’objectif de liquidité supérieur à 0.00000833. 📊
💡 Les “smart money” continuent d’absorber la pression vendeuse sur les replis peu profonds, maintenant le prix proprement au-dessus du précédent plus haut de la fourchette. 🔍 Ce positionnement structurel offre une configuration à forte conviction à mesure que l’élan haussier s’accélère. 💬 Tu fais partie de ceux qui suivent cette retouche de cassure, ou tu attends un pullback plus profond vers la zone de demande ? 👇
⚠️ Ceci ne constitue pas un conseil financier. Gérez toujours votre risque. 🛡️
🏷️ #XEC #Altcoins #Breakout #LongSetup
⚡ 🎯
Entrée : 0.00000768 - 0.00000772 🟢
Objectif : 0.00000833 🎯
Stop Loss : 0.00000752 ⚠️
📌 $XEC a réussi à franchir à la hausse sa structure de consolidation, avec un volume d’achats soutenu défendant la zone de cassure. Tant que ce nouveau support établi tient bon, la structure de marché favorise une expansion méthodique vers l’objectif de liquidité supérieur à 0.00000833. 📊
💡 Les “smart money” continuent d’absorber la pression vendeuse sur les replis peu profonds, maintenant le prix proprement au-dessus du précédent plus haut de la fourchette. 🔍 Ce positionnement structurel offre une configuration à forte conviction à mesure que l’élan haussier s’accélère. 💬 Tu fais partie de ceux qui suivent cette retouche de cassure, ou tu attends un pullback plus profond vers la zone de demande ? 👇
⚠️ Ceci ne constitue pas un conseil financier. Gérez toujours votre risque. 🛡️
🏷️ #XEC #Altcoins #Breakout #LongSetup
⚡ 🎯
275

·
--
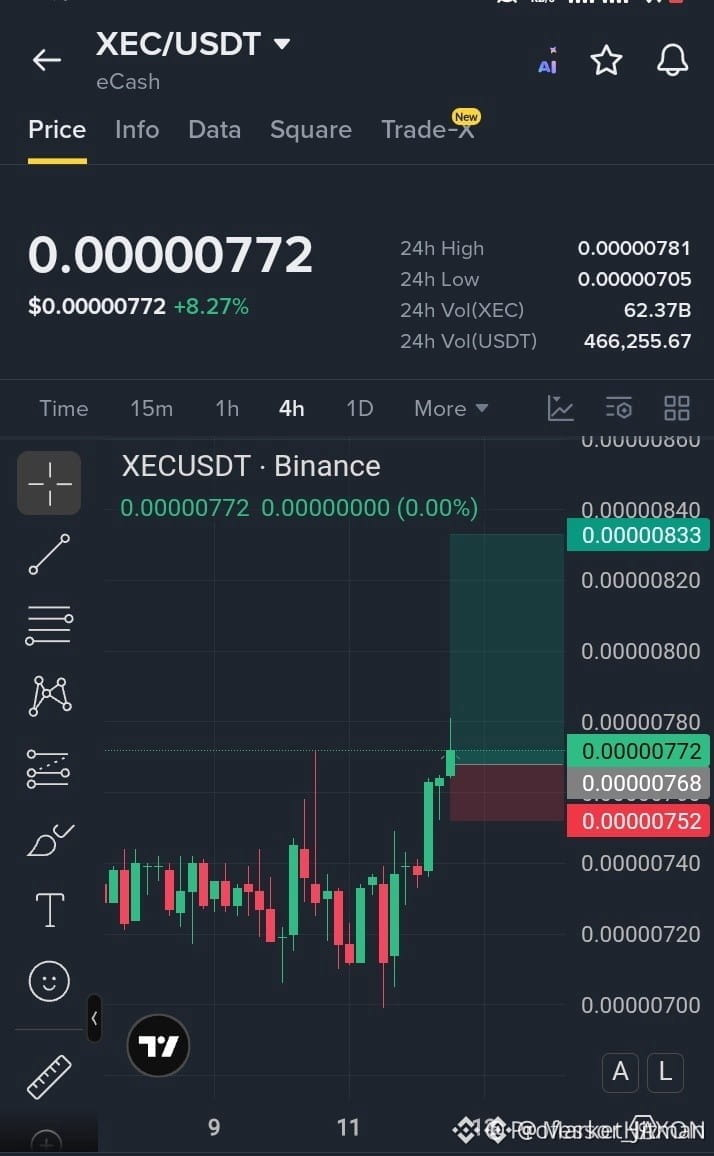
⚡ $XEC BREAKS CONSOLIDATION AVEC UNE FORTE PRESSION ACHETEUR, ALORS QUE LES BULLS VISENT PLUS HAUT ! 💥
Entrée : 0.00000768 - 0.00000772 ⚡
Objectif : 0.00000833 🚀
Stop Loss : 0.00000752 ⚠️
Les Bulls viennent de reprendre le contrôle sur $XEC , brisant une compression de range serrée avec une montée de la demande indéniable. 📊 Le retournement de momentum au-dessus de la zone de cassure signale que les acheteurs absorbent activement l’offre et préparent le graphique pour une progression durable à la hausse.
📌 Tant que le prix reste au-dessus de cette nouvelle base de support, le flux d’ordres favorise une expansion rapide vers nos objectifs principaux. ⚡ Les acheteurs agressifs défendent la partie basse du range, créant une fenêtre claire avec gestion du risque pour les traders de momentum. 💡
💬 Vous montez cette expansion de momentum jusqu’en haut, ou vous observez depuis les côtés ? 👇
⚠️ Ceci n’est pas un conseil financier. Gérez toujours votre risque. 🛡️
🏷️ #XEC #LongSetup #Breakout #Crypto
🔥 💎
⚡ $XEC BREAKS CONSOLIDATION AVEC UNE FORTE PRESSION ACHETEUR, ALORS QUE LES BULLS VISENT PLUS HAUT ! 💥
Entrée : 0.00000768 - 0.00000772 ⚡
Objectif : 0.00000833 🚀
Stop Loss : 0.00000752 ⚠️
Les Bulls viennent de reprendre le contrôle sur $XEC , brisant une compression de range serrée avec une montée de la demande indéniable. 📊 Le retournement de momentum au-dessus de la zone de cassure signale que les acheteurs absorbent activement l’offre et préparent le graphique pour une progression durable à la hausse.
📌 Tant que le prix reste au-dessus de cette nouvelle base de support, le flux d’ordres favorise une expansion rapide vers nos objectifs principaux. ⚡ Les acheteurs agressifs défendent la partie basse du range, créant une fenêtre claire avec gestion du risque pour les traders de momentum. 💡
💬 Vous montez cette expansion de momentum jusqu’en haut, ou vous observez depuis les côtés ? 👇
⚠️ Ceci n’est pas un conseil financier. Gérez toujours votre risque. 🛡️
🏷️ #XEC #LongSetup #Breakout #Crypto
🔥 💎
Entrée : 0.00000768 - 0.00000772 ⚡
Objectif : 0.00000833 🚀
Stop Loss : 0.00000752 ⚠️
Les Bulls viennent de reprendre le contrôle sur $XEC , brisant une compression de range serrée avec une montée de la demande indéniable. 📊 Le retournement de momentum au-dessus de la zone de cassure signale que les acheteurs absorbent activement l’offre et préparent le graphique pour une progression durable à la hausse.
📌 Tant que le prix reste au-dessus de cette nouvelle base de support, le flux d’ordres favorise une expansion rapide vers nos objectifs principaux. ⚡ Les acheteurs agressifs défendent la partie basse du range, créant une fenêtre claire avec gestion du risque pour les traders de momentum. 💡
💬 Vous montez cette expansion de momentum jusqu’en haut, ou vous observez depuis les côtés ? 👇
⚠️ Ceci n’est pas un conseil financier. Gérez toujours votre risque. 🛡️
🏷️ #XEC #LongSetup #Breakout #Crypto
🔥 💎
218

·
--
🌈 Divers actifs crypto montrant une structure haussière puissante 🌈
💎 $XEC
{spot}(XECUSDT)
💎 $ESP
{spot}(ESPUSDT)
💎 $JUP
{spot}(JUPUSDT)
#XEC #ESPUSDT #CryptoGems #CPIWatch #BinanceExplorers
🌈 Divers actifs crypto montrant une structure haussière puissante 🌈
💎 $XEC
💎 $ESP
💎 $JUP
#XEC #ESPUSDT #CryptoGems #CPIWatch #BinanceExplorers
💎 $XEC
💎 $ESP
💎 $JUP
#XEC #ESPUSDT #CryptoGems #CPIWatch #BinanceExplorers

225

·
--
Configuration d’appel de trading SPOT $XEC
👉 Cliquez ici pour acheter $XEC
{spot}(XECUSDT)
Entrée : 0.0000077
TP1 : 0.0000079 (+3,0%)
TP2 : 0.0000082 (+6,0%)
TP3 : 0.0000084 (+9,0%)
#XEC
Configuration d’appel de trading SPOT $XEC
👉 Cliquez ici pour acheter $XEC
Entrée : 0.0000077
TP1 : 0.0000079 (+3,0%)
TP2 : 0.0000082 (+6,0%)
TP3 : 0.0000084 (+9,0%)
#XEC
👉 Cliquez ici pour acheter $XEC
Entrée : 0.0000077
TP1 : 0.0000079 (+3,0%)
TP2 : 0.0000082 (+6,0%)
TP3 : 0.0000084 (+9,0%)
#XEC
45

·
--
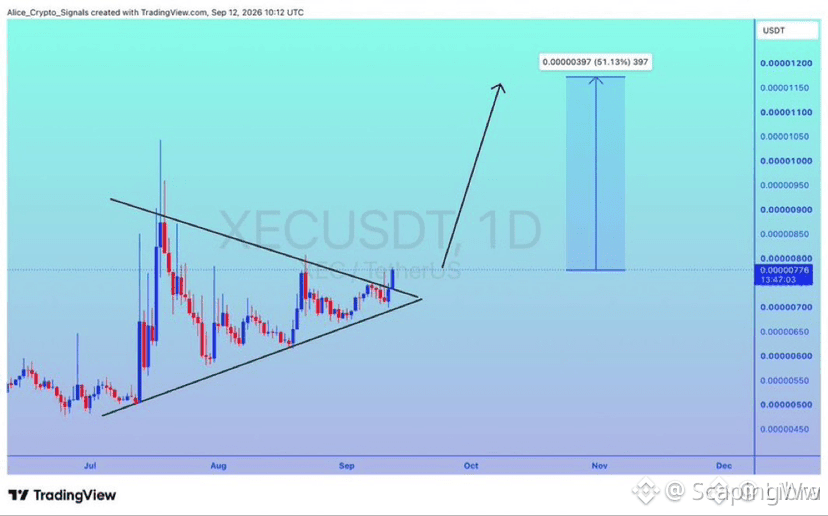
⚡ $XEC PRESSION EN CONSTRUCTION SUR UNE RÉSISTANCE MULTISEMAINE POUR une ÉVENTUELLE EXPANSION DE 50 % ! 📈
$XEC se serre fermement contre sa limite de résistance supérieure, signalant que la liquidité côté vendeurs s’amenuise à chaque nouveau test. 📊 Les vendeurs sont à court de munitions tandis que des acheteurs persistants font monter le plancher de prix.
Lorsque la volatilité comprime aussi fortement la tendance sur les stratégies basées sur l’élan, l’expansion qui suit est généralement rapide et agressive. ⚡ Une cassure nette ici dégage l’espace au-dessus pour un potentiel mouvement de 50 %+ alors que des stops courts se font balayer. 💡
💬 Suis-tu l’élan de cette cassure par compression ou attends-tu la confirmation lors du re-test ? 👇
⚠️ Ce n’est pas un conseil financier. Gère toujours ton risque. 🛡️
🏷️ #XEC #Crypto #Breakout #Altcoins
🔥 🎯
⚡ $XEC PRESSION EN CONSTRUCTION SUR UNE RÉSISTANCE MULTISEMAINE POUR une ÉVENTUELLE EXPANSION DE 50 % ! 📈
$XEC se serre fermement contre sa limite de résistance supérieure, signalant que la liquidité côté vendeurs s’amenuise à chaque nouveau test. 📊 Les vendeurs sont à court de munitions tandis que des acheteurs persistants font monter le plancher de prix.
Lorsque la volatilité comprime aussi fortement la tendance sur les stratégies basées sur l’élan, l’expansion qui suit est généralement rapide et agressive. ⚡ Une cassure nette ici dégage l’espace au-dessus pour un potentiel mouvement de 50 %+ alors que des stops courts se font balayer. 💡
💬 Suis-tu l’élan de cette cassure par compression ou attends-tu la confirmation lors du re-test ? 👇
⚠️ Ce n’est pas un conseil financier. Gère toujours ton risque. 🛡️
🏷️ #XEC #Crypto #Breakout #Altcoins
🔥 🎯
$XEC se serre fermement contre sa limite de résistance supérieure, signalant que la liquidité côté vendeurs s’amenuise à chaque nouveau test. 📊 Les vendeurs sont à court de munitions tandis que des acheteurs persistants font monter le plancher de prix.
Lorsque la volatilité comprime aussi fortement la tendance sur les stratégies basées sur l’élan, l’expansion qui suit est généralement rapide et agressive. ⚡ Une cassure nette ici dégage l’espace au-dessus pour un potentiel mouvement de 50 %+ alors que des stops courts se font balayer. 💡
💬 Suis-tu l’élan de cette cassure par compression ou attends-tu la confirmation lors du re-test ? 👇
⚠️ Ce n’est pas un conseil financier. Gère toujours ton risque. 🛡️
🏷️ #XEC #Crypto #Breakout #Altcoins
🔥 🎯
134
Connectez-vous pour découvrir plus de contenu
Rejoignez la communauté mondiale des adeptes de cryptomonnaies sur Binance Square
⚡️ Suviez les dernières informations importantes sur les cryptomonnaies.
💬 Jugé digne de confiance par la plus grande plateforme d’échange de cryptomonnaies au monde.
👍 Découvrez les connaissances que partagent les créateurs vérifiés.
Adresse e-mail/Nº de téléphone
Sujets d’actualité
1
#AIStocksWhatNext
389,906 vues
3,102 mentions
2
#BitcoinBreaksAboveMayHighNears$86K
16,444 vues
201 mentions
3
#DogecoinRises15%
52,395 vues
1,037 mentions
4
#$14BBitcoinOptionsExpireFriday
4,296 vues
92 mentions
5
#BNBMarketCapPassesBNYMellon
32,940 vues
745 mentions
6
#CryptoMarketCapReclaims$3Trillion
5,648 vues
83 mentions
7
#MuseOvertakesChatGPTAsTopFreeIOSApp
19,098 vues
550 mentions
8
#TokenizedStockPlatformsCouldLaunchNextQuarter
30,097 vues
604 mentions
9
#StrategyAdds950Bitcoin
37,631 vues
696 mentions
10
#CardanoAddedToX402KitForADAPayments
31,332 vues
669 mentions