
#us30yearyieldhitshighestsince2002
us30yearyieldhitshighestsince2002
36,240 vues
509 mentions
Populaire
Récents

Vérifié
#us30yearyieldhitshighestsince2002
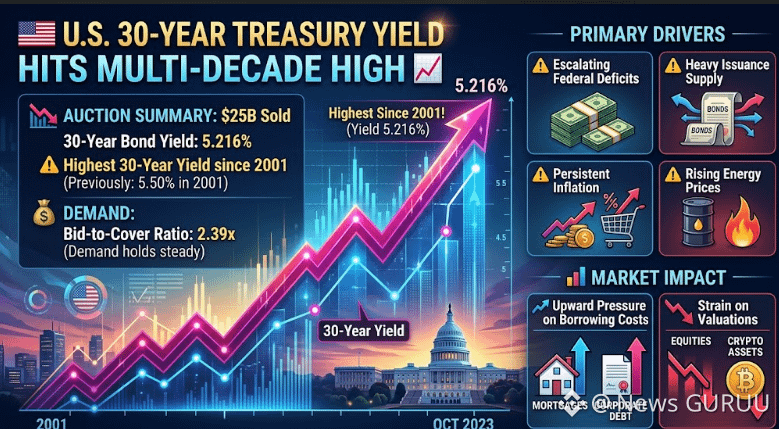
🚨 U.S. 30-YEAR TREASURY YIELD HITS MULTI-DECADE HIGH 📈
The U.S. sold $25B in 30-year bonds at a 5.216% yield, the highest borrowing cost since 2001. Demand remained steady at 2.39x, but rising deficits, inflation and energy prices are keeping yields elevated.
Higher long-term yields increase borrowing costs and can pressure stocks and crypto valuations.
🎯 TRADING VIEW: BUY🔥
Rising yields create a bearish headwind for risk assets. Watch Treasury yields and inflation data closely.
❓ Will higher yields trigger a deeper risk-asset correction? "CLICK ON THE BELOW YELLOW COIN TAG TO GO TO DESIRED TRADING PAGE TO GET BENEFIT TRADE"$ACE $VELVET
#TreasuryYields #CryptoMarket
🚨 U.S. 30-YEAR TREASURY YIELD HITS MULTI-DECADE HIGH 📈
The U.S. sold $25B in 30-year bonds at a 5.216% yield, the highest borrowing cost since 2001. Demand remained steady at 2.39x, but rising deficits, inflation and energy prices are keeping yields elevated.
Higher long-term yields increase borrowing costs and can pressure stocks and crypto valuations.
🎯 TRADING VIEW: BUY🔥
Rising yields create a bearish headwind for risk assets. Watch Treasury yields and inflation data closely.
❓ Will higher yields trigger a deeper risk-asset correction? "CLICK ON THE BELOW YELLOW COIN TAG TO GO TO DESIRED TRADING PAGE TO GET BENEFIT TRADE"$ACE $VELVET
#TreasuryYields #CryptoMarket

Contesté
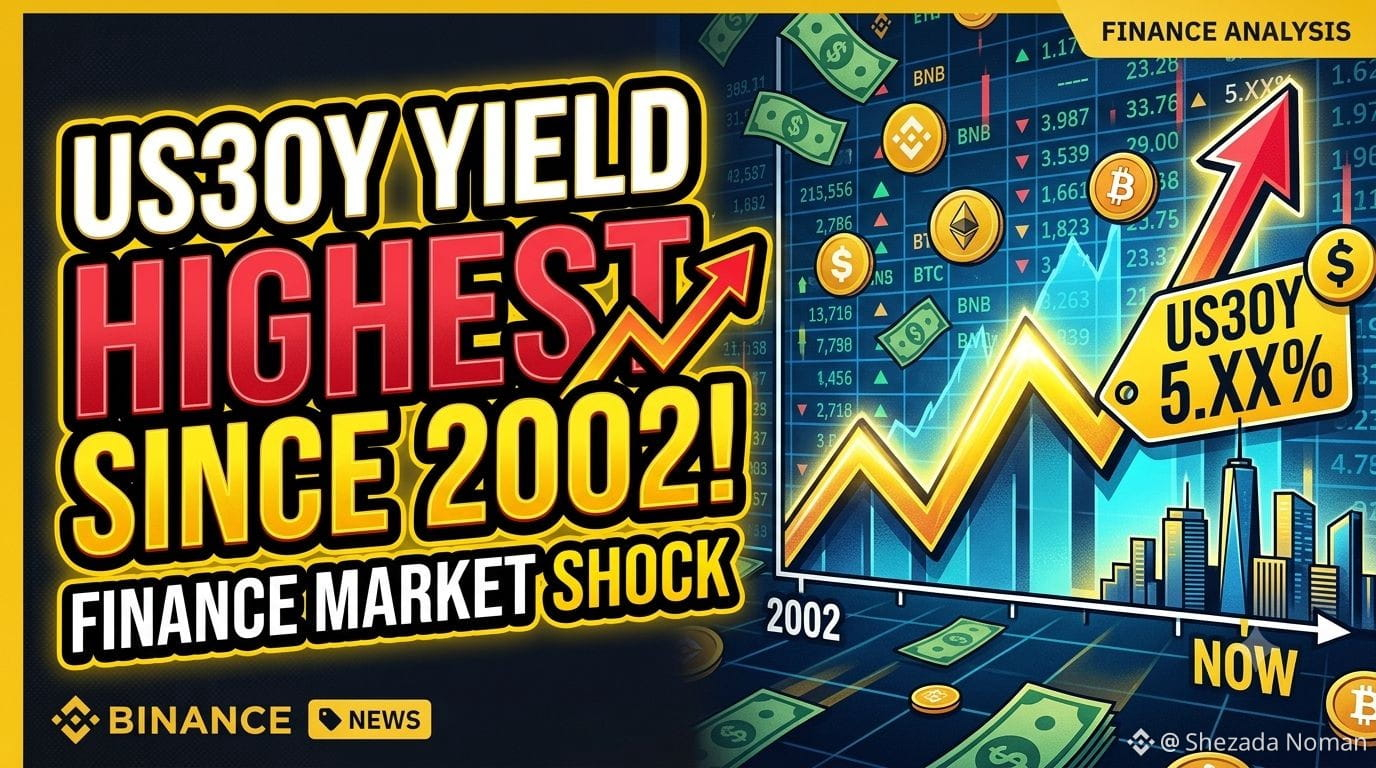
😱💥 SHOCKING: A 2002-LEVEL YIELD IS BACK
The 30-year Treasury yield has climbed to a level not seen since 2002.
Instead of celebrating the move, investors should focus on what it signals: higher long-term financing costs and potentially greater pressure on already-stretched debt markets.
📉 If yields remain elevated, volatility could spread across bonds, stocks and currencies.
Keep $BTC, $BNB and $ETH on the radar through spot markets, not leverage.
#us30yearyieldhitshighestsince2002
The 30-year Treasury yield has climbed to a level not seen since 2002.
Instead of celebrating the move, investors should focus on what it signals: higher long-term financing costs and potentially greater pressure on already-stretched debt markets.
📉 If yields remain elevated, volatility could spread across bonds, stocks and currencies.
Keep $BTC, $BNB and $ETH on the radar through spot markets, not leverage.
#us30yearyieldhitshighestsince2002
🚨🌍 ALARMING: DEBT PRESSURE IS GETTING HARDER TO IGNORE
A 30-year yield at its highest level since 2002 highlights how difficult long-term debt conditions have become.
Higher financing costs can squeeze borrowers, discourage investment and put additional pressure on economies carrying heavy debt loads.
⚡ If this continues, the shock may not remain confined to bond markets.
Global investors should watch liquidity and risk appetite closely, including $BTC, $ETH and $BNB in spot markets.
#us30yearyieldhitshighestsince2002
A 30-year yield at its highest level since 2002 highlights how difficult long-term debt conditions have become.
Higher financing costs can squeeze borrowers, discourage investment and put additional pressure on economies carrying heavy debt loads.
⚡ If this continues, the shock may not remain confined to bond markets.
Global investors should watch liquidity and risk appetite closely, including $BTC, $ETH and $BNB in spot markets.
#us30yearyieldhitshighestsince2002
⚠️📈 WARNING: 30-YEAR YIELDS ARE FLASHING RED
The U.S. 30-year Treasury yield has reached its highest level since 2002, highlighting growing pressure in long-term debt markets.
Higher yields can increase borrowing costs and create additional stress for households, businesses and economies already dealing with expensive financing.
🌍 The consequences can extend well beyond the U.S. through global bonds, currencies and capital flows.
Watch $BTC, $ETH and $BNB with disciplined spot exposure.
#us30yearyieldhitshighestsince2002
The U.S. 30-year Treasury yield has reached its highest level since 2002, highlighting growing pressure in long-term debt markets.
Higher yields can increase borrowing costs and create additional stress for households, businesses and economies already dealing with expensive financing.
🌍 The consequences can extend well beyond the U.S. through global bonds, currencies and capital flows.
Watch $BTC, $ETH and $BNB with disciplined spot exposure.
#us30yearyieldhitshighestsince2002

#US30YearYieldHitsHighestSince2002 U.S. 30-Year Treasury Yield Hits Highest Level Since 2002
A major move in the bond market is grabbing investors’ attention as the U.S. 30-year Treasury yield climbs to its highest level since 2002. 🇺🇸
Higher long-term yields can put pressure on equities, increase borrowing costs, and tighten financial conditions across the economy. It also signals that bond investors are demanding greater compensation for long-term inflation, fiscal, and interest-rate risks.
👀 Markets will now be watching whether yields continue higher or begin to stabilize. A sustained rise could create additional volatility across stocks, bonds, currencies, and crypto.#US30YearYieldHitsHighestSince2002 $NVDA.US
$USDC
A major move in the bond market is grabbing investors’ attention as the U.S. 30-year Treasury yield climbs to its highest level since 2002. 🇺🇸
Higher long-term yields can put pressure on equities, increase borrowing costs, and tighten financial conditions across the economy. It also signals that bond investors are demanding greater compensation for long-term inflation, fiscal, and interest-rate risks.
👀 Markets will now be watching whether yields continue higher or begin to stabilize. A sustained rise could create additional volatility across stocks, bonds, currencies, and crypto.#US30YearYieldHitsHighestSince2002 $NVDA.US
$USDC

USDC+0,00%
NVDAUS-0,15%

#US30YearYieldHitsHighestSince2002
📈US 30-Year Treasure Yield Hits Its Highest Level Since 2002
the bond market is sending a signal investors
shouldn't ignore.
A sharp rise in the 30-year Treasury yield highlights growing concerns around inflation, government borrowing, fiscal pressure, and the long-term cost of debt.
why does this matter?🌐
Higher yields can increase borrowing costs across the economy and influence stocks, technology valuations, AI investments, and crypto markets.
It's a powerful reminder that financial markets are deeply connected.
SMART INVESTORS DON'T JUST WATCH PRICES_THEY UNDERSTAND THE FORCES BEHIND THEM.
Stay informed. Think long-term. Keep learning.
#markets
#Finance
#US30YearYieldHitsHighestSince2002
📈US 30-Year Treasure Yield Hits Its Highest Level Since 2002
the bond market is sending a signal investors
shouldn't ignore.
A sharp rise in the 30-year Treasury yield highlights growing concerns around inflation, government borrowing, fiscal pressure, and the long-term cost of debt.
why does this matter?🌐
Higher yields can increase borrowing costs across the economy and influence stocks, technology valuations, AI investments, and crypto markets.
It's a powerful reminder that financial markets are deeply connected.
SMART INVESTORS DON'T JUST WATCH PRICES_THEY UNDERSTAND THE FORCES BEHIND THEM.
Stay informed. Think long-term. Keep learning.
#markets
#Finance
#US30YearYieldHitsHighestSince2002

#US30YearYieldHitsHighestSince2002
📈 #US30YearYieldHitsHighestSince2002 — Bond Market Sends a Strong Signal
The U.S. 30-year Treasury yield has reached its highest level since 2002, putting long-term borrowing costs and inflation expectations firmly back in focus.
Higher yields can make bonds more attractive relative to risk assets, potentially putting pressure on stocks and crypto while supporting the dollar.
#Bonds #Bitcoin #Crypto $USDT $ETH
📈 #US30YearYieldHitsHighestSince2002 — Bond Market Sends a Strong Signal
The U.S. 30-year Treasury yield has reached its highest level since 2002, putting long-term borrowing costs and inflation expectations firmly back in focus.
Higher yields can make bonds more attractive relative to risk assets, potentially putting pressure on stocks and crypto while supporting the dollar.
#Bonds #Bitcoin #Crypto $USDT $ETH

$BTW $VELVET $ACE
📈 U.S. 30-Year Treasury Yield Hits Multi-Decade High.
The U.S. Treasury sold $25B in 30-year bonds at an auction yield of 5.216%, marking the highest borrowing cost for 30-year U.S. debt since 2001.
💰 Bid-to-Cover Ratio: 2.39x — demand held steady despite soaring yields.
⚠️ Primary Drivers: Escalating federal deficits, heavy issuance supply, persistent inflation pressures, and rising energy prices.
📊 Market Impact: Spikes in long-term risk-free rates put upward pressure on borrowing costs (mortgages, corporate debt) and strain valuations for equities and crypto assets.
#US30YearYieldHitsHighestSince2002
📈 U.S. 30-Year Treasury Yield Hits Multi-Decade High.
The U.S. Treasury sold $25B in 30-year bonds at an auction yield of 5.216%, marking the highest borrowing cost for 30-year U.S. debt since 2001.
💰 Bid-to-Cover Ratio: 2.39x — demand held steady despite soaring yields.
⚠️ Primary Drivers: Escalating federal deficits, heavy issuance supply, persistent inflation pressures, and rising energy prices.
📊 Market Impact: Spikes in long-term risk-free rates put upward pressure on borrowing costs (mortgages, corporate debt) and strain valuations for equities and crypto assets.
#US30YearYieldHitsHighestSince2002

#US30YearYieldHitsHighestSince2002
U.S. 30-Year Yields Tap Multi-Decade Highs — What It Means for Risk Assets 📈💥
Long-term borrowing costs just hit levels not seen since 2002, with the U.S. 30-Year Treasury yield spiking above 5.32%.
When government debt offers risk-free yields this high, global liquidity tightens, and the ripple effects hit everything from equities to crypto.
What’s Driving the Spike? 🔍
Fiscal Debt & Issuance Overhang: Massive ongoing Treasury supply is flooding the bond market, forcing yields higher to attract institutional buyers.
Sticky Inflation & Commodity Pressures: Elevated energy prices and geopolitical friction continue to fuel concerns that inflation won't come down easily, delaying hopes for aggressive rate cuts.
Global Bond Sell-Off: Heavy selling in long-dated debt isn't just a U.S. phenomenon—sovereign yields across Europe and Asia are seeing similar upward pressure.
The Impact on Crypto & Risk-On Sentiment ⚠️
Liquidity Drain: When risk-free assets yield over 5.3%, institutional capital becomes far more selective, increasing the hurdle rate for speculative bets.
Higher Volatility Ahead: Tighter global financial conditions typically test short-term support levels across altcoins and tech stocks.
The Long-Term Hedge Case: On the flip side, compounding sovereign debt and runaway deficits reinforce the long-term narrative for scarce, decentralized assets like Bitcoin.
Keep position sizes reasonable and watch for broader market volatility while yields stay elevated. 🛡️
U.S. 30-Year Yields Tap Multi-Decade Highs — What It Means for Risk Assets 📈💥
Long-term borrowing costs just hit levels not seen since 2002, with the U.S. 30-Year Treasury yield spiking above 5.32%.
When government debt offers risk-free yields this high, global liquidity tightens, and the ripple effects hit everything from equities to crypto.
What’s Driving the Spike? 🔍
Fiscal Debt & Issuance Overhang: Massive ongoing Treasury supply is flooding the bond market, forcing yields higher to attract institutional buyers.
Sticky Inflation & Commodity Pressures: Elevated energy prices and geopolitical friction continue to fuel concerns that inflation won't come down easily, delaying hopes for aggressive rate cuts.
Global Bond Sell-Off: Heavy selling in long-dated debt isn't just a U.S. phenomenon—sovereign yields across Europe and Asia are seeing similar upward pressure.
The Impact on Crypto & Risk-On Sentiment ⚠️
Liquidity Drain: When risk-free assets yield over 5.3%, institutional capital becomes far more selective, increasing the hurdle rate for speculative bets.
Higher Volatility Ahead: Tighter global financial conditions typically test short-term support levels across altcoins and tech stocks.
The Long-Term Hedge Case: On the flip side, compounding sovereign debt and runaway deficits reinforce the long-term narrative for scarce, decentralized assets like Bitcoin.
Keep position sizes reasonable and watch for broader market volatility while yields stay elevated. 🛡️

#dusk $DUSK #US30YearYieldHitsHighestSince2002
جی، اس خبر پر Binance/crypto audience کے لیے ایک strong اور professional English post یہ رہی۔ موجودہ رپورٹس کے مطابق 30-year U.S. Treasury yield تقریباً 5.3% تک پہنچی اور جون 2007 کے بعد بلند ترین سطح دیکھی گئی؛ بلند yields stocks اور crypto جیسے risk assets پر دباؤ ڈال سکتی ہیں۔
🚨 US 30-Year Treasury Yield Hits Multi-Year High! 🇺🇸📈
US30YearYield is back above 5.3%,5.3%$NVDAB
reaching levels not seen since 2007. 📊
This is a major signal for global markets.
Higher long-term yields can mean:
💰 Higher borrowing costs
📉 Pressure on stock valuations
⚠️ More volatility across risk assets
🌎 Increased uncertainty in global markets
Investors are watching inflation expectations, government debt, Treasury issuance, and geopolitical risks closely.
For crypto traders, this is another reason to keep an eye on BTC, ETH, DXY and U.S. Treasury yields before taking aggressive positions. 👀
The market can move fast when liquidity and risk appetite change.
Stay alert. Protect your capital. Manage risk DYOR#DYOR42711 . 🚨
Cryptoypto BTC ETH Bitcoin #TradingTales ing S30YearYield Treasury #StockMarket Macro
https://www.binance.com/activity/referral-entry/CPA?ref=CPA_00U4Q681WA
جی، اس خبر پر Binance/crypto audience کے لیے ایک strong اور professional English post یہ رہی۔ موجودہ رپورٹس کے مطابق 30-year U.S. Treasury yield تقریباً 5.3% تک پہنچی اور جون 2007 کے بعد بلند ترین سطح دیکھی گئی؛ بلند yields stocks اور crypto جیسے risk assets پر دباؤ ڈال سکتی ہیں۔
🚨 US 30-Year Treasury Yield Hits Multi-Year High! 🇺🇸📈
US30YearYield is back above 5.3%,5.3%$NVDAB
reaching levels not seen since 2007. 📊
This is a major signal for global markets.
Higher long-term yields can mean:
💰 Higher borrowing costs
📉 Pressure on stock valuations
⚠️ More volatility across risk assets
🌎 Increased uncertainty in global markets
Investors are watching inflation expectations, government debt, Treasury issuance, and geopolitical risks closely.
For crypto traders, this is another reason to keep an eye on BTC, ETH, DXY and U.S. Treasury yields before taking aggressive positions. 👀
The market can move fast when liquidity and risk appetite change.
Stay alert. Protect your capital. Manage risk DYOR#DYOR42711 . 🚨
Cryptoypto BTC ETH Bitcoin #TradingTales ing S30YearYield Treasury #StockMarket Macro
https://www.binance.com/activity/referral-entry/CPA?ref=CPA_00U4Q681WA

#US30YearYieldHitsHighestSince2002
The U.S. 30-year Treasury yield surged to a peak of 5.337% on Tuesday, August 18, 2026, marking its highest level since 2007. While some social media commentary under the hashtag #US30YearYieldHitsHighestSince2002 references the year 2002, official financial data confirms this spike is actually a 19-year high, mirroring levels not seen since April 2007.The drastic move has directly reshaped borrowing costs across the economy before a surprise policy announcement triggered a sharp intraday reversal.$DF $GAL
The U.S. 30-year Treasury yield surged to a peak of 5.337% on Tuesday, August 18, 2026, marking its highest level since 2007. While some social media commentary under the hashtag #US30YearYieldHitsHighestSince2002 references the year 2002, official financial data confirms this spike is actually a 19-year high, mirroring levels not seen since April 2007.The drastic move has directly reshaped borrowing costs across the economy before a surprise policy announcement triggered a sharp intraday reversal.$DF $GAL

#us30yearyieldhitshighestsince2002 US
TREASURY DOUBLES LONG-TERM DEBT BUYBACKS AFTER YIELDS HIT MULTI-DECADE HIGHS
The
US Treasury unexpectedly announced it will at least double the size of its liquidity-support buybacks for 10- to 30-year
government debt, increasing the maximum from $2 billion to at least
$4 billion per operation beginning September 9.
The move comes after the 30-year yield surged to roughly 5.34%, its highest level since 2007.
Long-term Treasurys immediately rallied on the announcement, sending the 30-year yield back toward 5.2%.
Treasury says the purchases are intended to improve liquidity in older, less-liquid government debt. In reality, this is an artificial way to suppress yields.
Expect the move to reignite the debate over whether Treasury buybacks are effectively a form of “mini-QE.”$SUI $DOT $RENDER
TREASURY DOUBLES LONG-TERM DEBT BUYBACKS AFTER YIELDS HIT MULTI-DECADE HIGHS
The
US Treasury unexpectedly announced it will at least double the size of its liquidity-support buybacks for 10- to 30-year
government debt, increasing the maximum from $2 billion to at least
$4 billion per operation beginning September 9.
The move comes after the 30-year yield surged to roughly 5.34%, its highest level since 2007.
Long-term Treasurys immediately rallied on the announcement, sending the 30-year yield back toward 5.2%.
Treasury says the purchases are intended to improve liquidity in older, less-liquid government debt. In reality, this is an artificial way to suppress yields.
Expect the move to reignite the debate over whether Treasury buybacks are effectively a form of “mini-QE.”$SUI $DOT $RENDER

#us30yearyieldhitshighestsince2002 JUST IN
🚨
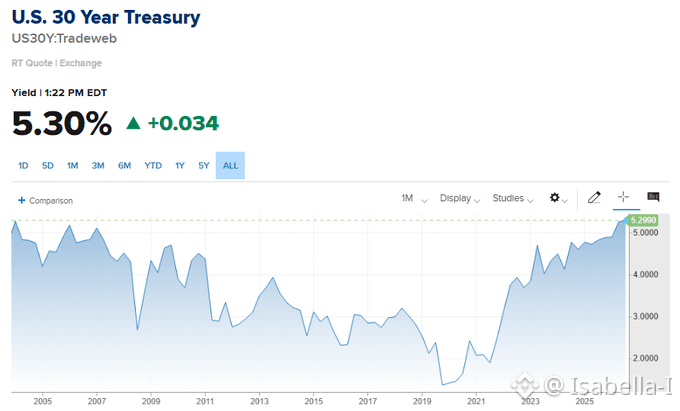
: U.S. 30-Year Treasury Yield hits 5.30% for the first time since the run-up to the Global Financial Crisis
🤯👀$CFG $NBISB $AXTIB
🚨
: U.S. 30-Year Treasury Yield hits 5.30% for the first time since the run-up to the Global Financial Crisis
🤯👀$CFG $NBISB $AXTIB
#us30yearyieldhitshighestsince2002 🤔
The 30-year bond is at its highest yield since
2007. Everyone says it's the end of the world inflation, bond vigilantes, government debt spiraling, foreign buyers fleeing.
Twenty basis points. That's how much it's moved in three years. If the world was ending, it would have moved a lot more than that.
What's actually happening: the yield curve got distorted when the Fed held rates too high for too long. Now it's trying to go back to normal. The short end wants to fall. The long end goes slightly up because the Fed won't get out of the way at the front. That's it. Curve normalization. Same thing happened in 2001, 2008, 2018, 2023. Every time, people screamed about the same things. Every time, they were wrong.
The guy who's been documenting this for twenty years says the bond market can't fix government spending. He's right about that. What he doesn't know is that something else can and it's already working. It just doesn't show up on the yield curve.$GPS $PORTAL $TUT
The 30-year bond is at its highest yield since
2007. Everyone says it's the end of the world inflation, bond vigilantes, government debt spiraling, foreign buyers fleeing.
Twenty basis points. That's how much it's moved in three years. If the world was ending, it would have moved a lot more than that.
What's actually happening: the yield curve got distorted when the Fed held rates too high for too long. Now it's trying to go back to normal. The short end wants to fall. The long end goes slightly up because the Fed won't get out of the way at the front. That's it. Curve normalization. Same thing happened in 2001, 2008, 2018, 2023. Every time, people screamed about the same things. Every time, they were wrong.
The guy who's been documenting this for twenty years says the bond market can't fix government spending. He's right about that. What he doesn't know is that something else can and it's already working. It just doesn't show up on the yield curve.$GPS $PORTAL $TUT
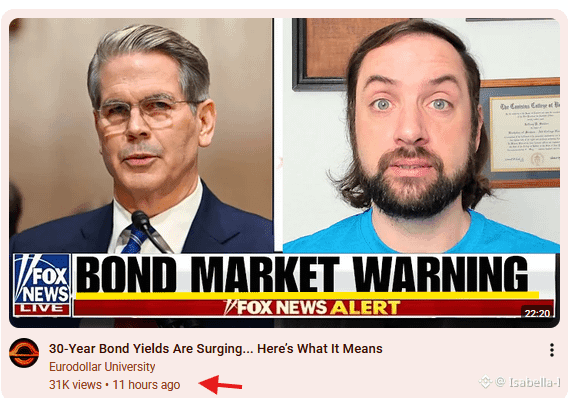
🔮📊 PREDICTION: HIGHER YIELDS COULD MEAN MORE VOLATILITY
If the 30-year yield remains around multi-decade highs, global investors could continue reassessing expensive assets and increasing exposure to safer or more liquid alternatives.
That could create further pressure across equities and credit markets while increasing volatility in currencies and crypto.
🌍 The key isn't the headline number — it's how long the pressure lasts.
Watch $BTC, $ETH and $BNB with a long-term, spot-focused approach.
#us30yearyieldhitshighestsince2002
If the 30-year yield remains around multi-decade highs, global investors could continue reassessing expensive assets and increasing exposure to safer or more liquid alternatives.
That could create further pressure across equities and credit markets while increasing volatility in currencies and crypto.
🌍 The key isn't the headline number — it's how long the pressure lasts.
Watch $BTC, $ETH and $BNB with a long-term, spot-focused approach.
#us30yearyieldhitshighestsince2002

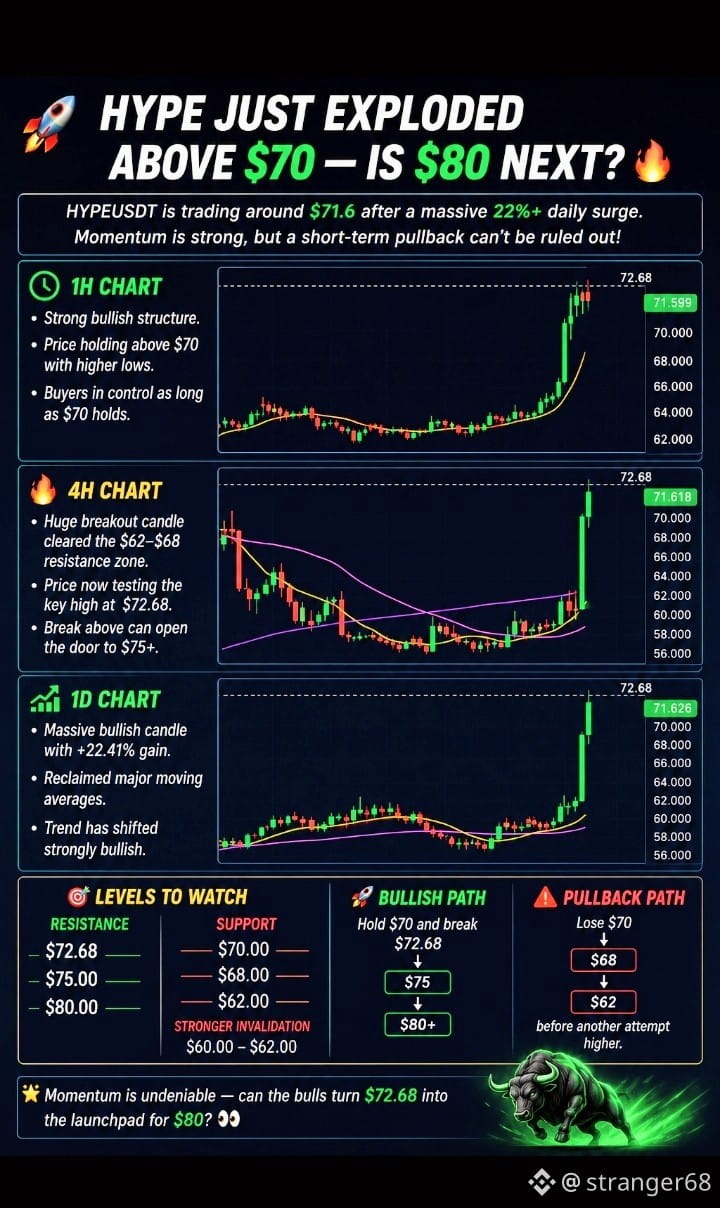
🚀 $HYPE JUST EXPLODED ABOVE $70 — IS $80 NEXT?
The chart is showing a powerful breakout, with price now around $71.6 after a massive 22%+ daily move. Momentum is clearly with the bulls, but after such a sharp expansion, a healthy retest could come before the next leg higher.
📊 1H:
Strong bullish structure with price holding above the $70 area. As long as this zone remains support, buyers have the advantage.
🔥 4H:
A huge breakout candle pushed through the $62–$68 resistance region. Price is now testing the $72.68 high, making this the immediate breakout zone.
📈 1D:
The daily candle has completely shifted momentum, reclaiming the major moving averages and printing a strong 22.41% gain. Trend remains aggressively bullish.
🎯 Levels to watch:
• Resistance: $72.68 → $75 → $80
• Support: $70 → $68 → $62
• Stronger invalidation zone: $60–$62
Bullish path: Hold $70 and break $72.68 → $75 → $80 🚀
Pullback path: Lose $70 → possible retest of $68/$62 before another attempt higher.
The momentum is undeniable — but can the bulls turn $72.68 into the launchpad for $80? 👀
#USStorageStocksExtendLosses #CryptoRally #UAESaysItDetectedTwoIranianBallisticMissiles #US30YearYieldHitsHighestSince2002
The chart is showing a powerful breakout, with price now around $71.6 after a massive 22%+ daily move. Momentum is clearly with the bulls, but after such a sharp expansion, a healthy retest could come before the next leg higher.
📊 1H:
Strong bullish structure with price holding above the $70 area. As long as this zone remains support, buyers have the advantage.
🔥 4H:
A huge breakout candle pushed through the $62–$68 resistance region. Price is now testing the $72.68 high, making this the immediate breakout zone.
📈 1D:
The daily candle has completely shifted momentum, reclaiming the major moving averages and printing a strong 22.41% gain. Trend remains aggressively bullish.
🎯 Levels to watch:
• Resistance: $72.68 → $75 → $80
• Support: $70 → $68 → $62
• Stronger invalidation zone: $60–$62
Bullish path: Hold $70 and break $72.68 → $75 → $80 🚀
Pullback path: Lose $70 → possible retest of $68/$62 before another attempt higher.
The momentum is undeniable — but can the bulls turn $72.68 into the launchpad for $80? 👀
#USStorageStocksExtendLosses #CryptoRally #UAESaysItDetectedTwoIranianBallisticMissiles #US30YearYieldHitsHighestSince2002

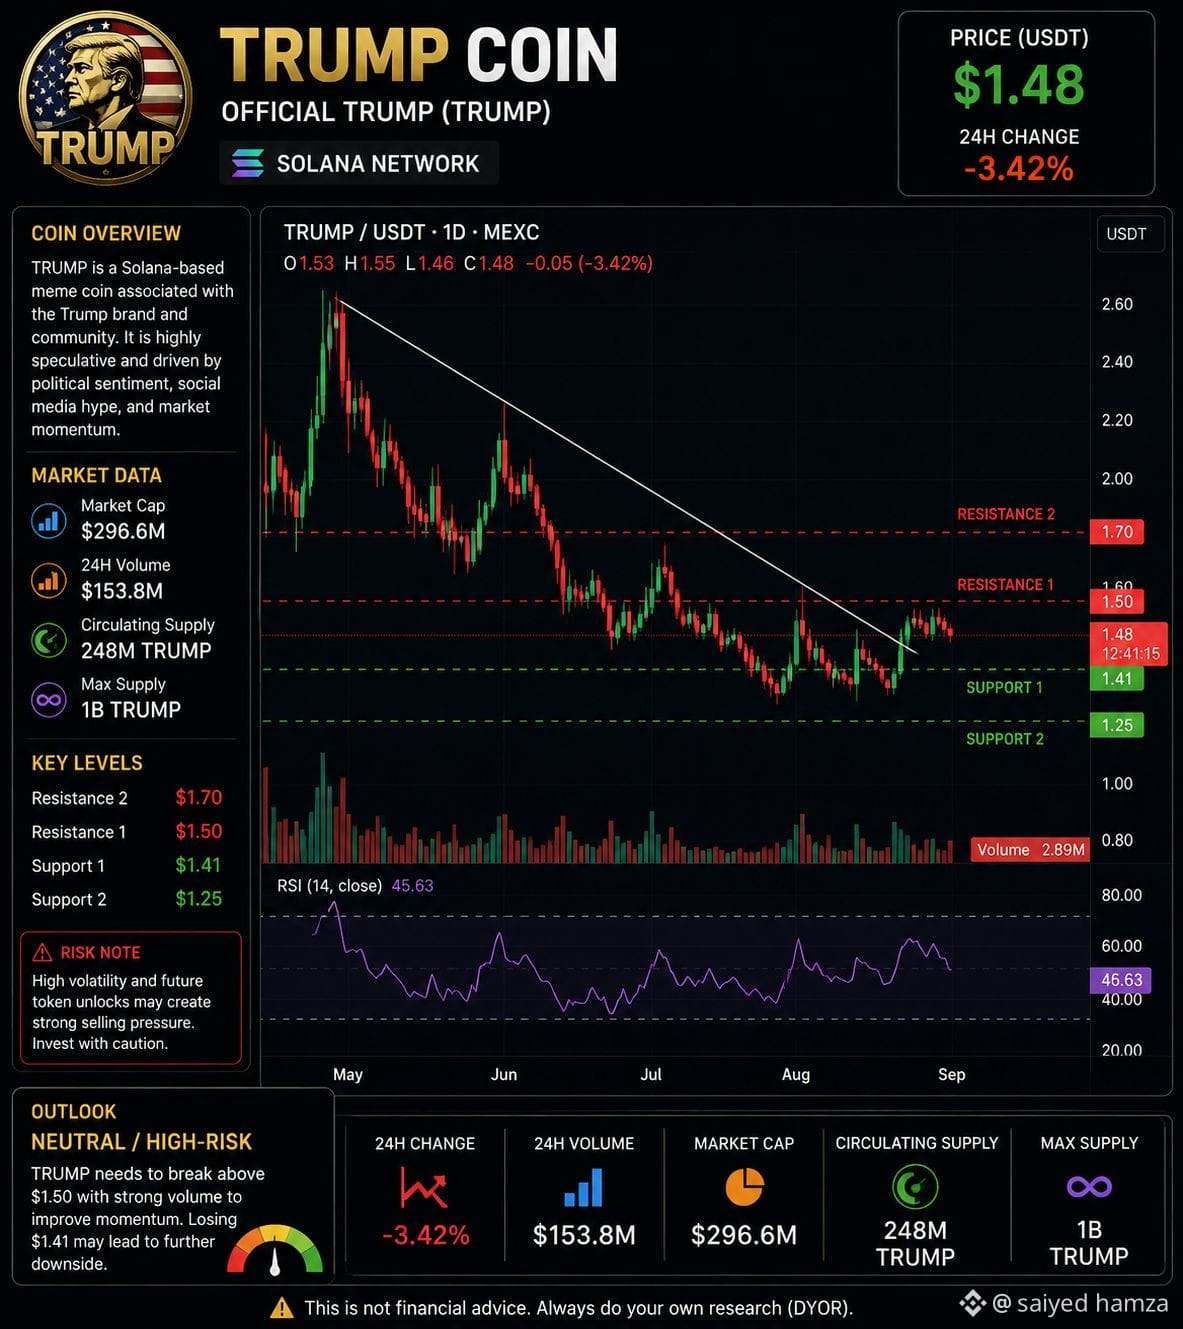
$TRUMP
Official Trump (TRUMP) is a Solana-based political meme coin. It is highly sentiment-driven and can react sharply to political news and social-media activity.
Current price: Around $1.47–$1.49.
Momentum: Recent trading is relatively weak, with selling pressure and high volatility.
Key support: Around $1.41–$1.45.
Resistance: Around $1.50, followed by higher psychological levels.
Major risk: Only about 248 million of the 1 billion maximum supply is circulating, so future token releases can create supply pressure.
Long-term: The coin remains highly speculative and is strongly dependent on the Trump political narrative.
Overall: 🟡 High-risk / neutral — a sustained break above $1.50 could improve momentum, while losing $1.41 would weaken the setup.
#CryptoRally #ColdcardTheftInvestigationAdvances #FOMCWatch #UAESaysItDetectedTwoIranianBallisticMissiles #US30YearYieldHitsHighestSince2002
Official Trump (TRUMP) is a Solana-based political meme coin. It is highly sentiment-driven and can react sharply to political news and social-media activity.
Current price: Around $1.47–$1.49.
Momentum: Recent trading is relatively weak, with selling pressure and high volatility.
Key support: Around $1.41–$1.45.
Resistance: Around $1.50, followed by higher psychological levels.
Major risk: Only about 248 million of the 1 billion maximum supply is circulating, so future token releases can create supply pressure.
Long-term: The coin remains highly speculative and is strongly dependent on the Trump political narrative.
Overall: 🟡 High-risk / neutral — a sustained break above $1.50 could improve momentum, while losing $1.41 would weaken the setup.
#CryptoRally #ColdcardTheftInvestigationAdvances #FOMCWatch #UAESaysItDetectedTwoIranianBallisticMissiles #US30YearYieldHitsHighestSince2002
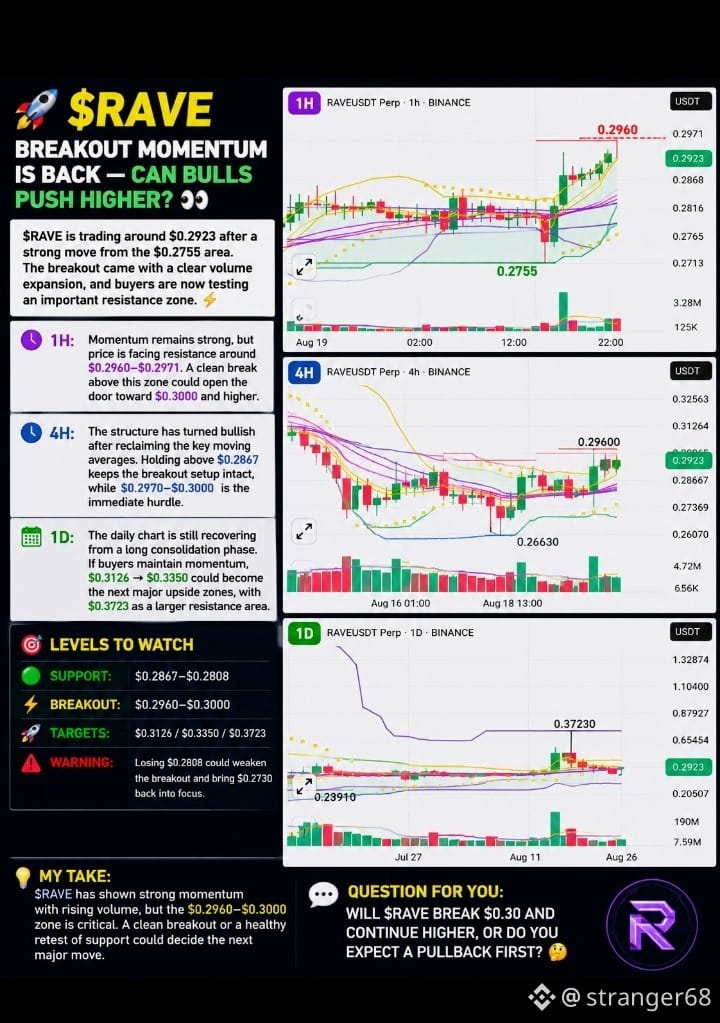
🚀 $RAVE Breakout Momentum Is Back — Can Bulls Push Higher? 👀
$RAVE is trading around $0.2923 after a strong move from the $0.2755 area. The breakout came with clear volume expansion, and buyers are now testing an important resistance zone. ⚡
⏱️ 1H: Momentum remains strong, but price is facing resistance around $0.2960–$0.2971. A clean break above this zone could open the door toward $0.3000 and higher.
🕓 4H: The structure has turned bullish after reclaiming key moving averages. Holding above $0.2867 keeps the breakout setup intact, while $0.2970–$0.3000 remains the immediate hurdle.
📅 1D: The daily chart is recovering from a long consolidation phase. If buyers maintain momentum, $0.3126 → $0.3350 could become the next major upside zones, with $0.3723 as a larger resistance area.
🎯 Levels to watch
🟢 Support: $0.2867–$0.2808
⚡ Breakout: $0.2960–$0.3000
🚀 Targets: $0.3126 / $0.3350 / $0.3723
🔻 Warning: Losing $0.2808 could weaken the breakout and bring $0.2730 back into focus.
📌 My take: The token has shown strong momentum with rising volume, but the $0.2960–$0.3000 zone is critical. A clean breakout or healthy retest of support could decide the next major move.
💬 Will $RAVE break $0.30 and continue higher, or do you expect a pullback first?
#USStorageStocksExtendLosses #US30YearYieldHitsHighestSince2002 #UAESaysItDetectedTwoIranianBallisticMissiles #CryptoRally
$RAVE is trading around $0.2923 after a strong move from the $0.2755 area. The breakout came with clear volume expansion, and buyers are now testing an important resistance zone. ⚡
⏱️ 1H: Momentum remains strong, but price is facing resistance around $0.2960–$0.2971. A clean break above this zone could open the door toward $0.3000 and higher.
🕓 4H: The structure has turned bullish after reclaiming key moving averages. Holding above $0.2867 keeps the breakout setup intact, while $0.2970–$0.3000 remains the immediate hurdle.
📅 1D: The daily chart is recovering from a long consolidation phase. If buyers maintain momentum, $0.3126 → $0.3350 could become the next major upside zones, with $0.3723 as a larger resistance area.
🎯 Levels to watch
🟢 Support: $0.2867–$0.2808
⚡ Breakout: $0.2960–$0.3000
🚀 Targets: $0.3126 / $0.3350 / $0.3723
🔻 Warning: Losing $0.2808 could weaken the breakout and bring $0.2730 back into focus.
📌 My take: The token has shown strong momentum with rising volume, but the $0.2960–$0.3000 zone is critical. A clean breakout or healthy retest of support could decide the next major move.
💬 Will $RAVE break $0.30 and continue higher, or do you expect a pullback first?
#USStorageStocksExtendLosses #US30YearYieldHitsHighestSince2002 #UAESaysItDetectedTwoIranianBallisticMissiles #CryptoRally
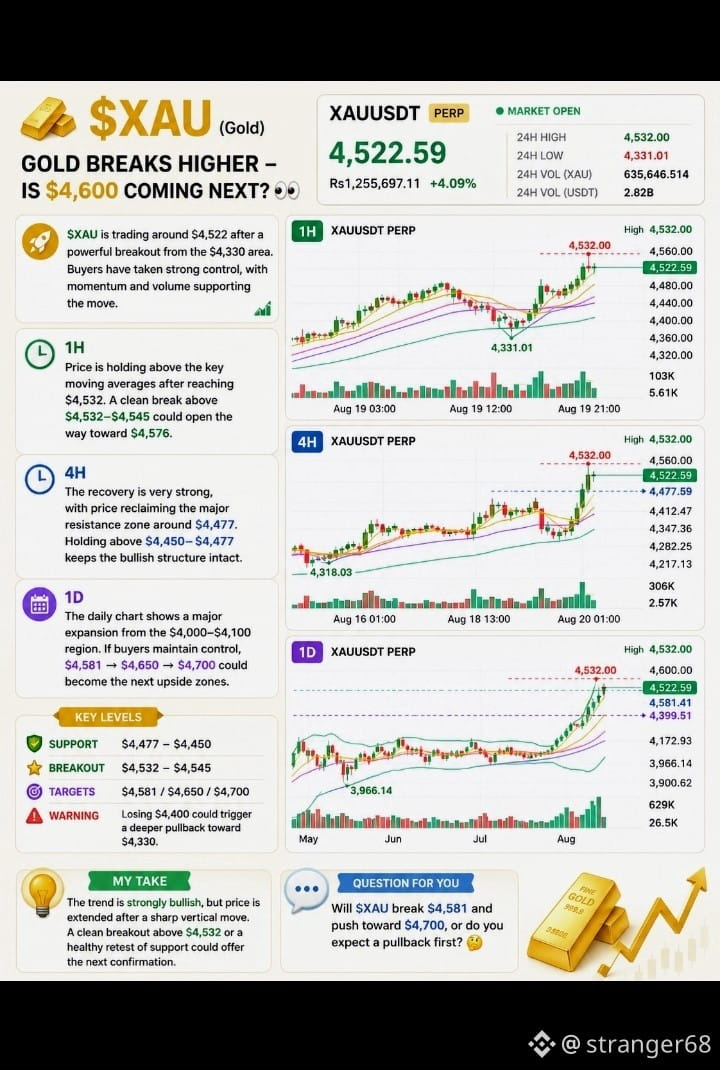
🔥 $XAU Gold Breaks Higher — Is $4,600 Coming Next? 👀
$XAU is trading around $4,522 after a powerful breakout from the $4,330 area. Buyers have taken strong control, with momentum and volume supporting the move. ⚡
⏱️ 1H: Price is holding above the key moving averages after reaching $4,532. A clean break above $4,532–$4,545 could open the way toward $4,576.
🕓 4H: The recovery is very strong, with price reclaiming the major resistance zone around $4,477. Holding above $4,450–$4,477 keeps the bullish structure intact.
📅 1D: The daily chart shows a major expansion from the $4,000–$4,100 region. If buyers maintain control, $4,581 → $4,650 → $4,700 could become the next upside zones.
🎯 Levels to watch
🟢 Support: $4,477–$4,450
⚡ Breakout: $4,532–$4,545
🚀 Targets: $4,581 / $4,650 / $4,700
🔻 Warning: Losing $4,400 could trigger a deeper pullback toward $4,330.
📌 My take: The trend is strongly bullish, but price is extended after a sharp vertical move. A clean breakout above $4,532 or a healthy retest of support could offer the next confirmation.
💬 Will $XAU break $4,581 and push toward $4,700, or do you expect a pullback first?
#USStorageStocksExtendLosses #CryptoRally #UAESaysItDetectedTwoIranianBallisticMissiles #US30YearYieldHitsHighestSince2002
$XAU is trading around $4,522 after a powerful breakout from the $4,330 area. Buyers have taken strong control, with momentum and volume supporting the move. ⚡
⏱️ 1H: Price is holding above the key moving averages after reaching $4,532. A clean break above $4,532–$4,545 could open the way toward $4,576.
🕓 4H: The recovery is very strong, with price reclaiming the major resistance zone around $4,477. Holding above $4,450–$4,477 keeps the bullish structure intact.
📅 1D: The daily chart shows a major expansion from the $4,000–$4,100 region. If buyers maintain control, $4,581 → $4,650 → $4,700 could become the next upside zones.
🎯 Levels to watch
🟢 Support: $4,477–$4,450
⚡ Breakout: $4,532–$4,545
🚀 Targets: $4,581 / $4,650 / $4,700
🔻 Warning: Losing $4,400 could trigger a deeper pullback toward $4,330.
📌 My take: The trend is strongly bullish, but price is extended after a sharp vertical move. A clean breakout above $4,532 or a healthy retest of support could offer the next confirmation.
💬 Will $XAU break $4,581 and push toward $4,700, or do you expect a pullback first?
#USStorageStocksExtendLosses #CryptoRally #UAESaysItDetectedTwoIranianBallisticMissiles #US30YearYieldHitsHighestSince2002
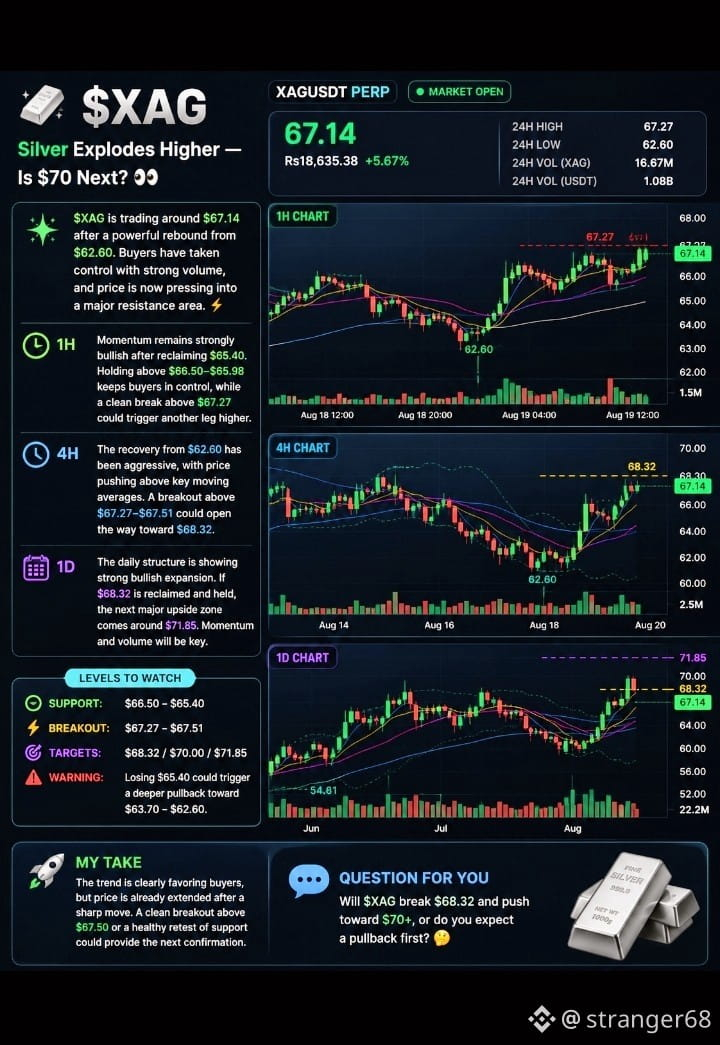
🔥 $XAG Silver Explodes Higher — Is $70 Next? 👀
$XAG is trading around $67.14 after a powerful rebound from $62.60. Buyers have taken control with strong volume, and price is now pressing into a major resistance area. ⚡
⏱️ 1H: Momentum remains strongly bullish after reclaiming $65.40. Holding above $66.50–$65.98 keeps buyers in control, while a clean break above $67.27 could trigger another leg higher.
🕓 4H: The recovery from $62.60 has been aggressive, with price pushing above key moving averages. A breakout above $67.27–$67.51 could open the way toward $68.32.
📅 1D: The daily structure is showing strong bullish expansion. If $68.32 is reclaimed and held, the next major upside zone comes around $71.85. Momentum and volume will be key.
🎯 Levels to watch
🟢 Support: $66.50–$65.40
⚡ Breakout: $67.27–$67.51
🚀 Targets: $68.32 / $70.00 / $71.85
🔻 Warning: Losing $65.40 could trigger a deeper pullback toward $63.70–$62.60.
📌 My take: The trend is clearly favoring buyers, but price is already extended after a sharp move. A clean breakout above $67.50 or a healthy retest of support could provide the next confirmation.
💬 Will $XAG break $68.32 and push toward $70+, or do you expect a pullback first?
#USStorageStocksExtendLosses #CryptoRally #UAESaysItDetectedTwoIranianBallisticMissiles #US30YearYieldHitsHighestSince2002
$XAG is trading around $67.14 after a powerful rebound from $62.60. Buyers have taken control with strong volume, and price is now pressing into a major resistance area. ⚡
⏱️ 1H: Momentum remains strongly bullish after reclaiming $65.40. Holding above $66.50–$65.98 keeps buyers in control, while a clean break above $67.27 could trigger another leg higher.
🕓 4H: The recovery from $62.60 has been aggressive, with price pushing above key moving averages. A breakout above $67.27–$67.51 could open the way toward $68.32.
📅 1D: The daily structure is showing strong bullish expansion. If $68.32 is reclaimed and held, the next major upside zone comes around $71.85. Momentum and volume will be key.
🎯 Levels to watch
🟢 Support: $66.50–$65.40
⚡ Breakout: $67.27–$67.51
🚀 Targets: $68.32 / $70.00 / $71.85
🔻 Warning: Losing $65.40 could trigger a deeper pullback toward $63.70–$62.60.
📌 My take: The trend is clearly favoring buyers, but price is already extended after a sharp move. A clean breakout above $67.50 or a healthy retest of support could provide the next confirmation.
💬 Will $XAG break $68.32 and push toward $70+, or do you expect a pullback first?
#USStorageStocksExtendLosses #CryptoRally #UAESaysItDetectedTwoIranianBallisticMissiles #US30YearYieldHitsHighestSince2002
Connectez-vous pour découvrir plus de contenu