

#rmu
rmu
13 vues
2 mentions
Populaire
Récents

Article
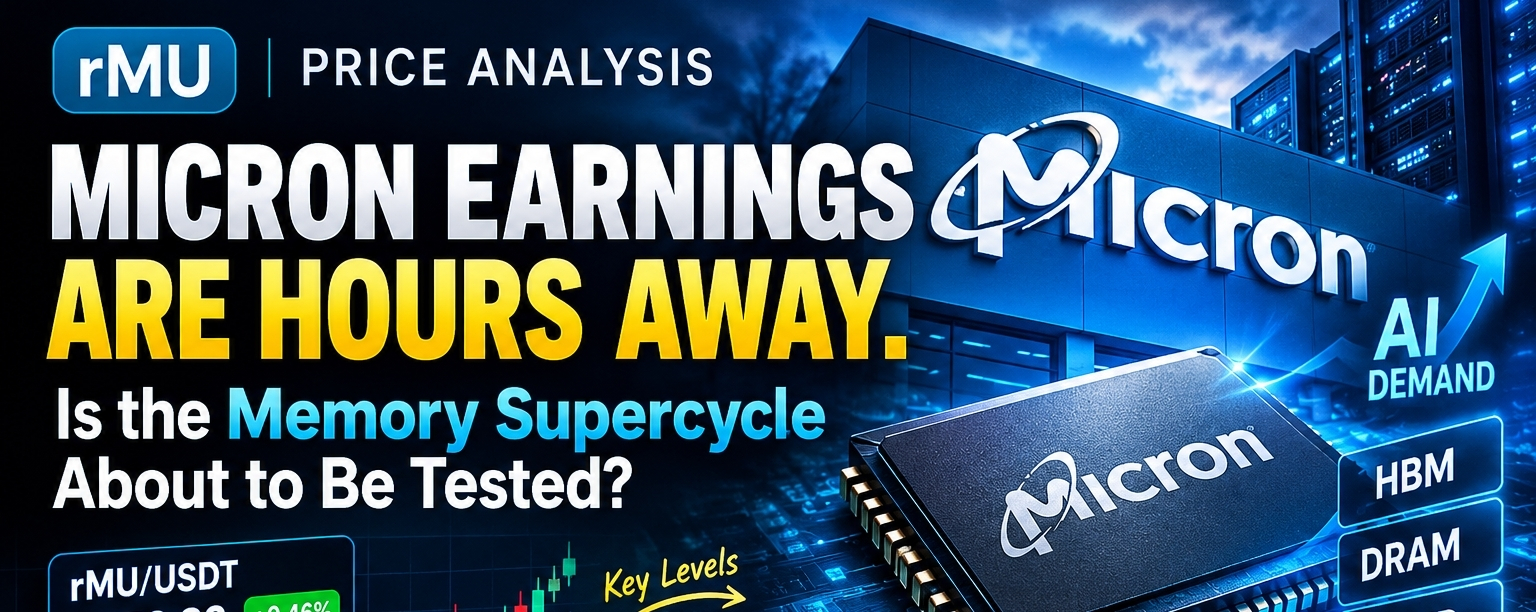
rMU PRICE ANALYSIS: Micron Earnings Are Hours Away. Is the Memory Supercycle About to Be Tested?━━━━━━━━━━━━━━━━━━━━
Some earnings reports move a stock. Others test an entire market narrative.
Today, all eyes are on Micron (MU).
Micron is set to release its Fiscal Q4 2026 earnings after the U.S. market close on September 30 (early October 1 in Asia). Meanwhile, rMU/USDT, the tokenized version of Micron stock is trading near 1,073.88, hovering just below a key resistance zone.
The market already expects strong numbers.
The real question is:
Can the AI-driven memory boom continue to exceed expectations, or has the market already priced in most of the optimism?
Let's break it down.
━━━━━━━━━━━━━━━━━━━━
◆ WHAT IS rMU?
━━━━━━━━━━━━━━━━━━━━
rMU allows crypto traders to gain exposure to Micron Technology through a tokenized asset that tracks MU stock.
✔︎ Designed to follow Micron's share price on a 1:1 basis
✔︎ Issued by Reality, Bitget's licensed RWA platform
✔︎ Built on Arbitrum with on-chain proof-of-asset attestations
✔︎ Backed by underlying shares held through a regulated U.S. broker-dealer
In simple terms: when Micron moves, rMU follows.
━━━━━━━━━━━━━━━━━━━━
◆ WHY THIS EARNINGS REPORT MATTERS ━━━━━━━━━━━━━━━━━━━━
Micron's recent performance has been nothing short of remarkable.
✔︎ Fiscal Q3 revenue reached a record $41.46B, up sharply from the prior year
✔︎ Non-GAAP gross margin expanded to roughly 84.9%
✔︎ Management guided Fiscal Q4 revenue to approximately $50B (±$1B)
✔︎ Shares have reportedly climbed more than 250% in 2026, fueled by AI infrastructure demand and rising memory prices
But here's the challenge:
When expectations become extremely high, even excellent results may not be enough to impress investors.
That's why traders are watching three key areas:
① Fiscal Q1 2027 Guidance – Can growth continue beyond current expectations?
② HBM4 Progress – Shipment volumes, customer adoption, and production timelines.
③ DRAM Pricing & Capex – Are supply constraints still supporting higher prices, and how aggressively is Micron expanding capacity?
━━━━━━━━━━━━━━━━━━━━
◆ FUNDAMENTAL BACKDROP ━━━━━━━━━━━━━━━━━━━━
The broader story remains centered around AI infrastructure demand.
➜ Management has stated that data-center demand can exceed available supply.
➜ HBM production requires significantly more wafer capacity than traditional DRAM, tightening overall memory supply.
➜ Industry conditions may remain constrained well beyond 2027.
➜ Micron recently announced a $2.75B assembly and test facility in India, highlighting its long-term expansion strategy.
➜ Analyst expectations remain mixed. Some maintain highly optimistic targets, while others expect a more modest guidance upgrade compared with earlier quarters.
The divide between bulls and bears is clear:
Strong performance is expected. The market's reaction may depend less on the numbers themselves and more on what management says about the future.
━━━━━━━━━━━━━━━━━━━━
◆ TECHNICAL ANALYSIS: rMU DAILY CHART ━━━━━━━━━━━━━━━━━━━━
Current Market Snapshot
➤ Price: 1,073.88
➤ Daily Range: 1,072.45 – 1,074.55
➤ MA(5): 1,070.14
➤ MA(10): 1,072.33
➤ MA(20): 1,021.00
➤ Swing High: 1,108.72
➤ Swing Low: 705.43
➤ Volume: 145.5K
➤ Turnover: 156.2M
━━━━━━━━━━━━━━━━━━━━
◆ WHAT THE CHART IS TELLING US ━━━━━━━━━━━━━━━━━━━━
① Trend Remains Positive
Price continues to trade above all major moving averages, while the MA(20) remains comfortably below current levels.
This keeps the broader trend tilted upward.
② Compression Before the Catalyst
The MA(5) and MA(10) are clustered tightly around price.
This type of structure often signals a market waiting for new information before making its next major move.
③ Volume Has Cooled
Trading activity is lower than during previous rallies.
That isn't unusual before a major earnings event, but it can create conditions for a sharp move once fresh information hits the market.
━━━━━━━━━━━━━━━━━━━━
◆ KEY LEVELS TO WATCH ━━━━━━━━━━━━━━━━━━━━
Resistance Zones
🚧 R1: 1,100 – 1,120
Includes the recent swing high at 1,108.72.
🚧 R2: Above 1,120
A breakout here would place price into less-tested territory.
Support Zones
🛡️ S1: 1,070 – 1,072
Near MA(5) and MA(10).
🛡️ S2: Around 1,021
Close to MA(20).
🛡️ S3: Around 926.94
A major structural level from the previous trend.
━━━━━━━━━━━━━━━━━━━━
◆ THREE POSSIBLE SCENARIOS ━━━━━━━━━━━━━━━━━━━━
(Educational Discussion — Not Predictions)
① Strong Results + Strong Guidance
A positive market reaction could bring the 1,100–1,120 resistance zone into focus.
Increasing volume would be an important confirmation factor.
② Strong Results, But Expectations Were Higher
This is a common earnings scenario.
Even a solid report can trigger profit-taking if investors expected more.
In that case, price may revisit support around the short-term moving averages.
③ Weak Guidance or Margin Concerns
If future demand, pricing trends, or margins raise concerns, the reaction could be more pronounced given how far memory-related assets have already advanced.
The objective isn't to predict the outcome.
The objective is to understand the important levels before volatility arrives.
━━━━━━━━━━━━━━━━━━━━
◆ IMPORTANT: rMU VS. U.S. MARKET HOURS ━━━━━━━━━━━━━━━━━━━━
Earnings are released after the U.S. market close.
Tokenized stocks may behave differently outside regular trading hours due to liquidity and spread dynamics.
Price gaps can occur around major announcements.
Elevated volatility is normal during earnings events.
━━━━━━━━━━━━━━━━━━━━
◆ FINAL THOUGHTS ━━━━━━━━━━━━━━━━━━━━
Micron has evolved into more than a memory manufacturer.
It has become one of the key indicators of the broader AI infrastructure and semiconductor cycle.
At the moment, rMU is trading near 1,074, maintaining a constructive technical structure while waiting for a major catalyst.
The upcoming earnings report will provide a clearer picture of whether the AI memory narrative continues to strengthen or enters a period of reassessment.
The most prepared traders aren't focused on predicting the outcome.
They focus on understanding the possibilities before the market makes its move.
━━━━━━━━━━━━━━━━━━━━
YOUR TURN
How long do you think the AI-driven memory cycle can continue?
Which segment interests you most?
① HBM
② DRAM
③ NAND
Share your thoughts below
Share with someone following AI and semiconductor markets
Follow for more RWA, tokenized stock, and market analysis
━━━━━━━━━━━━━━━━━━━━
#MicronPostsRecord84.9%GrossMargin #MicronTechnology #TrumpRejectsAIRulesForVoluntaryAudits #rMU
$AAPL.US
{stock_us}(AAPL.US)
$GOOGL.US
{stock_us}(GOOGL.US)
$NVDA.US
{stock_us}(NVDA.US)
rMU PRICE ANALYSIS: Micron Earnings Are Hours Away. Is the Memory Supercycle About to Be Tested?
━━━━━━━━━━━━━━━━━━━━
Some earnings reports move a stock. Others test an entire market narrative.
Today, all eyes are on Micron (MU).
Micron is set to release its Fiscal Q4 2026 earnings after the U.S. market close on September 30 (early October 1 in Asia). Meanwhile, rMU/USDT, the tokenized version of Micron stock is trading near 1,073.88, hovering just below a key resistance zone.
The market already expects strong numbers.
The real question is:
Can the AI-driven memory boom continue to exceed expectations, or has the market already priced in most of the optimism?
Let's break it down.
━━━━━━━━━━━━━━━━━━━━
◆ WHAT IS rMU?
━━━━━━━━━━━━━━━━━━━━
rMU allows crypto traders to gain exposure to Micron Technology through a tokenized asset that tracks MU stock.
✔︎ Designed to follow Micron's share price on a 1:1 basis
✔︎ Issued by Reality, Bitget's licensed RWA platform
✔︎ Built on Arbitrum with on-chain proof-of-asset attestations
✔︎ Backed by underlying shares held through a regulated U.S. broker-dealer
In simple terms: when Micron moves, rMU follows.
━━━━━━━━━━━━━━━━━━━━
◆ WHY THIS EARNINGS REPORT MATTERS ━━━━━━━━━━━━━━━━━━━━
Micron's recent performance has been nothing short of remarkable.
✔︎ Fiscal Q3 revenue reached a record $41.46B, up sharply from the prior year
✔︎ Non-GAAP gross margin expanded to roughly 84.9%
✔︎ Management guided Fiscal Q4 revenue to approximately $50B (±$1B)
✔︎ Shares have reportedly climbed more than 250% in 2026, fueled by AI infrastructure demand and rising memory prices
But here's the challenge:
When expectations become extremely high, even excellent results may not be enough to impress investors.
That's why traders are watching three key areas:
① Fiscal Q1 2027 Guidance – Can growth continue beyond current expectations?
② HBM4 Progress – Shipment volumes, customer adoption, and production timelines.
③ DRAM Pricing & Capex – Are supply constraints still supporting higher prices, and how aggressively is Micron expanding capacity?
━━━━━━━━━━━━━━━━━━━━
◆ FUNDAMENTAL BACKDROP ━━━━━━━━━━━━━━━━━━━━
The broader story remains centered around AI infrastructure demand.
➜ Management has stated that data-center demand can exceed available supply.
➜ HBM production requires significantly more wafer capacity than traditional DRAM, tightening overall memory supply.
➜ Industry conditions may remain constrained well beyond 2027.
➜ Micron recently announced a $2.75B assembly and test facility in India, highlighting its long-term expansion strategy.
➜ Analyst expectations remain mixed. Some maintain highly optimistic targets, while others expect a more modest guidance upgrade compared with earlier quarters.
The divide between bulls and bears is clear:
Strong performance is expected. The market's reaction may depend less on the numbers themselves and more on what management says about the future.
━━━━━━━━━━━━━━━━━━━━
◆ TECHNICAL ANALYSIS: rMU DAILY CHART ━━━━━━━━━━━━━━━━━━━━
Current Market Snapshot
➤ Price: 1,073.88
➤ Daily Range: 1,072.45 – 1,074.55
➤ MA(5): 1,070.14
➤ MA(10): 1,072.33
➤ MA(20): 1,021.00
➤ Swing High: 1,108.72
➤ Swing Low: 705.43
➤ Volume: 145.5K
➤ Turnover: 156.2M
━━━━━━━━━━━━━━━━━━━━
◆ WHAT THE CHART IS TELLING US ━━━━━━━━━━━━━━━━━━━━
① Trend Remains Positive
Price continues to trade above all major moving averages, while the MA(20) remains comfortably below current levels.
This keeps the broader trend tilted upward.
② Compression Before the Catalyst
The MA(5) and MA(10) are clustered tightly around price.
This type of structure often signals a market waiting for new information before making its next major move.
③ Volume Has Cooled
Trading activity is lower than during previous rallies.
That isn't unusual before a major earnings event, but it can create conditions for a sharp move once fresh information hits the market.
━━━━━━━━━━━━━━━━━━━━
◆ KEY LEVELS TO WATCH ━━━━━━━━━━━━━━━━━━━━
Resistance Zones
🚧 R1: 1,100 – 1,120
Includes the recent swing high at 1,108.72.
🚧 R2: Above 1,120
A breakout here would place price into less-tested territory.
Support Zones
🛡️ S1: 1,070 – 1,072
Near MA(5) and MA(10).
🛡️ S2: Around 1,021
Close to MA(20).
🛡️ S3: Around 926.94
A major structural level from the previous trend.
━━━━━━━━━━━━━━━━━━━━
◆ THREE POSSIBLE SCENARIOS ━━━━━━━━━━━━━━━━━━━━
(Educational Discussion — Not Predictions)
① Strong Results + Strong Guidance
A positive market reaction could bring the 1,100–1,120 resistance zone into focus.
Increasing volume would be an important confirmation factor.
② Strong Results, But Expectations Were Higher
This is a common earnings scenario.
Even a solid report can trigger profit-taking if investors expected more.
In that case, price may revisit support around the short-term moving averages.
③ Weak Guidance or Margin Concerns
If future demand, pricing trends, or margins raise concerns, the reaction could be more pronounced given how far memory-related assets have already advanced.
The objective isn't to predict the outcome.
The objective is to understand the important levels before volatility arrives.
━━━━━━━━━━━━━━━━━━━━
◆ IMPORTANT: rMU VS. U.S. MARKET HOURS ━━━━━━━━━━━━━━━━━━━━
Earnings are released after the U.S. market close.
Tokenized stocks may behave differently outside regular trading hours due to liquidity and spread dynamics.
Price gaps can occur around major announcements.
Elevated volatility is normal during earnings events.
━━━━━━━━━━━━━━━━━━━━
◆ FINAL THOUGHTS ━━━━━━━━━━━━━━━━━━━━
Micron has evolved into more than a memory manufacturer.
It has become one of the key indicators of the broader AI infrastructure and semiconductor cycle.
At the moment, rMU is trading near 1,074, maintaining a constructive technical structure while waiting for a major catalyst.
The upcoming earnings report will provide a clearer picture of whether the AI memory narrative continues to strengthen or enters a period of reassessment.
The most prepared traders aren't focused on predicting the outcome.
They focus on understanding the possibilities before the market makes its move.
━━━━━━━━━━━━━━━━━━━━
YOUR TURN
How long do you think the AI-driven memory cycle can continue?
Which segment interests you most?
① HBM
② DRAM
③ NAND
Share your thoughts below
Share with someone following AI and semiconductor markets
Follow for more RWA, tokenized stock, and market analysis
━━━━━━━━━━━━━━━━━━━━
#MicronPostsRecord84.9%GrossMargin #MicronTechnology #TrumpRejectsAIRulesForVoluntaryAudits #rMU
$AAPL.US
$GOOGL.US
$NVDA.US
Some earnings reports move a stock. Others test an entire market narrative.
Today, all eyes are on Micron (MU).
Micron is set to release its Fiscal Q4 2026 earnings after the U.S. market close on September 30 (early October 1 in Asia). Meanwhile, rMU/USDT, the tokenized version of Micron stock is trading near 1,073.88, hovering just below a key resistance zone.
The market already expects strong numbers.
The real question is:
Can the AI-driven memory boom continue to exceed expectations, or has the market already priced in most of the optimism?
Let's break it down.
━━━━━━━━━━━━━━━━━━━━
◆ WHAT IS rMU?
━━━━━━━━━━━━━━━━━━━━
rMU allows crypto traders to gain exposure to Micron Technology through a tokenized asset that tracks MU stock.
✔︎ Designed to follow Micron's share price on a 1:1 basis
✔︎ Issued by Reality, Bitget's licensed RWA platform
✔︎ Built on Arbitrum with on-chain proof-of-asset attestations
✔︎ Backed by underlying shares held through a regulated U.S. broker-dealer
In simple terms: when Micron moves, rMU follows.
━━━━━━━━━━━━━━━━━━━━
◆ WHY THIS EARNINGS REPORT MATTERS ━━━━━━━━━━━━━━━━━━━━
Micron's recent performance has been nothing short of remarkable.
✔︎ Fiscal Q3 revenue reached a record $41.46B, up sharply from the prior year
✔︎ Non-GAAP gross margin expanded to roughly 84.9%
✔︎ Management guided Fiscal Q4 revenue to approximately $50B (±$1B)
✔︎ Shares have reportedly climbed more than 250% in 2026, fueled by AI infrastructure demand and rising memory prices
But here's the challenge:
When expectations become extremely high, even excellent results may not be enough to impress investors.
That's why traders are watching three key areas:
① Fiscal Q1 2027 Guidance – Can growth continue beyond current expectations?
② HBM4 Progress – Shipment volumes, customer adoption, and production timelines.
③ DRAM Pricing & Capex – Are supply constraints still supporting higher prices, and how aggressively is Micron expanding capacity?
━━━━━━━━━━━━━━━━━━━━
◆ FUNDAMENTAL BACKDROP ━━━━━━━━━━━━━━━━━━━━
The broader story remains centered around AI infrastructure demand.
➜ Management has stated that data-center demand can exceed available supply.
➜ HBM production requires significantly more wafer capacity than traditional DRAM, tightening overall memory supply.
➜ Industry conditions may remain constrained well beyond 2027.
➜ Micron recently announced a $2.75B assembly and test facility in India, highlighting its long-term expansion strategy.
➜ Analyst expectations remain mixed. Some maintain highly optimistic targets, while others expect a more modest guidance upgrade compared with earlier quarters.
The divide between bulls and bears is clear:
Strong performance is expected. The market's reaction may depend less on the numbers themselves and more on what management says about the future.
━━━━━━━━━━━━━━━━━━━━
◆ TECHNICAL ANALYSIS: rMU DAILY CHART ━━━━━━━━━━━━━━━━━━━━
Current Market Snapshot
➤ Price: 1,073.88
➤ Daily Range: 1,072.45 – 1,074.55
➤ MA(5): 1,070.14
➤ MA(10): 1,072.33
➤ MA(20): 1,021.00
➤ Swing High: 1,108.72
➤ Swing Low: 705.43
➤ Volume: 145.5K
➤ Turnover: 156.2M
━━━━━━━━━━━━━━━━━━━━
◆ WHAT THE CHART IS TELLING US ━━━━━━━━━━━━━━━━━━━━
① Trend Remains Positive
Price continues to trade above all major moving averages, while the MA(20) remains comfortably below current levels.
This keeps the broader trend tilted upward.
② Compression Before the Catalyst
The MA(5) and MA(10) are clustered tightly around price.
This type of structure often signals a market waiting for new information before making its next major move.
③ Volume Has Cooled
Trading activity is lower than during previous rallies.
That isn't unusual before a major earnings event, but it can create conditions for a sharp move once fresh information hits the market.
━━━━━━━━━━━━━━━━━━━━
◆ KEY LEVELS TO WATCH ━━━━━━━━━━━━━━━━━━━━
Resistance Zones
🚧 R1: 1,100 – 1,120
Includes the recent swing high at 1,108.72.
🚧 R2: Above 1,120
A breakout here would place price into less-tested territory.
Support Zones
🛡️ S1: 1,070 – 1,072
Near MA(5) and MA(10).
🛡️ S2: Around 1,021
Close to MA(20).
🛡️ S3: Around 926.94
A major structural level from the previous trend.
━━━━━━━━━━━━━━━━━━━━
◆ THREE POSSIBLE SCENARIOS ━━━━━━━━━━━━━━━━━━━━
(Educational Discussion — Not Predictions)
① Strong Results + Strong Guidance
A positive market reaction could bring the 1,100–1,120 resistance zone into focus.
Increasing volume would be an important confirmation factor.
② Strong Results, But Expectations Were Higher
This is a common earnings scenario.
Even a solid report can trigger profit-taking if investors expected more.
In that case, price may revisit support around the short-term moving averages.
③ Weak Guidance or Margin Concerns
If future demand, pricing trends, or margins raise concerns, the reaction could be more pronounced given how far memory-related assets have already advanced.
The objective isn't to predict the outcome.
The objective is to understand the important levels before volatility arrives.
━━━━━━━━━━━━━━━━━━━━
◆ IMPORTANT: rMU VS. U.S. MARKET HOURS ━━━━━━━━━━━━━━━━━━━━
Earnings are released after the U.S. market close.
Tokenized stocks may behave differently outside regular trading hours due to liquidity and spread dynamics.
Price gaps can occur around major announcements.
Elevated volatility is normal during earnings events.
━━━━━━━━━━━━━━━━━━━━
◆ FINAL THOUGHTS ━━━━━━━━━━━━━━━━━━━━
Micron has evolved into more than a memory manufacturer.
It has become one of the key indicators of the broader AI infrastructure and semiconductor cycle.
At the moment, rMU is trading near 1,074, maintaining a constructive technical structure while waiting for a major catalyst.
The upcoming earnings report will provide a clearer picture of whether the AI memory narrative continues to strengthen or enters a period of reassessment.
The most prepared traders aren't focused on predicting the outcome.
They focus on understanding the possibilities before the market makes its move.
━━━━━━━━━━━━━━━━━━━━
YOUR TURN
How long do you think the AI-driven memory cycle can continue?
Which segment interests you most?
① HBM
② DRAM
③ NAND
Share your thoughts below
Share with someone following AI and semiconductor markets
Follow for more RWA, tokenized stock, and market analysis
━━━━━━━━━━━━━━━━━━━━
#MicronPostsRecord84.9%GrossMargin #MicronTechnology #TrumpRejectsAIRulesForVoluntaryAudits #rMU
$AAPL.US
$GOOGL.US
$NVDA.US
36
Connectez-vous pour découvrir plus de contenu
Rejoignez la communauté mondiale des adeptes de cryptomonnaies sur Binance Square
⚡️ Suviez les dernières informations importantes sur les cryptomonnaies.
💬 Jugé digne de confiance par la plus grande plateforme d’échange de cryptomonnaies au monde.
👍 Découvrez les connaissances que partagent les créateurs vérifiés.
Adresse e-mail/Nº de téléphone
Sujets d’actualité
1
#MetaMaskExitsLidoValidatorsAfterSecurityIncident
12,551 vues
365 mentions
2
#MicronBeatsEarningsLiftsGuidance
13,003 vues
322 mentions
3
#CFTCSubmitsTwoEventContractRulesToWhiteHouse
11,251 vues
310 mentions
4
#BitcoinClears$85200
27,971 vues
299 mentions
5
#AltcoinSeasonIndexHoldsAbove60For5Days
139,322 vues
1,791 mentions
6
#USADPAdds90000JobsInSeptember
63,729 vues
1,035 mentions
7
#USCorePCEEasesTo3%InAugust
43,644 vues
703 mentions
8
#KospiPostsWorstQuarterSince2020
24,952 vues
593 mentions
9
#SECToClarifyOnChainFundraisingRules
62,769 vues
792 mentions
10
#UKFCAOpensCryptoFirmAuthorization
58,477 vues
656 mentions