
#bitcoinwarnings
bitcoinwarnings
391,507 vues
713 mentions
Populaire
Récents

·
--
Article
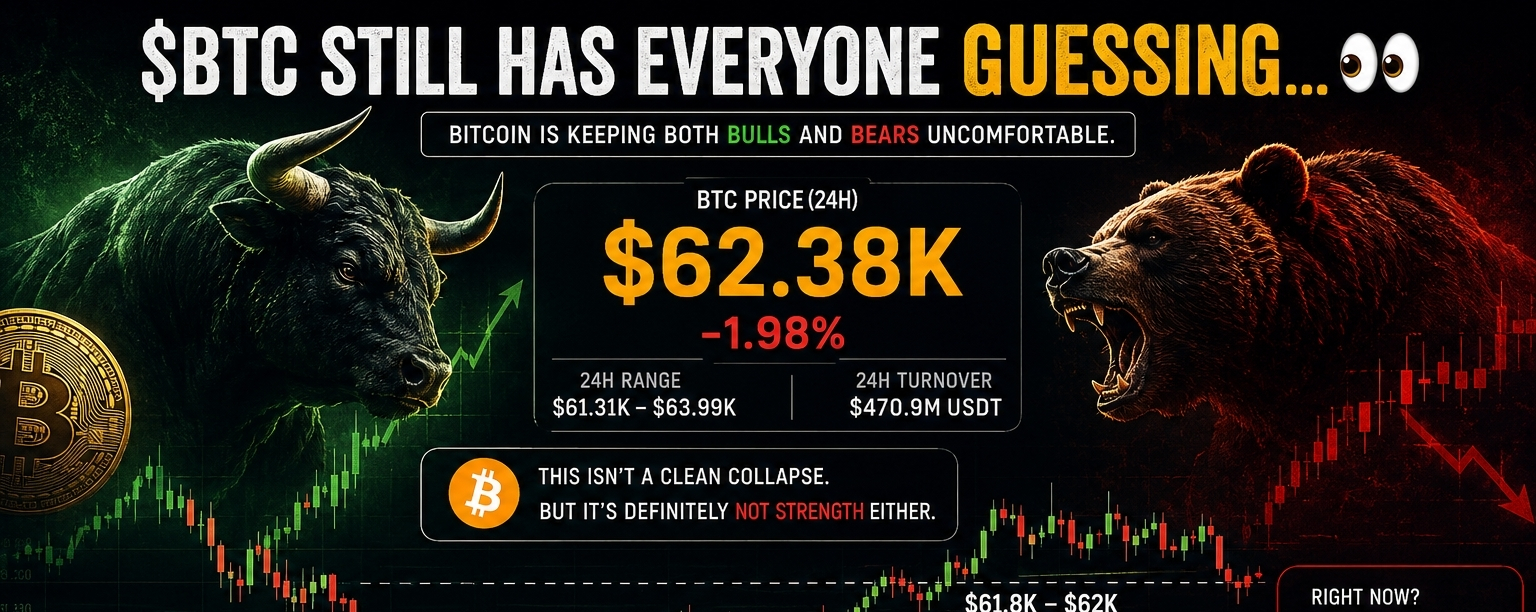
$BTC Fait Encore Douter Tout le Monde… 👀$BTC fait encore une fois ce qu’il fait le mieux—tenir aussi bien les haussiers que les baissiers en alerte.
Au moment d’écrire ces lignes, le BTC s’échange autour de 62,38 K$, en baisse de 1,98 % sur les dernières 24 heures, après avoir évolué entre 61,31 K$ et 63,99 K$, avec environ 470,9 M$USDT de volume de transactions.
Ce n’est pas un bilan complet, mais ce n’est pas non plus un véritable redressement.
Après avoir rebondi depuis le plus bas à 57,8 K$, le Bitcoin essaie de retrouver de l’élan. Le problème ? Chaque rallye donne encore l’impression d’être hésitant. Les acheteurs interviennent, mais pas avec la confiance nécessaire pour convaincre le marché que la correction est terminée.
$BTC Fait Encore Douter Tout le Monde… 👀
$BTC fait encore une fois ce qu’il fait le mieux—tenir aussi bien les haussiers que les baissiers en alerte.
Au moment d’écrire ces lignes, le BTC s’échange autour de 62,38 K$, en baisse de 1,98 % sur les dernières 24 heures, après avoir évolué entre 61,31 K$ et 63,99 K$, avec environ 470,9 M$USDT de volume de transactions.
Ce n’est pas un bilan complet, mais ce n’est pas non plus un véritable redressement.
Après avoir rebondi depuis le plus bas à 57,8 K$, le Bitcoin essaie de retrouver de l’élan. Le problème ? Chaque rallye donne encore l’impression d’être hésitant. Les acheteurs interviennent, mais pas avec la confiance nécessaire pour convaincre le marché que la correction est terminée.
Au moment d’écrire ces lignes, le BTC s’échange autour de 62,38 K$, en baisse de 1,98 % sur les dernières 24 heures, après avoir évolué entre 61,31 K$ et 63,99 K$, avec environ 470,9 M$USDT de volume de transactions.
Ce n’est pas un bilan complet, mais ce n’est pas non plus un véritable redressement.
Après avoir rebondi depuis le plus bas à 57,8 K$, le Bitcoin essaie de retrouver de l’élan. Le problème ? Chaque rallye donne encore l’impression d’être hésitant. Les acheteurs interviennent, mais pas avec la confiance nécessaire pour convaincre le marché que la correction est terminée.
123

·
--
#BitcoinWarnings
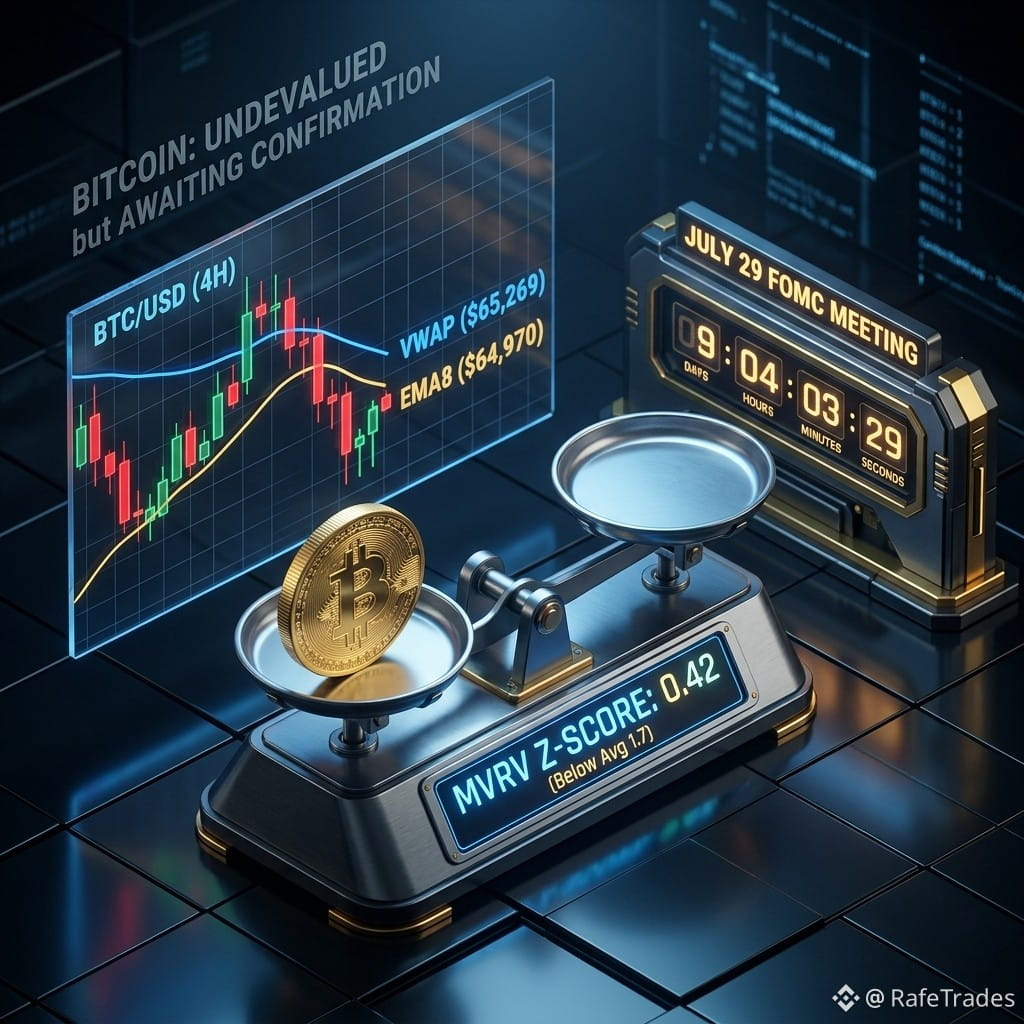
🚨 $BTC — Sous-évalué mais aucun signal Bull confirmé pour l’instant 📉
▪️ Biais de l’Order Flow : Neutre 🟡 (Phase d’accumulation)
▪️ Fourchette de mitigation attendue : 64,900 – 65,100 $
▪️ Objectif de liquidité 1 : 66,000 $ (Résistance)
▪️ Objectif de liquidité 2 : 67,000 $ (Sommet de la fourchette)
▪️ Invalidation structurelle : 64,000 $ (Rupture du support 4H)
Analyse macro institutionnelle & du marché :
Le BTC évolue dans une zone de consolidation, avec un prix qui reste au-dessus de la EMA8 (64,970 $) mais en dessous du VWAP (65,269 $) à 65,097 $. Le MVRV Z-Score à 0,42 (moyenne historique : 1,7) indique que le Bitcoin est sous-évalué, mais la phase de capitulation complète (Z-Score négatif) n’a pas encore eu lieu. Le profit/perte réalisé est repassé positif, signalant une baisse de la pression vendeuse — mais pas assez pour confirmer un nouveau cycle haussier.
La décision de la Fed (29 juillet) est le catalyseur clé. Une hausse de 25 pb (probabilité de 33,7 %) pourrait déclencher de la volatilité. La structure est neutre mais tend vers le haussier tant que 64,900 $ tient. Surveillez une cassure au-dessus de 65,400 $ pour confirmer la dynamique.
#RafeTrades
"CLIQUEZ ICI👇👇👇 POUR SUIVRE LE GRAPHIQUE EN DIRECT & TRADER"
$BTC
{spot}(BTCUSDT)
Avertissement : Suivi de la structure de marché à des fins d’information uniquement. Ceci ne constitue pas un conseil financier. Faites toujours votre propre recherche (DYOR). 🛡️
#BitcoinWarnings
🚨 $BTC — Sous-évalué mais aucun signal Bull confirmé pour l’instant 📉
▪️ Biais de l’Order Flow : Neutre 🟡 (Phase d’accumulation)
▪️ Fourchette de mitigation attendue : 64,900 – 65,100 $
▪️ Objectif de liquidité 1 : 66,000 $ (Résistance)
▪️ Objectif de liquidité 2 : 67,000 $ (Sommet de la fourchette)
▪️ Invalidation structurelle : 64,000 $ (Rupture du support 4H)
Analyse macro institutionnelle & du marché :
Le BTC évolue dans une zone de consolidation, avec un prix qui reste au-dessus de la EMA8 (64,970 $) mais en dessous du VWAP (65,269 $) à 65,097 $. Le MVRV Z-Score à 0,42 (moyenne historique : 1,7) indique que le Bitcoin est sous-évalué, mais la phase de capitulation complète (Z-Score négatif) n’a pas encore eu lieu. Le profit/perte réalisé est repassé positif, signalant une baisse de la pression vendeuse — mais pas assez pour confirmer un nouveau cycle haussier.
La décision de la Fed (29 juillet) est le catalyseur clé. Une hausse de 25 pb (probabilité de 33,7 %) pourrait déclencher de la volatilité. La structure est neutre mais tend vers le haussier tant que 64,900 $ tient. Surveillez une cassure au-dessus de 65,400 $ pour confirmer la dynamique.
#RafeTrades
"CLIQUEZ ICI👇👇👇 POUR SUIVRE LE GRAPHIQUE EN DIRECT & TRADER"
$BTC
Avertissement : Suivi de la structure de marché à des fins d’information uniquement. Ceci ne constitue pas un conseil financier. Faites toujours votre propre recherche (DYOR). 🛡️
🚨 $BTC — Sous-évalué mais aucun signal Bull confirmé pour l’instant 📉
▪️ Biais de l’Order Flow : Neutre 🟡 (Phase d’accumulation)
▪️ Fourchette de mitigation attendue : 64,900 – 65,100 $
▪️ Objectif de liquidité 1 : 66,000 $ (Résistance)
▪️ Objectif de liquidité 2 : 67,000 $ (Sommet de la fourchette)
▪️ Invalidation structurelle : 64,000 $ (Rupture du support 4H)
Analyse macro institutionnelle & du marché :
Le BTC évolue dans une zone de consolidation, avec un prix qui reste au-dessus de la EMA8 (64,970 $) mais en dessous du VWAP (65,269 $) à 65,097 $. Le MVRV Z-Score à 0,42 (moyenne historique : 1,7) indique que le Bitcoin est sous-évalué, mais la phase de capitulation complète (Z-Score négatif) n’a pas encore eu lieu. Le profit/perte réalisé est repassé positif, signalant une baisse de la pression vendeuse — mais pas assez pour confirmer un nouveau cycle haussier.
La décision de la Fed (29 juillet) est le catalyseur clé. Une hausse de 25 pb (probabilité de 33,7 %) pourrait déclencher de la volatilité. La structure est neutre mais tend vers le haussier tant que 64,900 $ tient. Surveillez une cassure au-dessus de 65,400 $ pour confirmer la dynamique.
#RafeTrades
"CLIQUEZ ICI👇👇👇 POUR SUIVRE LE GRAPHIQUE EN DIRECT & TRADER"
$BTC
Avertissement : Suivi de la structure de marché à des fins d’information uniquement. Ceci ne constitue pas un conseil financier. Faites toujours votre propre recherche (DYOR). 🛡️
14

·
--
Baissier
À chaque fin de mois, le BTC baisse ! Presque chaque mois, vers la fin, c’est baissier !! Shortez-le et gagnez de l’argent
Vérifiez les tendances et les graphiques !
J’ai demandé à une IA la raison et elle dit :
Pourquoi cela pourrait-il se produire ? Quelques hypothèses :
📦 Le rééquilibrage de fin de mois par des fonds institutionnels signifie souvent vendre des actifs risqués comme la crypto
💵 L’expiration des produits dérivés (futures/options mensuels) autour de la fin du mois peut créer une pression à la baisse
🏦 La prise de profits lorsque les traders ferment leurs positions avant le nouveau mois
Mon ajout : Les mineurs doivent aussi payer leurs factures (électricité, etc.), donc ils sont forcés de vendre certains…
#BitcoinWarnings
À chaque fin de mois, le BTC baisse ! Presque chaque mois, vers la fin, c’est baissier !! Shortez-le et gagnez de l’argent
Vérifiez les tendances et les graphiques !
J’ai demandé à une IA la raison et elle dit :
Pourquoi cela pourrait-il se produire ? Quelques hypothèses :
📦 Le rééquilibrage de fin de mois par des fonds institutionnels signifie souvent vendre des actifs risqués comme la crypto
💵 L’expiration des produits dérivés (futures/options mensuels) autour de la fin du mois peut créer une pression à la baisse
🏦 La prise de profits lorsque les traders ferment leurs positions avant le nouveau mois
Mon ajout : Les mineurs doivent aussi payer leurs factures (électricité, etc.), donc ils sont forcés de vendre certains…
#BitcoinWarnings
Vérifiez les tendances et les graphiques !
J’ai demandé à une IA la raison et elle dit :
Pourquoi cela pourrait-il se produire ? Quelques hypothèses :
📦 Le rééquilibrage de fin de mois par des fonds institutionnels signifie souvent vendre des actifs risqués comme la crypto
💵 L’expiration des produits dérivés (futures/options mensuels) autour de la fin du mois peut créer une pression à la baisse
🏦 La prise de profits lorsque les traders ferment leurs positions avant le nouveau mois
Mon ajout : Les mineurs doivent aussi payer leurs factures (électricité, etc.), donc ils sont forcés de vendre certains…
#BitcoinWarnings
93

Vérifié

Article
Pourquoi le Bitcoin a-t-il chuté ?Le Bitcoin fait face à une forte vente à découvert alors que le marché devient risk-off
Le Bitcoin (BTC) a connu une chute de prix significative aujourd'hui, suscitant des inquiétudes parmi les traders et les investisseurs sur le marché des cryptomonnaies. La plus grande cryptomonnaie du monde a chuté brutalement en raison d'une combinaison de prise de bénéfices, d'incertitude sur le marché et de préoccupations économiques plus larges qui ont pesé sur le sentiment des investisseurs.
L'une des raisons principales derrière ce dump semble être une forte pression de vente de la part des holders à court terme qui ont décidé de sécuriser leurs bénéfices après le récent rallye du Bitcoin. Lorsque de nombreux investisseurs vendent simultanément, l'augmentation de l'offre pousse souvent les prix à la baisse, créant une réaction en chaîne de vente panique.
Pourquoi le Bitcoin a-t-il chuté ?
Le Bitcoin fait face à une forte vente à découvert alors que le marché devient risk-off
Le Bitcoin (BTC) a connu une chute de prix significative aujourd'hui, suscitant des inquiétudes parmi les traders et les investisseurs sur le marché des cryptomonnaies. La plus grande cryptomonnaie du monde a chuté brutalement en raison d'une combinaison de prise de bénéfices, d'incertitude sur le marché et de préoccupations économiques plus larges qui ont pesé sur le sentiment des investisseurs.
L'une des raisons principales derrière ce dump semble être une forte pression de vente de la part des holders à court terme qui ont décidé de sécuriser leurs bénéfices après le récent rallye du Bitcoin. Lorsque de nombreux investisseurs vendent simultanément, l'augmentation de l'offre pousse souvent les prix à la baisse, créant une réaction en chaîne de vente panique.
Le Bitcoin (BTC) a connu une chute de prix significative aujourd'hui, suscitant des inquiétudes parmi les traders et les investisseurs sur le marché des cryptomonnaies. La plus grande cryptomonnaie du monde a chuté brutalement en raison d'une combinaison de prise de bénéfices, d'incertitude sur le marché et de préoccupations économiques plus larges qui ont pesé sur le sentiment des investisseurs.
L'une des raisons principales derrière ce dump semble être une forte pression de vente de la part des holders à court terme qui ont décidé de sécuriser leurs bénéfices après le récent rallye du Bitcoin. Lorsque de nombreux investisseurs vendent simultanément, l'augmentation de l'offre pousse souvent les prix à la baisse, créant une réaction en chaîne de vente panique.
2.7k
82
223
2.7k

·
--
Baissier
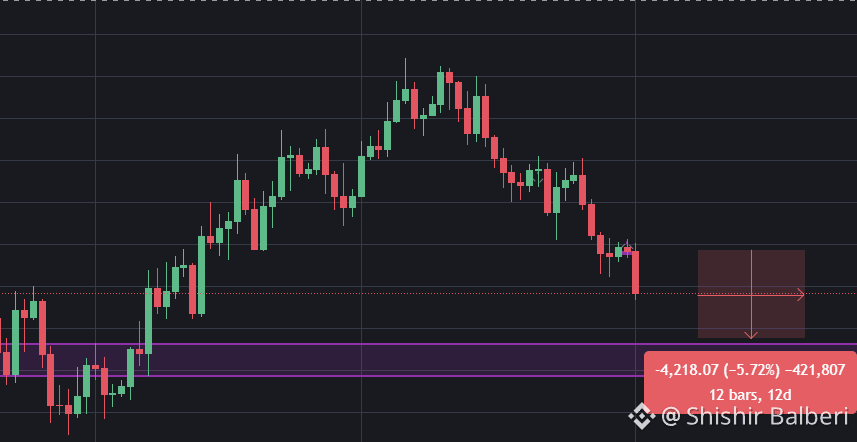
$BTC 📉 Je surveille de près le Bitcoin à ces niveaux actuels.
Le marché montre des signes de faiblesse, et si les vendeurs continuent de garder le contrôle, le BTC pourrait descendre vers 69,424.18.
C'est le niveau clé à la baisse que je surveille, mais j'attendrai une confirmation avant de prendre position.
{future}(BTCUSDT)
{future}(XRPUSDT)
#BitcoinWarnings #BTC60K #CryptoTrading. #BTCUSDTAnalysis #BinanceSquare
$BTC 📉 Je surveille de près le Bitcoin à ces niveaux actuels.
Le marché montre des signes de faiblesse, et si les vendeurs continuent de garder le contrôle, le BTC pourrait descendre vers 69,424.18.
C'est le niveau clé à la baisse que je surveille, mais j'attendrai une confirmation avant de prendre position.
#BitcoinWarnings #BTC60K #CryptoTrading. #BTCUSDTAnalysis #BinanceSquare
Le marché montre des signes de faiblesse, et si les vendeurs continuent de garder le contrôle, le BTC pourrait descendre vers 69,424.18.
C'est le niveau clé à la baisse que je surveille, mais j'attendrai une confirmation avant de prendre position.
#BitcoinWarnings #BTC60K #CryptoTrading. #BTCUSDTAnalysis #BinanceSquare
145


·
--
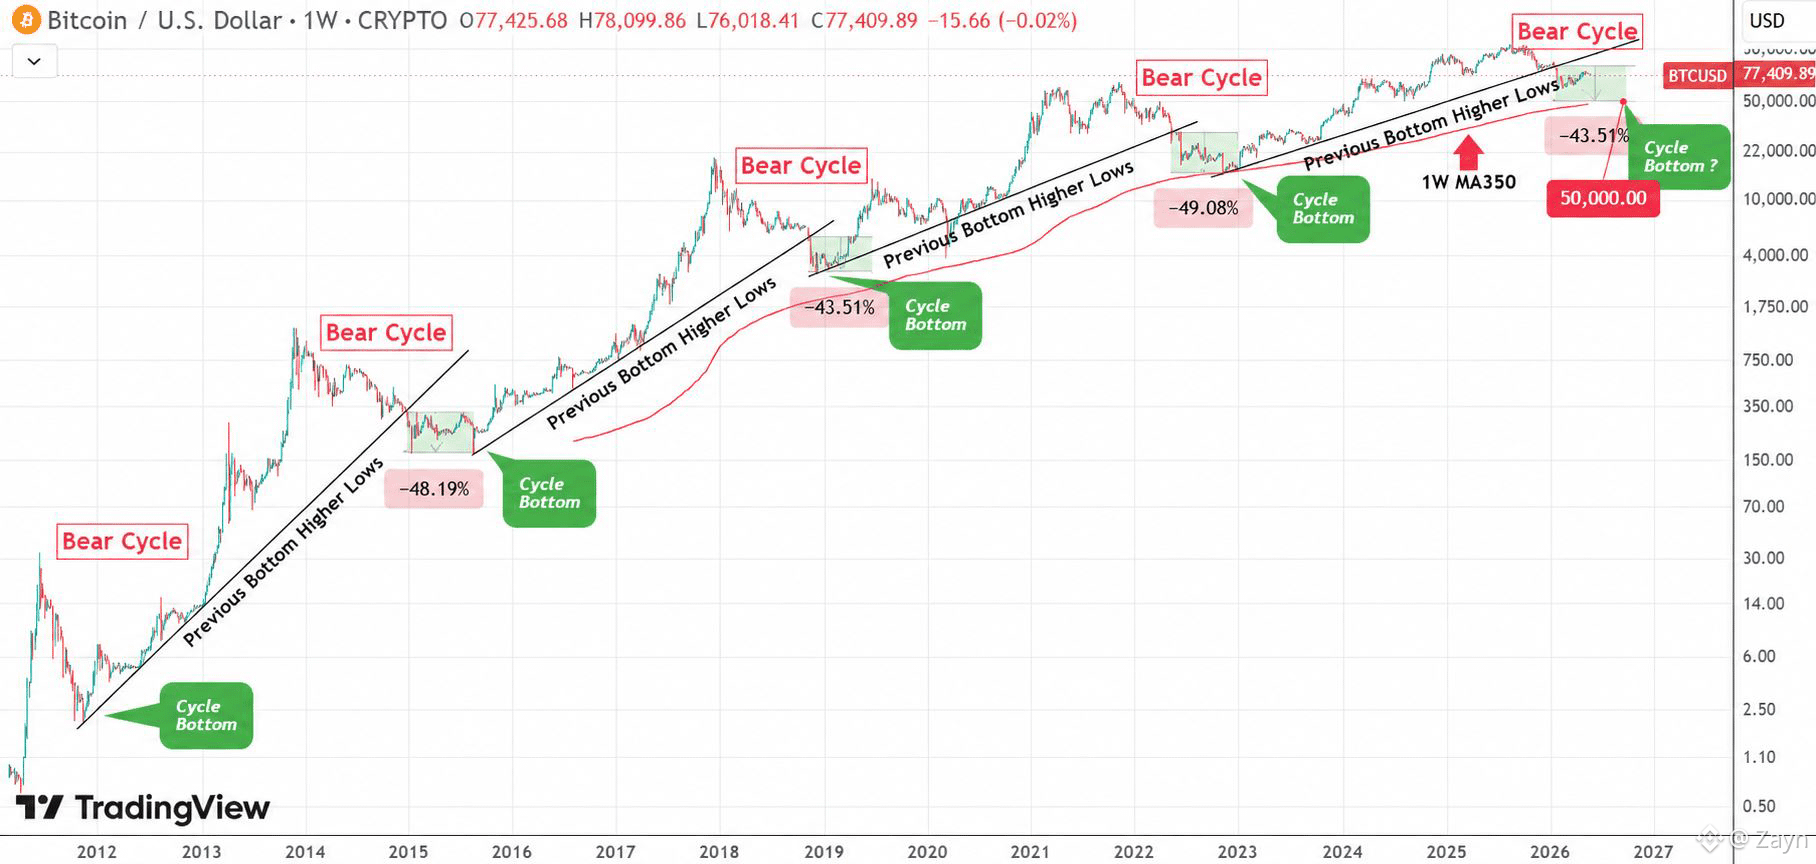
Et si Bitcoin n'avait toujours pas terminé sa vraie correction ? 👀
Historiquement, chaque fois que Bitcoin a franchi à la baisse la tendance des Plus Bas Plus Élevés de l'ancien creux du marché baissier, il a chuté de plus de 40%.
Cette dernière rupture a eu lieu fin janvier, et $BTC avait déjà connu un mouvement brusque à la baisse.
Mais les précédentes cassures étaient autour de -48% à -49%, tandis que celle-ci n'a pas encore atteint cette zone.
Si l'histoire se répète, la zone des 50K $ pourrait toujours être d'actualité, ce qui coïncide également avec la zone 1W MA350.
Je ne dis pas que cela doit arriver, mais c'est un niveau à surveiller.
La gestion des risques est toujours meilleure qu'un optimisme aveugle.
#Bitcoin❗ #bearishmomentum #BitcoinWarnings
Et si Bitcoin n'avait toujours pas terminé sa vraie correction ? 👀
Historiquement, chaque fois que Bitcoin a franchi à la baisse la tendance des Plus Bas Plus Élevés de l'ancien creux du marché baissier, il a chuté de plus de 40%.
Cette dernière rupture a eu lieu fin janvier, et $BTC avait déjà connu un mouvement brusque à la baisse.
Mais les précédentes cassures étaient autour de -48% à -49%, tandis que celle-ci n'a pas encore atteint cette zone.
Si l'histoire se répète, la zone des 50K $ pourrait toujours être d'actualité, ce qui coïncide également avec la zone 1W MA350.
Je ne dis pas que cela doit arriver, mais c'est un niveau à surveiller.
La gestion des risques est toujours meilleure qu'un optimisme aveugle.
#Bitcoin❗ #bearishmomentum #BitcoinWarnings
Historiquement, chaque fois que Bitcoin a franchi à la baisse la tendance des Plus Bas Plus Élevés de l'ancien creux du marché baissier, il a chuté de plus de 40%.
Cette dernière rupture a eu lieu fin janvier, et $BTC avait déjà connu un mouvement brusque à la baisse.
Mais les précédentes cassures étaient autour de -48% à -49%, tandis que celle-ci n'a pas encore atteint cette zone.
Si l'histoire se répète, la zone des 50K $ pourrait toujours être d'actualité, ce qui coïncide également avec la zone 1W MA350.
Je ne dis pas que cela doit arriver, mais c'est un niveau à surveiller.
La gestion des risques est toujours meilleure qu'un optimisme aveugle.
#Bitcoin❗ #bearishmomentum #BitcoinWarnings
4
2
524
·
--
🚨 $BTC — Cartographie de la structure de l’effondrement du regroupement Twenty One & Strike 📉
▪️ Biais du flux d’ordres : Baissier 🔴
▪️ Fourchette de mitigation attendue : 66 080 — 66 200$
▪️ Objectif de liquidité 1 : 65 400 $ (Liquidité côté vente)
▪️ Objectif de liquidité 2 : 64 800 $ (Bloc de demande H1)
▪️ Invalidation structurelle : 66 850 $ (Cassure du plus haut de swing)
Analyse macro institutionnelle & du marché :
L’effondrement du rapprochement Twenty One–Strike et le fait que Jack Mallers se retire injectent une nouvelle incertitude structurelle dans le récit de trésorerie corporative du Bitcoin. Les Smart Money lisent cela comme une faiblesse à court terme dans la thèse d’adoption institutionnelle, utilisant le titre comme carburant pour faire passer le BTC sous le VWAP de la séance à 66 199 $ et piéger les derniers longs empilés au-dessus du seuil des 66 000.
La structure H1 actuelle imprime une nette dislocation baissière depuis le balayage de liquidité à 66 850 $, laissant un Fair Value Gap (écart de juste valeur) non mitigé entre 66 080 — 66 200 $ comme zone principale de réentrée institutionnelle. L’échec des haussiers à reprendre le VWAP avec un flux d’ordres côté achat (Buy-Side Order Flow) agressif ouvre la voie vers la liquidité côté vente reposant à 65 400 $. Les Market Makers traquent le cluster de stop retail avant tout nouvel ajustement structurel à la hausse. #RafeTrades
"CLIQUEZ ICI👇👇👇 POUR SUIVRE LE GRAPHIQUE EN DIRECT & TRADER"
$BTC $ETH
Avertissement : suivi de la structure du marché à des fins d’information. Ceci ne constitue pas un conseil financier. Faites toujours votre propre recherche (DYOR). 🛡️
#BitcoinHits$66500OneMonthHigh #BTC #BitcoinWarnings
🚨 $BTC — Cartographie de la structure de l’effondrement du regroupement Twenty One & Strike 📉
▪️ Biais du flux d’ordres : Baissier 🔴
▪️ Fourchette de mitigation attendue : 66 080 — 66 200$
▪️ Objectif de liquidité 1 : 65 400 $ (Liquidité côté vente)
▪️ Objectif de liquidité 2 : 64 800 $ (Bloc de demande H1)
▪️ Invalidation structurelle : 66 850 $ (Cassure du plus haut de swing)
Analyse macro institutionnelle & du marché :
L’effondrement du rapprochement Twenty One–Strike et le fait que Jack Mallers se retire injectent une nouvelle incertitude structurelle dans le récit de trésorerie corporative du Bitcoin. Les Smart Money lisent cela comme une faiblesse à court terme dans la thèse d’adoption institutionnelle, utilisant le titre comme carburant pour faire passer le BTC sous le VWAP de la séance à 66 199 $ et piéger les derniers longs empilés au-dessus du seuil des 66 000.
La structure H1 actuelle imprime une nette dislocation baissière depuis le balayage de liquidité à 66 850 $, laissant un Fair Value Gap (écart de juste valeur) non mitigé entre 66 080 — 66 200 $ comme zone principale de réentrée institutionnelle. L’échec des haussiers à reprendre le VWAP avec un flux d’ordres côté achat (Buy-Side Order Flow) agressif ouvre la voie vers la liquidité côté vente reposant à 65 400 $. Les Market Makers traquent le cluster de stop retail avant tout nouvel ajustement structurel à la hausse. #RafeTrades
"CLIQUEZ ICI👇👇👇 POUR SUIVRE LE GRAPHIQUE EN DIRECT & TRADER"
$BTC $ETH
Avertissement : suivi de la structure du marché à des fins d’information. Ceci ne constitue pas un conseil financier. Faites toujours votre propre recherche (DYOR). 🛡️
#BitcoinHits$66500OneMonthHigh #BTC #BitcoinWarnings
▪️ Biais du flux d’ordres : Baissier 🔴
▪️ Fourchette de mitigation attendue : 66 080 — 66 200$
▪️ Objectif de liquidité 1 : 65 400 $ (Liquidité côté vente)
▪️ Objectif de liquidité 2 : 64 800 $ (Bloc de demande H1)
▪️ Invalidation structurelle : 66 850 $ (Cassure du plus haut de swing)
Analyse macro institutionnelle & du marché :
L’effondrement du rapprochement Twenty One–Strike et le fait que Jack Mallers se retire injectent une nouvelle incertitude structurelle dans le récit de trésorerie corporative du Bitcoin. Les Smart Money lisent cela comme une faiblesse à court terme dans la thèse d’adoption institutionnelle, utilisant le titre comme carburant pour faire passer le BTC sous le VWAP de la séance à 66 199 $ et piéger les derniers longs empilés au-dessus du seuil des 66 000.
La structure H1 actuelle imprime une nette dislocation baissière depuis le balayage de liquidité à 66 850 $, laissant un Fair Value Gap (écart de juste valeur) non mitigé entre 66 080 — 66 200 $ comme zone principale de réentrée institutionnelle. L’échec des haussiers à reprendre le VWAP avec un flux d’ordres côté achat (Buy-Side Order Flow) agressif ouvre la voie vers la liquidité côté vente reposant à 65 400 $. Les Market Makers traquent le cluster de stop retail avant tout nouvel ajustement structurel à la hausse. #RafeTrades
"CLIQUEZ ICI👇👇👇 POUR SUIVRE LE GRAPHIQUE EN DIRECT & TRADER"
$BTC $ETH
Avertissement : suivi de la structure du marché à des fins d’information. Ceci ne constitue pas un conseil financier. Faites toujours votre propre recherche (DYOR). 🛡️
#BitcoinHits$66500OneMonthHigh #BTC #BitcoinWarnings

53

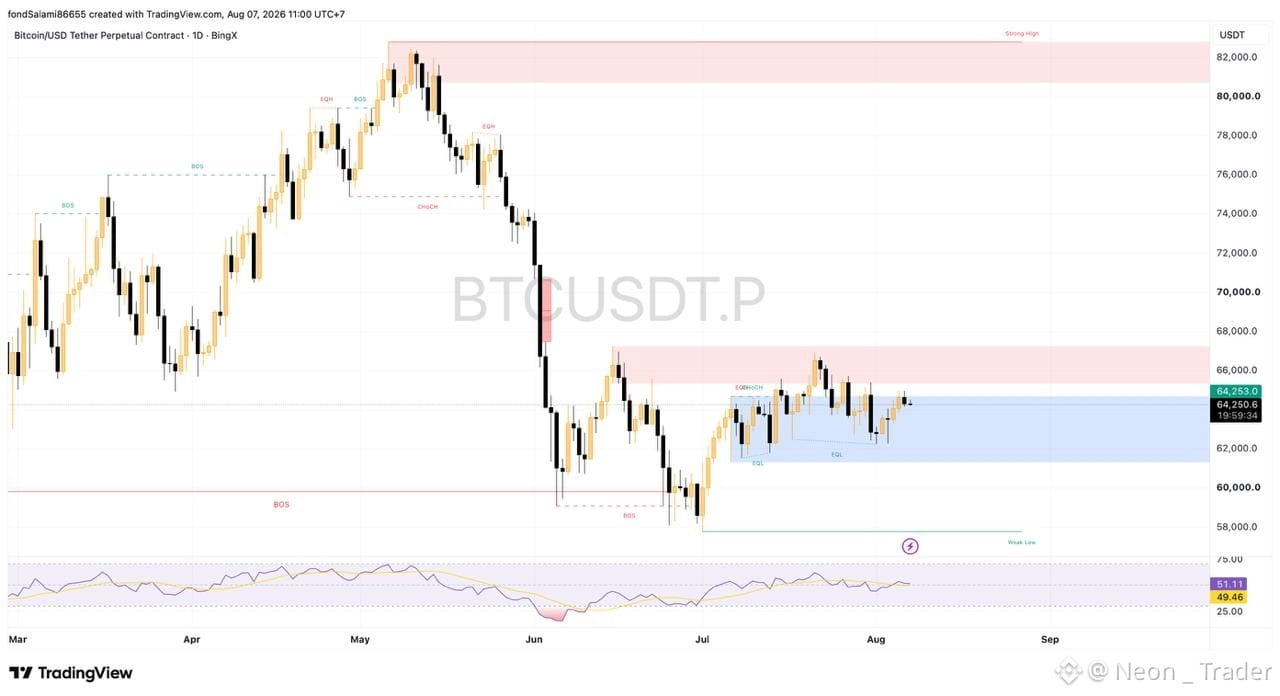
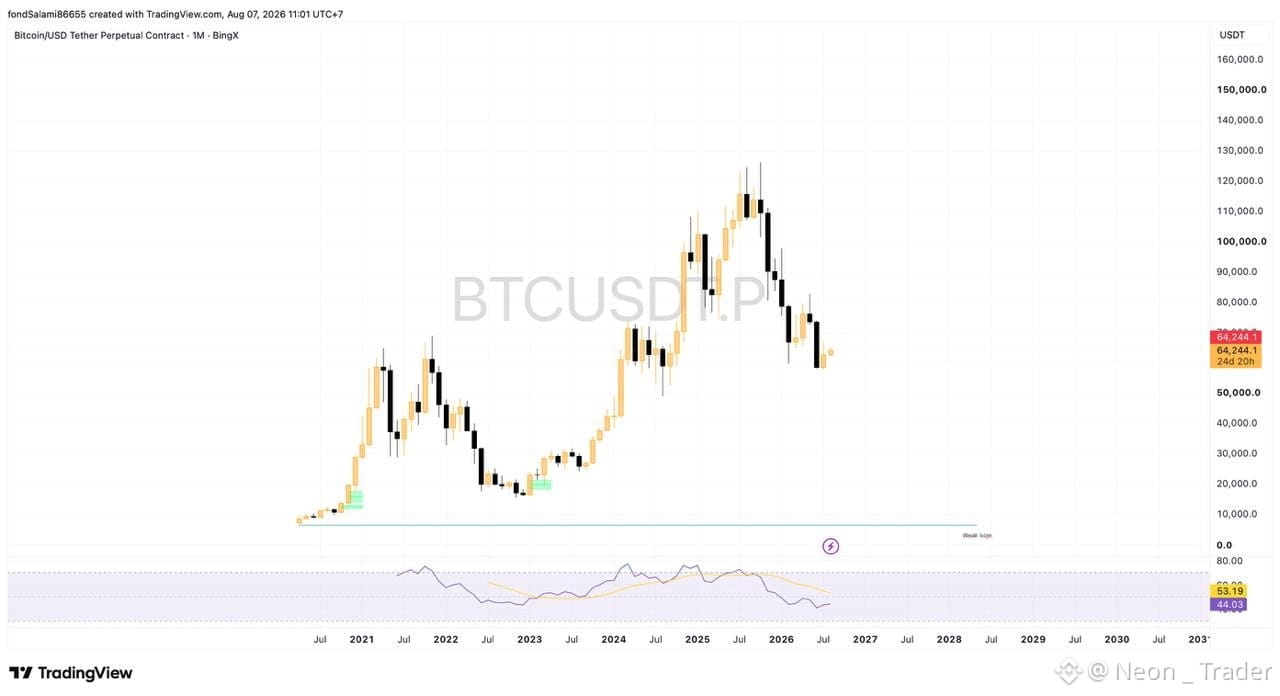
$BTC a plafonné à 125k l’année dernière. Nous sommes en baisse d’environ 50% depuis, et nous nous situons juste sur le plus haut du cycle 2021. Ancienne résistance, maintenant support. C’est un point de décision macro, pas un scalp.
Voici l’analyse honnête :
• MENSUEL
Nous avons rendu la moitié du sommet et sommes retombés exactement sur l’ancienne
plage 65k - 69k du plafond du dernier cycle. Ce niveau a maintenu le
marché à la baisse pendant des années. Maintenant, il doit le soutenir.
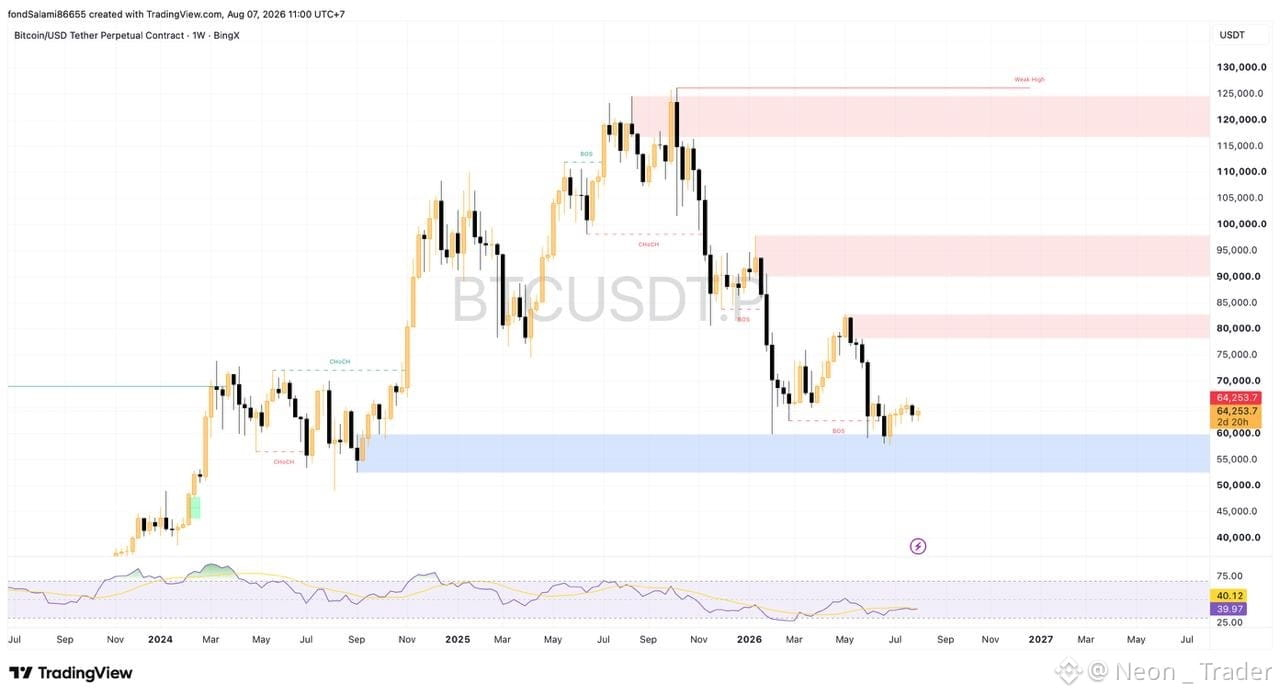
• HEBDOMADAIRE
La structure est baissière. CHoCH à 100k, BOS en baisse jusqu’à 80k.
Je ne vais pas prétendre le contraire.
• QUOTIDIEN
Deux mois de range. 60k à 66k, qui se resserre.
S’enroule à l’intérieur de cette demande hebdomadaire.
• LE PLAN MACRO
Zone d’accumulation : 55k - 60k. C’est là où je construis,
en plusieurs tranches, pour un maintien sur plusieurs mois.
Si les CLOTURES hebdomadaires passent sous 55k, je ne panique pas. Je recharge plus bas.
45k, puis la demande 28k - 32k.
• ANNULATION
Clôture hebdomadaire sous 55k = de la patience, pas de la peur.
Perdre 15k = toute la thèse est fausse. On n’en est nulle part.
Je vais bientôt détailler le plan de scalping avec $BTC !
#BitcoinWarnings #JapanRegulatorsUrgeCryptoWithdrawalLimits
#Bitcoin❗
$BTC a plafonné à 125k l’année dernière. Nous sommes en baisse d’environ 50% depuis, et nous nous situons juste sur le plus haut du cycle 2021. Ancienne résistance, maintenant support. C’est un point de décision macro, pas un scalp.
Voici l’analyse honnête :
• MENSUEL
Nous avons rendu la moitié du sommet et sommes retombés exactement sur l’ancienne
plage 65k - 69k du plafond du dernier cycle. Ce niveau a maintenu le
marché à la baisse pendant des années. Maintenant, il doit le soutenir.
• HEBDOMADAIRE
La structure est baissière. CHoCH à 100k, BOS en baisse jusqu’à 80k.
Je ne vais pas prétendre le contraire.
• QUOTIDIEN
Deux mois de range. 60k à 66k, qui se resserre.
S’enroule à l’intérieur de cette demande hebdomadaire.
• LE PLAN MACRO
Zone d’accumulation : 55k - 60k. C’est là où je construis,
en plusieurs tranches, pour un maintien sur plusieurs mois.
Si les CLOTURES hebdomadaires passent sous 55k, je ne panique pas. Je recharge plus bas.
45k, puis la demande 28k - 32k.
• ANNULATION
Clôture hebdomadaire sous 55k = de la patience, pas de la peur.
Perdre 15k = toute la thèse est fausse. On n’en est nulle part.
Je vais bientôt détailler le plan de scalping avec $BTC !
#BitcoinWarnings #JapanRegulatorsUrgeCryptoWithdrawalLimits
#Bitcoin❗
Voici l’analyse honnête :
• MENSUEL
Nous avons rendu la moitié du sommet et sommes retombés exactement sur l’ancienne
plage 65k - 69k du plafond du dernier cycle. Ce niveau a maintenu le
marché à la baisse pendant des années. Maintenant, il doit le soutenir.
• HEBDOMADAIRE
La structure est baissière. CHoCH à 100k, BOS en baisse jusqu’à 80k.
Je ne vais pas prétendre le contraire.
• QUOTIDIEN
Deux mois de range. 60k à 66k, qui se resserre.
S’enroule à l’intérieur de cette demande hebdomadaire.
• LE PLAN MACRO
Zone d’accumulation : 55k - 60k. C’est là où je construis,
en plusieurs tranches, pour un maintien sur plusieurs mois.
Si les CLOTURES hebdomadaires passent sous 55k, je ne panique pas. Je recharge plus bas.
45k, puis la demande 28k - 32k.
• ANNULATION
Clôture hebdomadaire sous 55k = de la patience, pas de la peur.
Perdre 15k = toute la thèse est fausse. On n’en est nulle part.
Je vais bientôt détailler le plan de scalping avec $BTC !
#BitcoinWarnings #JapanRegulatorsUrgeCryptoWithdrawalLimits
#Bitcoin❗
2
112

·
--
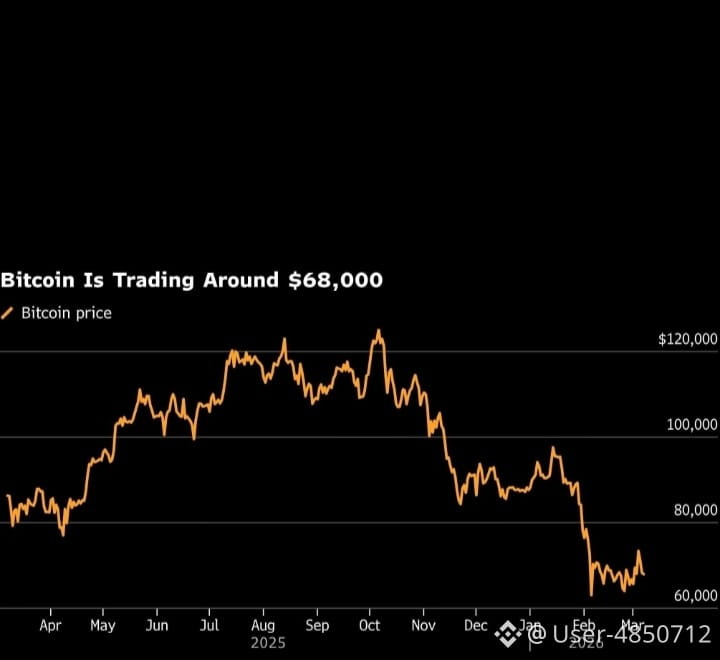
$BTC a chuté fortement cette semaine, tombant autour de 64 000 $–65 000 $, son niveau le plus bas en plus de trois mois. Des rapports récents évoquent des sorties d'ETF, un sentiment de marché plus faible et des prises de bénéfices par de grands investisseurs comme principaux moteurs.
Certains analystes notent que $BTC teste des niveaux de support importants après une baisse d'environ 10–13 % en seulement quelques sessions de trading.
Analyse de vente à découvert
📉 Tendance à court terme : Baissière. Bitcoin reste sous pression de vente et les traders surveillent si le support autour de la fourchette des 60 000 $ tient.
🏦 Activité institutionnelle : Plusieurs rapports soulignent d'importantes sorties d'ETF $BTC , suggérant une demande institutionnelle réduite à court terme.
⚡ Volatilité : La peur a augmenté dans tout le marché crypto, entraînant des fluctuations de prix quotidiennes plus importantes et une performance plus faible de nombreuses pièces.
🔍 Niveaux clés à surveiller :
Support : 60 000 $–65 000 $
Résistance : 72 000 $–75 000 $
Perspectives
Si le bitcoin reprend la zone de 72k–75k, un élan haussier pourrait revenir. Une rupture en dessous du support actuel pourrait ouvrir la porte à des corrections plus profondes vers des cibles de prix inférieures discutées par certains analystes.
#BitcoinMaximalism #BitcoinWarnings #BitcoinForecast #bitcoinearningwithoutinvestment
#BitcoinEarnings
{spot}(BTCUSDT)
$BTC a chuté fortement cette semaine, tombant autour de 64 000 $–65 000 $, son niveau le plus bas en plus de trois mois. Des rapports récents évoquent des sorties d'ETF, un sentiment de marché plus faible et des prises de bénéfices par de grands investisseurs comme principaux moteurs.
Certains analystes notent que $BTC teste des niveaux de support importants après une baisse d'environ 10–13 % en seulement quelques sessions de trading.
Analyse de vente à découvert
📉 Tendance à court terme : Baissière. Bitcoin reste sous pression de vente et les traders surveillent si le support autour de la fourchette des 60 000 $ tient.
🏦 Activité institutionnelle : Plusieurs rapports soulignent d'importantes sorties d'ETF $BTC , suggérant une demande institutionnelle réduite à court terme.
⚡ Volatilité : La peur a augmenté dans tout le marché crypto, entraînant des fluctuations de prix quotidiennes plus importantes et une performance plus faible de nombreuses pièces.
🔍 Niveaux clés à surveiller :
Support : 60 000 $–65 000 $
Résistance : 72 000 $–75 000 $
Perspectives
Si le bitcoin reprend la zone de 72k–75k, un élan haussier pourrait revenir. Une rupture en dessous du support actuel pourrait ouvrir la porte à des corrections plus profondes vers des cibles de prix inférieures discutées par certains analystes.
#BitcoinMaximalism #BitcoinWarnings #BitcoinForecast #bitcoinearningwithoutinvestment
#BitcoinEarnings
Certains analystes notent que $BTC teste des niveaux de support importants après une baisse d'environ 10–13 % en seulement quelques sessions de trading.
Analyse de vente à découvert
📉 Tendance à court terme : Baissière. Bitcoin reste sous pression de vente et les traders surveillent si le support autour de la fourchette des 60 000 $ tient.
🏦 Activité institutionnelle : Plusieurs rapports soulignent d'importantes sorties d'ETF $BTC , suggérant une demande institutionnelle réduite à court terme.
⚡ Volatilité : La peur a augmenté dans tout le marché crypto, entraînant des fluctuations de prix quotidiennes plus importantes et une performance plus faible de nombreuses pièces.
🔍 Niveaux clés à surveiller :
Support : 60 000 $–65 000 $
Résistance : 72 000 $–75 000 $
Perspectives
Si le bitcoin reprend la zone de 72k–75k, un élan haussier pourrait revenir. Une rupture en dessous du support actuel pourrait ouvrir la porte à des corrections plus profondes vers des cibles de prix inférieures discutées par certains analystes.
#BitcoinMaximalism #BitcoinWarnings #BitcoinForecast #bitcoinearningwithoutinvestment
#BitcoinEarnings
86

#BinanceSquareTalks #BitcoinSlipsAfterStrongUSJobsReport #BinanceSquareFamily #BitcoinWarnings #BitcoinForecast
### 📊 Vue d'ensemble du marché
{spot}(BTCUSDT)
* **📈 Prix actuel:** **60 260,85 USD** (récupéré légèrement au-dessus du niveau psychologique des 60k).
* **🔴 Changement sur 24h:** **-5,34%**
* **📉 Tendance:** Globalement **Baissière** (vers le bas). Bien qu'il y ait un léger rebond vert à la toute fin, le graphique horaire montre toujours un schéma stable de sommets plus bas et de creux plus bas.
### 🛑 Niveaux clés
* **🛡️ Support immédiat:** **59 128,59 USD** (Bas sur 24h). Cette zone a récemment agi comme une zone de rebond.
* **🧱 Résistance immédiate:** **63 928,30 USD** (Haut sur 24h), avec un sommet horaire à **67 357,41 USD**.
### ⚖️ Carnet de commandes & Sentiment
* **🟢 Offres (Acheter):** **38,44%**
* **🔴 Demandes (Vendre):** **61,56%**
* **⚠️ Sentiment:** Négatif, mais montrant une légère amélioration par rapport aux heures précédentes alors que les acheteurs (offres) reviennent lentement près du seuil des 60k. Les vendeurs gardent toujours l'avantage.
### 📅 Retours historiques
* **⏳ 7 Jours:** -18,45%
* **⏳ 30 Jours:** -25,99%
* **⏳ 180 Jours:** -33,92%
> **🎯 Conclusion:** BTC tente un léger rallye de soulagement depuis son plancher de support à **59 128 USD**. Cependant, le marché global reste fermement sous pression baissière. Surveillez s'il peut tenir au-dessus de **60 000 USD**; un échec à le faire déclenchera probablement un autre test du bas récent.
#BinanceSquareTalks #BitcoinSlipsAfterStrongUSJobsReport #BinanceSquareFamily #BitcoinWarnings #BitcoinForecast
### 📊 Vue d'ensemble du marché
* **📈 Prix actuel:** **60 260,85 USD** (récupéré légèrement au-dessus du niveau psychologique des 60k).
* **🔴 Changement sur 24h:** **-5,34%**
* **📉 Tendance:** Globalement **Baissière** (vers le bas). Bien qu'il y ait un léger rebond vert à la toute fin, le graphique horaire montre toujours un schéma stable de sommets plus bas et de creux plus bas.
### 🛑 Niveaux clés
* **🛡️ Support immédiat:** **59 128,59 USD** (Bas sur 24h). Cette zone a récemment agi comme une zone de rebond.
* **🧱 Résistance immédiate:** **63 928,30 USD** (Haut sur 24h), avec un sommet horaire à **67 357,41 USD**.
### ⚖️ Carnet de commandes & Sentiment
* **🟢 Offres (Acheter):** **38,44%**
* **🔴 Demandes (Vendre):** **61,56%**
* **⚠️ Sentiment:** Négatif, mais montrant une légère amélioration par rapport aux heures précédentes alors que les acheteurs (offres) reviennent lentement près du seuil des 60k. Les vendeurs gardent toujours l'avantage.
### 📅 Retours historiques
* **⏳ 7 Jours:** -18,45%
* **⏳ 30 Jours:** -25,99%
* **⏳ 180 Jours:** -33,92%
> **🎯 Conclusion:** BTC tente un léger rallye de soulagement depuis son plancher de support à **59 128 USD**. Cependant, le marché global reste fermement sous pression baissière. Surveillez s'il peut tenir au-dessus de **60 000 USD**; un échec à le faire déclenchera probablement un autre test du bas récent.
### 📊 Vue d'ensemble du marché
* **📈 Prix actuel:** **60 260,85 USD** (récupéré légèrement au-dessus du niveau psychologique des 60k).
* **🔴 Changement sur 24h:** **-5,34%**
* **📉 Tendance:** Globalement **Baissière** (vers le bas). Bien qu'il y ait un léger rebond vert à la toute fin, le graphique horaire montre toujours un schéma stable de sommets plus bas et de creux plus bas.
### 🛑 Niveaux clés
* **🛡️ Support immédiat:** **59 128,59 USD** (Bas sur 24h). Cette zone a récemment agi comme une zone de rebond.
* **🧱 Résistance immédiate:** **63 928,30 USD** (Haut sur 24h), avec un sommet horaire à **67 357,41 USD**.
### ⚖️ Carnet de commandes & Sentiment
* **🟢 Offres (Acheter):** **38,44%**
* **🔴 Demandes (Vendre):** **61,56%**
* **⚠️ Sentiment:** Négatif, mais montrant une légère amélioration par rapport aux heures précédentes alors que les acheteurs (offres) reviennent lentement près du seuil des 60k. Les vendeurs gardent toujours l'avantage.
### 📅 Retours historiques
* **⏳ 7 Jours:** -18,45%
* **⏳ 30 Jours:** -25,99%
* **⏳ 180 Jours:** -33,92%
> **🎯 Conclusion:** BTC tente un léger rallye de soulagement depuis son plancher de support à **59 128 USD**. Cependant, le marché global reste fermement sous pression baissière. Surveillez s'il peut tenir au-dessus de **60 000 USD**; un échec à le faire déclenchera probablement un autre test du bas récent.
33
1
80
·
--
Bitcoin Kerap Bergejolak Saat FOMC Berlangsung
Les données historiques montrent que Bitcoin connaît souvent une volatilité élevée autour des périodes de FOMC.
Selon CoinPedia, Bitcoin a subi une correction significative après plusieurs réunions précédentes du FOMC, notamment :
Octobre : baisse d'environ 30%
Décembre : baisse d'environ 10%
Janvier : baisse d'environ 33%
Mars : baisse d'environ 14%
Avril : baisse d'environ 28%
Ces données montrent que Bitcoin a connu plusieurs corrections significatives autour des périodes de FOMC.
Ces mouvements se produisent alors que l'attention des investisseurs se concentre sur les perspectives des taux d'intérêt, de l'inflation et de la politique monétaire des États-Unis.
L'inflation Reste un Facteur Clé
L'inflation demeure le principal point d'attention du marché avant le FOMC. La Fed vise historiquement une inflation à 2%, donc les investisseurs surveilleront chaque indice concernant les perspectives d'inflation et la direction des taux d'intérêt à venir.
Les commentaires de la Réserve fédérale concernant la pression sur les prix et la politique monétaire à venir pourraient influencer le sentiment du marché, y compris envers des actifs risqués comme Bitcoin.
$BTC
{spot}(BTCUSDT)
#BitcoinWarnings
Bitcoin Kerap Bergejolak Saat FOMC Berlangsung
Les données historiques montrent que Bitcoin connaît souvent une volatilité élevée autour des périodes de FOMC.
Selon CoinPedia, Bitcoin a subi une correction significative après plusieurs réunions précédentes du FOMC, notamment :
Octobre : baisse d'environ 30%
Décembre : baisse d'environ 10%
Janvier : baisse d'environ 33%
Mars : baisse d'environ 14%
Avril : baisse d'environ 28%
Ces données montrent que Bitcoin a connu plusieurs corrections significatives autour des périodes de FOMC.
Ces mouvements se produisent alors que l'attention des investisseurs se concentre sur les perspectives des taux d'intérêt, de l'inflation et de la politique monétaire des États-Unis.
L'inflation Reste un Facteur Clé
L'inflation demeure le principal point d'attention du marché avant le FOMC. La Fed vise historiquement une inflation à 2%, donc les investisseurs surveilleront chaque indice concernant les perspectives d'inflation et la direction des taux d'intérêt à venir.
Les commentaires de la Réserve fédérale concernant la pression sur les prix et la politique monétaire à venir pourraient influencer le sentiment du marché, y compris envers des actifs risqués comme Bitcoin.
$BTC
#BitcoinWarnings
Les données historiques montrent que Bitcoin connaît souvent une volatilité élevée autour des périodes de FOMC.
Selon CoinPedia, Bitcoin a subi une correction significative après plusieurs réunions précédentes du FOMC, notamment :
Octobre : baisse d'environ 30%
Décembre : baisse d'environ 10%
Janvier : baisse d'environ 33%
Mars : baisse d'environ 14%
Avril : baisse d'environ 28%
Ces données montrent que Bitcoin a connu plusieurs corrections significatives autour des périodes de FOMC.
Ces mouvements se produisent alors que l'attention des investisseurs se concentre sur les perspectives des taux d'intérêt, de l'inflation et de la politique monétaire des États-Unis.
L'inflation Reste un Facteur Clé
L'inflation demeure le principal point d'attention du marché avant le FOMC. La Fed vise historiquement une inflation à 2%, donc les investisseurs surveilleront chaque indice concernant les perspectives d'inflation et la direction des taux d'intérêt à venir.
Les commentaires de la Réserve fédérale concernant la pression sur les prix et la politique monétaire à venir pourraient influencer le sentiment du marché, y compris envers des actifs risqués comme Bitcoin.
$BTC
#BitcoinWarnings
82

·
--
Baissier
#BitcoinWarnings $BTC Ne montera plus jamais jusqu’à ce que le président Trump quitte ses fonctions. Mettez ceci à l’abri. Nous sommes baissiers pour toute la durée de son mandat.
{future}(BTCUSDT)
#BitcoinWarnings $BTC Ne montera plus jamais jusqu’à ce que le président Trump quitte ses fonctions. Mettez ceci à l’abri. Nous sommes baissiers pour toute la durée de son mandat.

1
31

·
--
📉 Le Bitcoin clôture sous 75 000 $.. Les marchés se préparent-ils à une nouvelle vague de correction ?🔴 Le Bitcoin échoue à reprendre le niveau de 75 000 $ avec des clôtures négatives
Le Bitcoin a terminé ses échanges du dernier mois à 73 580 $, tandis qu'il a clôturé la semaine à 73 931 $, signalant une faiblesse persistante du momentum haussier et l'incapacité des acheteurs à reprendre le seuil psychologique et technique important à 75 000 $.
L'échec des clôtures mensuelles et hebdomadaires au-dessus de ce niveau est perçu comme un facteur négatif à court terme, maintenant les pressions de vente et donnant aux vendeurs un avantage relatif dans le mouvement actuel du marché.
📉 Le Bitcoin clôture sous 75 000 $.. Les marchés se préparent-ils à une nouvelle vague de correction ?
🔴 Le Bitcoin échoue à reprendre le niveau de 75 000 $ avec des clôtures négatives
Le Bitcoin a terminé ses échanges du dernier mois à 73 580 $, tandis qu'il a clôturé la semaine à 73 931 $, signalant une faiblesse persistante du momentum haussier et l'incapacité des acheteurs à reprendre le seuil psychologique et technique important à 75 000 $.
L'échec des clôtures mensuelles et hebdomadaires au-dessus de ce niveau est perçu comme un facteur négatif à court terme, maintenant les pressions de vente et donnant aux vendeurs un avantage relatif dans le mouvement actuel du marché.
Le Bitcoin a terminé ses échanges du dernier mois à 73 580 $, tandis qu'il a clôturé la semaine à 73 931 $, signalant une faiblesse persistante du momentum haussier et l'incapacité des acheteurs à reprendre le seuil psychologique et technique important à 75 000 $.
L'échec des clôtures mensuelles et hebdomadaires au-dessus de ce niveau est perçu comme un facteur négatif à court terme, maintenant les pressions de vente et donnant aux vendeurs un avantage relatif dans le mouvement actuel du marché.
3
230

·
--
🚨 59 000 $ tenus… mais ne vous détendez pas. Ce marché est à une seule bougie du chaos.Je vais être brutalement honnête avec vous tout de suite. 👀
$BTC et $SOL viennent de nous lancer un avertissement.
La plupart des traders ont célébré le rebond. Les smart money observent autre chose. 🦈
Parlons d’abord du BTC 👇
Passage à 59,1 K$ → rebond à 61,3 K$
On dirait un sauvetage, non ?
Faux. Regarde de plus près :
📉 Des plus hauts plus bas se forment
📉 Des plus bas en baisse
📉 L’élan baissier est toujours bien vivant
Les niveaux qui comptent EN CE MOMENT :
🟢 Tenir 59 000–60 000 $ = les taureaux respirent toujours
🔴 Perdre 59 000 $ = prochaine étape 57 000 $… puis 55 000 $
🚨 59 000 $ tenus… mais ne vous détendez pas. Ce marché est à une seule bougie du chaos.
Je vais être brutalement honnête avec vous tout de suite. 👀
$BTC et $SOL viennent de nous lancer un avertissement.
La plupart des traders ont célébré le rebond. Les smart money observent autre chose. 🦈
Parlons d’abord du BTC 👇
Passage à 59,1 K$ → rebond à 61,3 K$
On dirait un sauvetage, non ?
Faux. Regarde de plus près :
📉 Des plus hauts plus bas se forment
📉 Des plus bas en baisse
📉 L’élan baissier est toujours bien vivant
Les niveaux qui comptent EN CE MOMENT :
🟢 Tenir 59 000–60 000 $ = les taureaux respirent toujours
🔴 Perdre 59 000 $ = prochaine étape 57 000 $… puis 55 000 $
$BTC et $SOL viennent de nous lancer un avertissement.
La plupart des traders ont célébré le rebond. Les smart money observent autre chose. 🦈
Parlons d’abord du BTC 👇
Passage à 59,1 K$ → rebond à 61,3 K$
On dirait un sauvetage, non ?
Faux. Regarde de plus près :
📉 Des plus hauts plus bas se forment
📉 Des plus bas en baisse
📉 L’élan baissier est toujours bien vivant
Les niveaux qui comptent EN CE MOMENT :
🟢 Tenir 59 000–60 000 $ = les taureaux respirent toujours
🔴 Perdre 59 000 $ = prochaine étape 57 000 $… puis 55 000 $
130
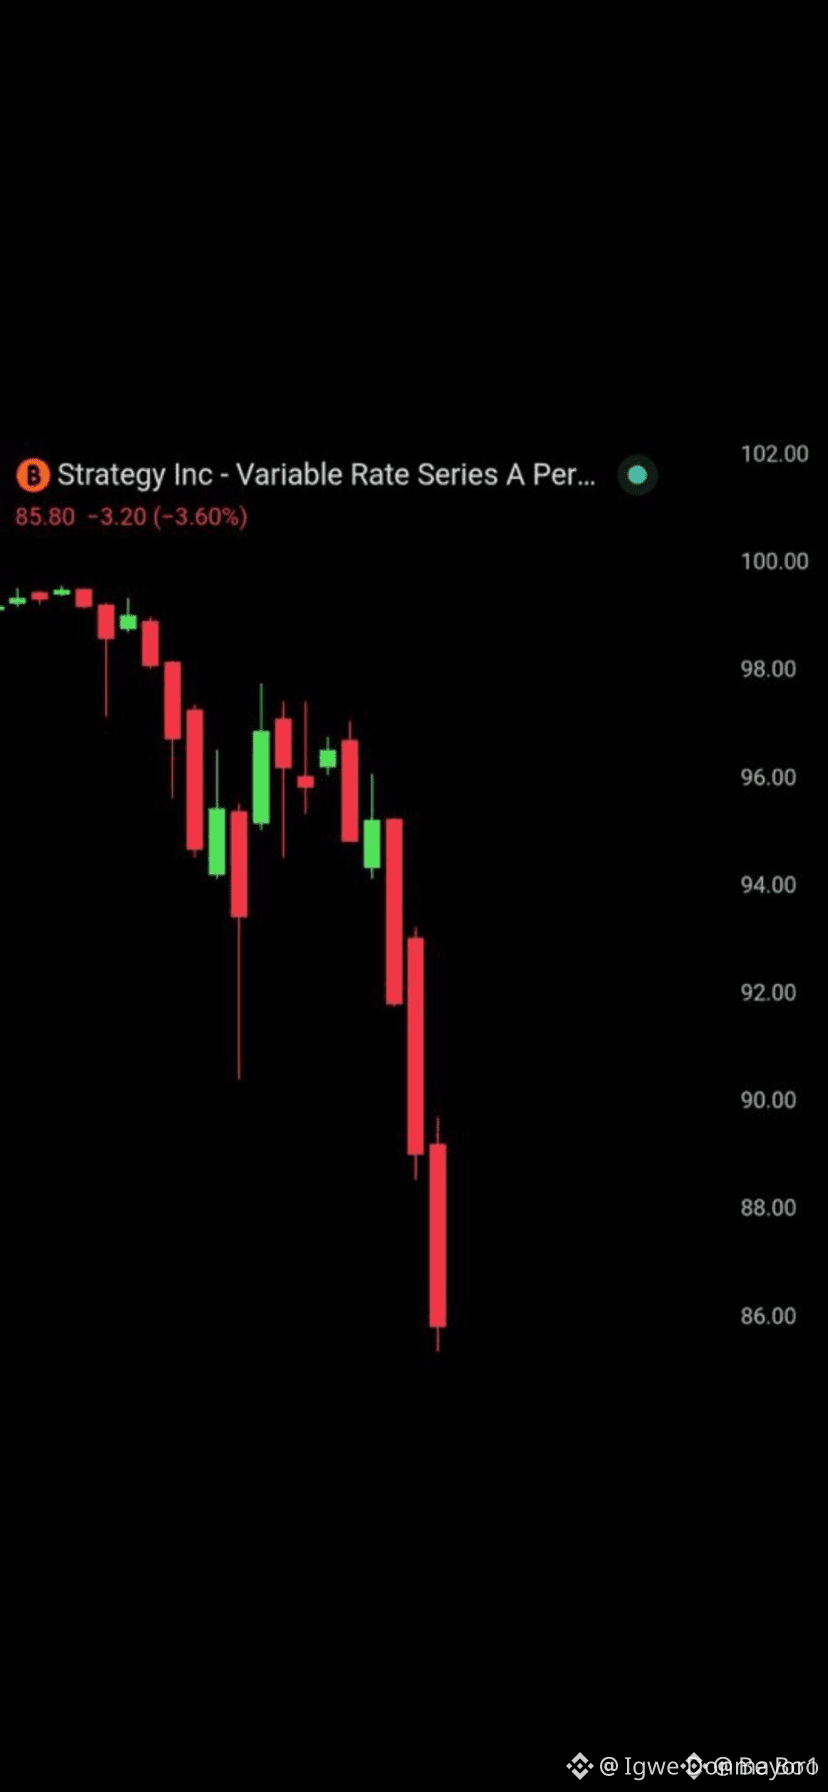
URGENT : L'action préférentielle adossée au Bitcoin de Michael Saylor, $STRC, vient de chuter à 85,32 $, son point le plus bas jamais atteint.
La société risque d'être contrainte de short plusieurs millions de dollars de Bitcoin dans les jours à venir pour éviter les appels de marge.
{future}(BTCUSDT)
#BitcoinWarnings
URGENT : L'action préférentielle adossée au Bitcoin de Michael Saylor, $STRC, vient de chuter à 85,32 $, son point le plus bas jamais atteint.
La société risque d'être contrainte de short plusieurs millions de dollars de Bitcoin dans les jours à venir pour éviter les appels de marge.
#BitcoinWarnings
La société risque d'être contrainte de short plusieurs millions de dollars de Bitcoin dans les jours à venir pour éviter les appels de marge.
#BitcoinWarnings

58

·
--
Article
Le Bitcoin est-il tombé en dessous de 70 000 $? Pourquoi ? Aujourd'hui
#BtcPourquoi le Bitcoin est-il tombé en dessous de 70 000 $ aujourd'hui ?
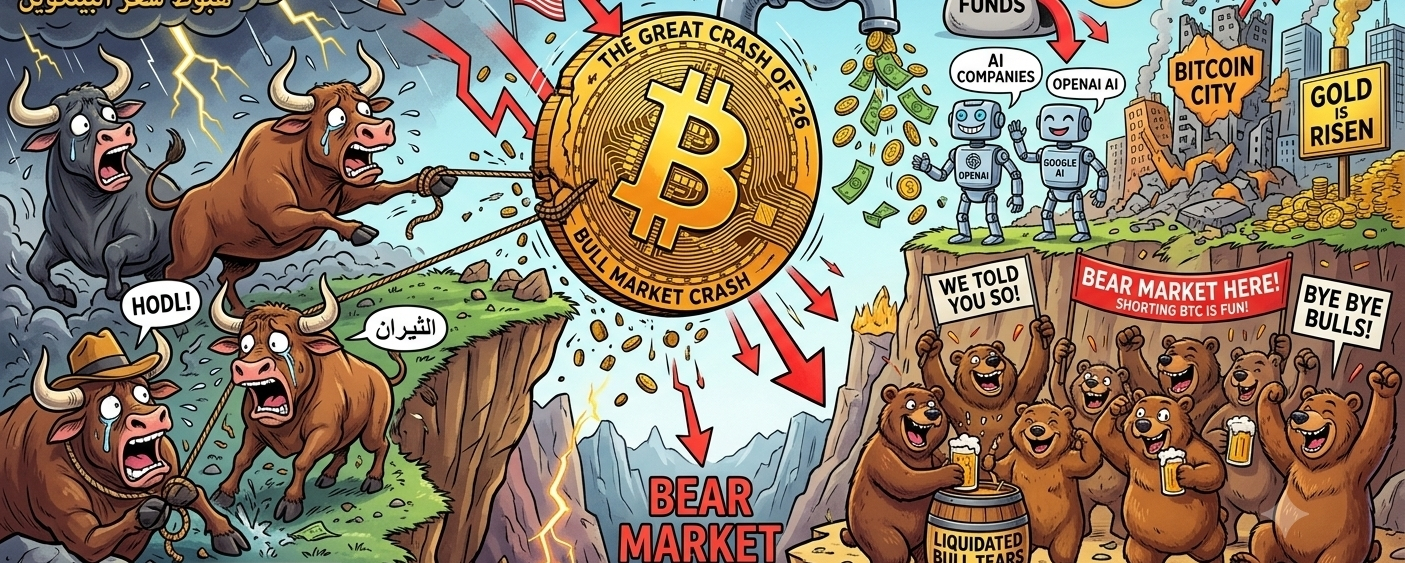
Le marché des cryptos a connu une chute brutale aujourd'hui, mardi **2 juin 2026**, poussant le Bitcoin (BTC) à franchir des niveaux de support technique clés. Le prix a plongé en dessous de la barre des **70 000 $**, atteignant environ **67 000 $** sur certaines plateformes, enregistrant une chute quotidienne de plus de **5%**.
Cette baisse n'était pas simplement une fluctuation transitoire ; elle résultait plutôt d'une combinaison de facteurs économiques et géopolitiques qui ont assombri l'appétit des investisseurs pour le risque.
Le Bitcoin est-il tombé en dessous de 70 000 $? Pourquoi ? Aujourd'hui #Btc
Pourquoi le Bitcoin est-il tombé en dessous de 70 000 $ aujourd'hui ?
Le marché des cryptos a connu une chute brutale aujourd'hui, mardi **2 juin 2026**, poussant le Bitcoin (BTC) à franchir des niveaux de support technique clés. Le prix a plongé en dessous de la barre des **70 000 $**, atteignant environ **67 000 $** sur certaines plateformes, enregistrant une chute quotidienne de plus de **5%**.
Cette baisse n'était pas simplement une fluctuation transitoire ; elle résultait plutôt d'une combinaison de facteurs économiques et géopolitiques qui ont assombri l'appétit des investisseurs pour le risque.
Le marché des cryptos a connu une chute brutale aujourd'hui, mardi **2 juin 2026**, poussant le Bitcoin (BTC) à franchir des niveaux de support technique clés. Le prix a plongé en dessous de la barre des **70 000 $**, atteignant environ **67 000 $** sur certaines plateformes, enregistrant une chute quotidienne de plus de **5%**.
Cette baisse n'était pas simplement une fluctuation transitoire ; elle résultait plutôt d'une combinaison de facteurs économiques et géopolitiques qui ont assombri l'appétit des investisseurs pour le risque.
118

·
--
Baissier
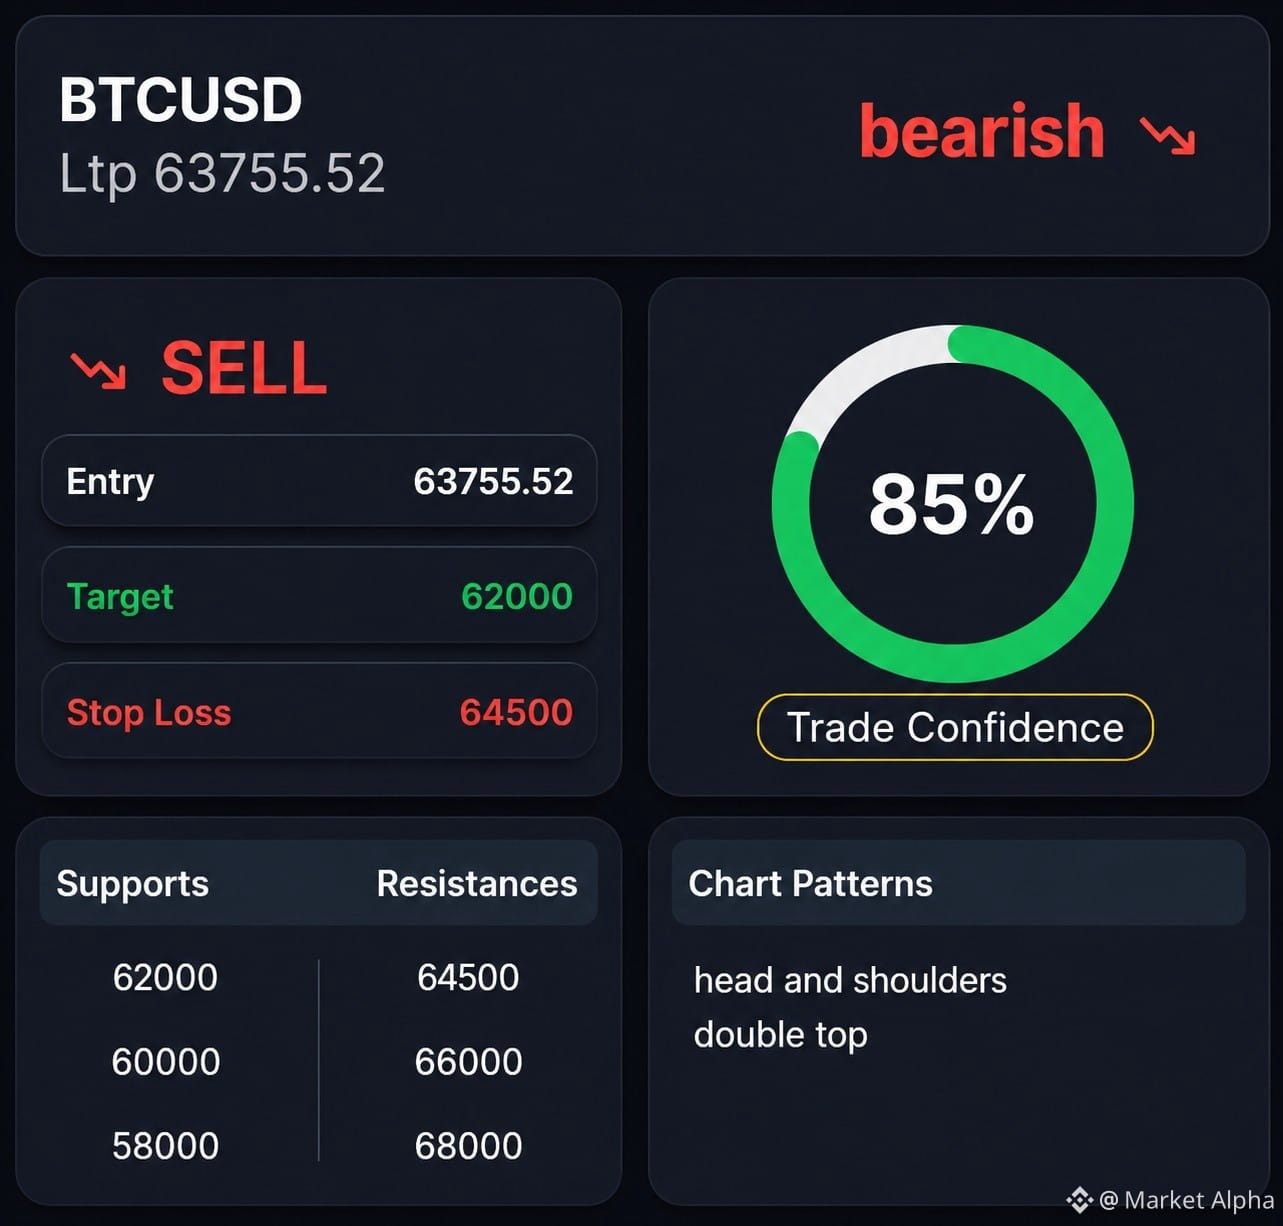
$BTC L’action actuelle des prix montre un modèle classique en tête et épaules, indiquant un potentiel renversement par rapport à la tendance haussière précédente. Ce schéma est associé à une formation en double sommet, renforçant davantage le sentiment baissier. Le prix a échoué à plusieurs reprises à franchir les niveaux de résistance, ce qui indique une forte pression vendeuse. Cette inclinaison baissière est corroborée par les indicateurs techniques. Le RSI est en dessous de 30, ce qui signifie que l’actif est survendu. Le MACD indique un croisement baissier, signalant un changement à la baisse du momentum. De plus, le prix évolue sous les moyennes mobiles sur 50 jours et sur 200 jours, qui sont des indicateurs clés d’une tendance baissière durable. Le prix cible calculé offre un meilleur ratio risque/rendement par rapport au niveau de stop-loss, ce qui apporte de la confiance à la recommandation de vente.
#BTC #BitcoinPriceDrop #BitcoinWarnings
$BTC L’action actuelle des prix montre un modèle classique en tête et épaules, indiquant un potentiel renversement par rapport à la tendance haussière précédente. Ce schéma est associé à une formation en double sommet, renforçant davantage le sentiment baissier. Le prix a échoué à plusieurs reprises à franchir les niveaux de résistance, ce qui indique une forte pression vendeuse. Cette inclinaison baissière est corroborée par les indicateurs techniques. Le RSI est en dessous de 30, ce qui signifie que l’actif est survendu. Le MACD indique un croisement baissier, signalant un changement à la baisse du momentum. De plus, le prix évolue sous les moyennes mobiles sur 50 jours et sur 200 jours, qui sont des indicateurs clés d’une tendance baissière durable. Le prix cible calculé offre un meilleur ratio risque/rendement par rapport au niveau de stop-loss, ce qui apporte de la confiance à la recommandation de vente.
#BTC #BitcoinPriceDrop #BitcoinWarnings
#BTC #BitcoinPriceDrop #BitcoinWarnings
172

·
--
La Semaine de la Téléportation
🚀 +23,6% en seulement sept jours.
En une seule semaine —
Les objectifs trimestriels volent en éclats.
Les arguments baissiers s’évaporent.
Les liquidités mises à l’écart se précipitent pour rattraper.
Pas parce que le PIB mondial a progressé d’un quart en sept jours…
mais parce que les flux de liquidité vont là où l’élan les exige.
Les marchés crypto modernes ne marchent pas — ils téléportent.
Et vous vous demandez…
Les acheteurs accumulent-ils avec une conviction réelle…
ou bien le FOMO fait-il foncer le véhicule tout droit vers un mur?
#BitcoinRises23.6%Weekly #BitcoinWarnings
La Semaine de la Téléportation
🚀 +23,6% en seulement sept jours.
En une seule semaine —
Les objectifs trimestriels volent en éclats.
Les arguments baissiers s’évaporent.
Les liquidités mises à l’écart se précipitent pour rattraper.
Pas parce que le PIB mondial a progressé d’un quart en sept jours…
mais parce que les flux de liquidité vont là où l’élan les exige.
Les marchés crypto modernes ne marchent pas — ils téléportent.
Et vous vous demandez…
Les acheteurs accumulent-ils avec une conviction réelle…
ou bien le FOMO fait-il foncer le véhicule tout droit vers un mur?
#BitcoinRises23.6%Weekly #BitcoinWarnings
🚀 +23,6% en seulement sept jours.
En une seule semaine —
Les objectifs trimestriels volent en éclats.
Les arguments baissiers s’évaporent.
Les liquidités mises à l’écart se précipitent pour rattraper.
Pas parce que le PIB mondial a progressé d’un quart en sept jours…
mais parce que les flux de liquidité vont là où l’élan les exige.
Les marchés crypto modernes ne marchent pas — ils téléportent.
Et vous vous demandez…
Les acheteurs accumulent-ils avec une conviction réelle…
ou bien le FOMO fait-il foncer le véhicule tout droit vers un mur?
#BitcoinRises23.6%Weekly #BitcoinWarnings
78

💐BITCOIN : QU’EST-CE QUI POURRAIT DÉCLENCHER LE PROCHAIN GRAND MOUVEMENT ? ₿🔥Le Bitcoin attire à nouveau l’attention du marché des cryptos ! 👀
Mais la grande question est :
📈 Le BTC se prépare-t-il à une nouvelle cassure — ou à une correction ?
Voici 5 catalyseurs clés à surveiller :
💰 1. Flux de la ETF
Une demande institutionnelle croissante pourrait fournir un nouvel élan au Bitcoin.
🏦 2. La Fed et les taux d’intérêt
Un assouplissement de la politique monétaire et une liquidité en amélioration pourraient stimuler les actifs à risque comme le BTC.
🚀 3. Cassure au-dessus de la résistance
Un mouvement fort au-dessus d’une résistance majeure avec un volume élevé pourrait déclencher une nouvelle vague d’achats.
💐BITCOIN : QU’EST-CE QUI POURRAIT DÉCLENCHER LE PROCHAIN GRAND MOUVEMENT ? ₿🔥
Le Bitcoin attire à nouveau l’attention du marché des cryptos ! 👀
Mais la grande question est :
📈 Le BTC se prépare-t-il à une nouvelle cassure — ou à une correction ?
Voici 5 catalyseurs clés à surveiller :
💰 1. Flux de la ETF
Une demande institutionnelle croissante pourrait fournir un nouvel élan au Bitcoin.
🏦 2. La Fed et les taux d’intérêt
Un assouplissement de la politique monétaire et une liquidité en amélioration pourraient stimuler les actifs à risque comme le BTC.
🚀 3. Cassure au-dessus de la résistance
Un mouvement fort au-dessus d’une résistance majeure avec un volume élevé pourrait déclencher une nouvelle vague d’achats.
Mais la grande question est :
📈 Le BTC se prépare-t-il à une nouvelle cassure — ou à une correction ?
Voici 5 catalyseurs clés à surveiller :
💰 1. Flux de la ETF
Une demande institutionnelle croissante pourrait fournir un nouvel élan au Bitcoin.
🏦 2. La Fed et les taux d’intérêt
Un assouplissement de la politique monétaire et une liquidité en amélioration pourraient stimuler les actifs à risque comme le BTC.
🚀 3. Cassure au-dessus de la résistance
Un mouvement fort au-dessus d’une résistance majeure avec un volume élevé pourrait déclencher une nouvelle vague d’achats.
13
2
4
30

·
--
Baissier
BONJOUR comment allez-vous je veux juste donner mon avis sur le bitcoin je pense qu'il baissera jusqu'à 45k. #BitcoinWarnings
BONJOUR comment allez-vous je veux juste donner mon avis sur le bitcoin je pense qu'il baissera jusqu'à 45k. #BitcoinWarnings
1
89
Connectez-vous pour découvrir plus de contenu
Rejoignez la communauté mondiale des adeptes de cryptomonnaies sur Binance Square
⚡️ Suviez les dernières informations importantes sur les cryptomonnaies.
💬 Jugé digne de confiance par la plus grande plateforme d’échange de cryptomonnaies au monde.
👍 Découvrez les connaissances que partagent les créateurs vérifiés.
Adresse e-mail/Nº de téléphone
Sujets d’actualité
1
#AnthropicCEOCallsForAISlowdown
14,909 vues
304 mentions
2
#AnthropicChoosesNasdaqForPotentialIPO
3,031 vues
84 mentions
3
#SECReceivesGrayscaleLitecoinTrustETFFiling
132,525 vues
1,813 mentions
4
#ClarityActFacesProceduralVoteSept15
266,038 vues
2,698 mentions
5
#US10YearTreasuryYieldNears5%
102,057 vues
1,501 mentions
6
#CryptoLiquidations$674MIn24H
25,644 vues
219 mentions
7
#TokenizedStockHoldersUp619.1%
77,474 vues
1,218 mentions
8
#RevolutConfirmsFakeGovEmailDataBreach
117,813 vues
1,503 mentions
9
#CanadaOSFISaysTokenizedDepositsEqualTraditionalDeposits
6,217 vues
126 mentions
10
#USBankCompletesCrossBorderPaymentPilotOnStellar
91,081 vues
1,312 mentions