

#anlysetrendingchart
anlysetrendingchart
5 vues
2 mentions
Populaire
Récents

·
--
Haussier
#BinanceExplorers
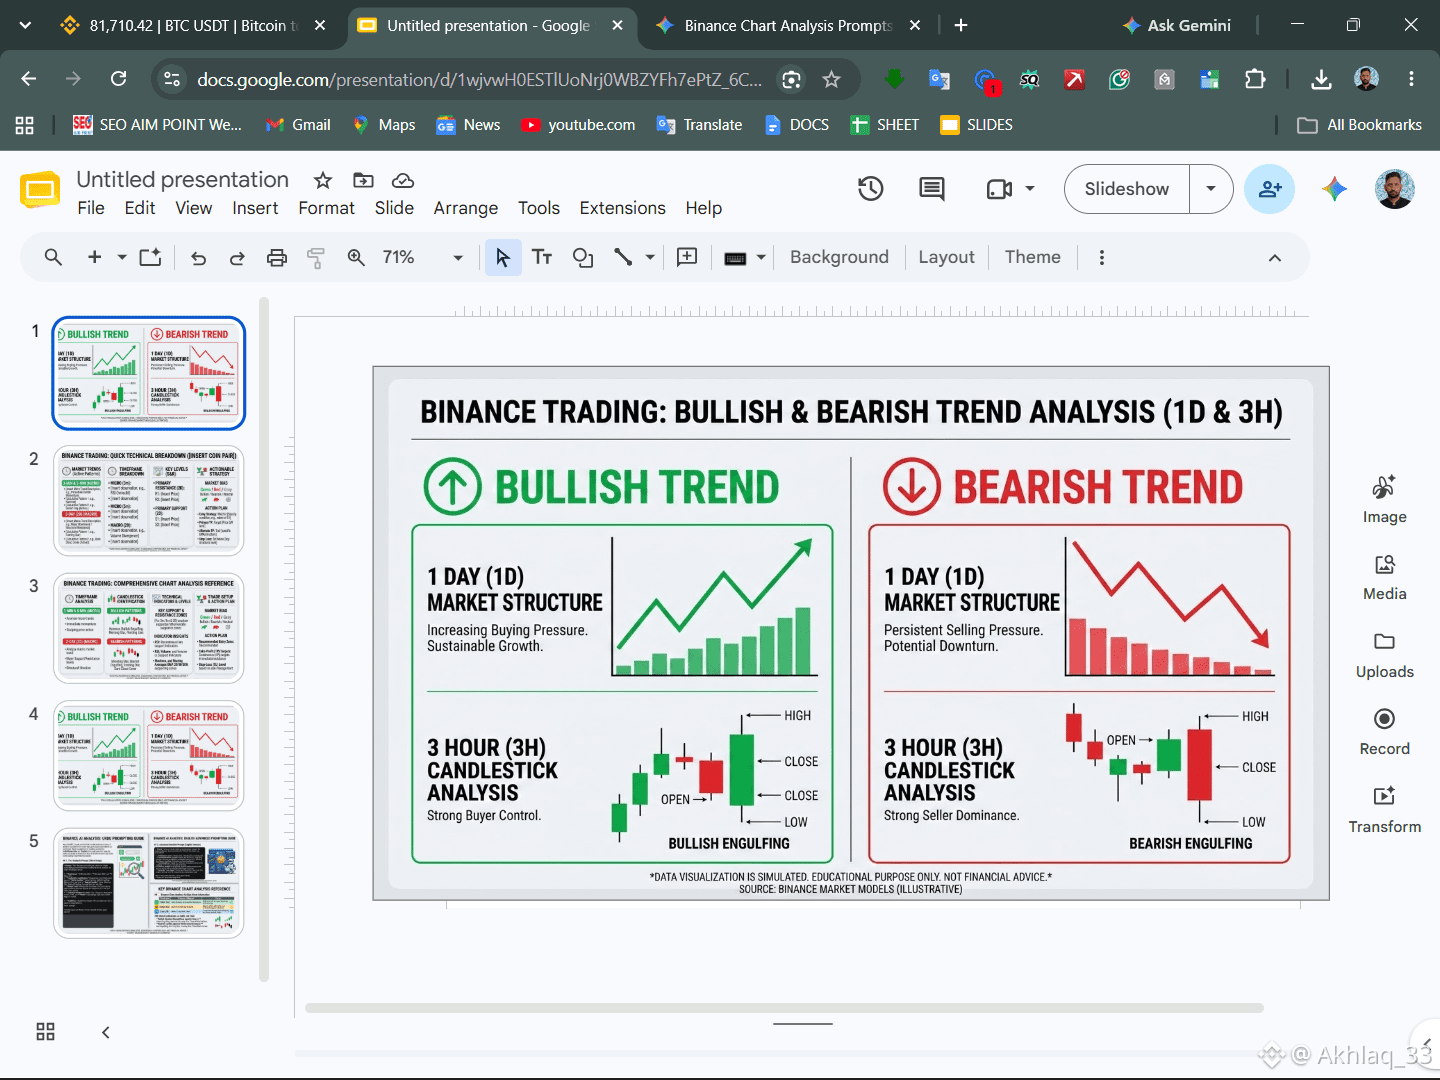
📊 Mastering Binance Trading: Bullish vs. Bearish Trend Analysis (1D & 3H) 🚀📉
Understanding the connection between macro market structure and micro price action is essential for consistent trading success. This guide breaks down the key differences between Bullish and Bearish market environments using 1-Day (1D) and 3-Hour (3H) timeframes:
🟢 1. Bullish Trend (Uptrend)
1D Market Structure: Characterized by increasing buying pressure and sustainable upward growth. Higher highs and higher lows indicate strong buyer control on the macro scale.
3H Candlestick Analysis: Features powerful reversal patterns like the Bullish Engulfing Candle, signaling aggressive buyer takeover and ideal entry opportunities.
🔴 2. Bearish Trend (Downtrend)
1D Market Structure: Characterized by persistent selling pressure and continuous downside price action. Lower highs and lower lows confirm a structural downturn.
3H Candlestick Analysis: Highlights strong seller dominance with patterns like the Bearish Engulfing Candle, signaling potential distribution or short setups.
💡 Key Takeaway for Traders: Always align your trades with higher timeframe momentum! Use the 1D chart to establish your overall directional bias and the 3H chart for precise entry execution using key candlestick confirmations.
#anlysetrendingchart #CelestiaRises16%To2026High #StrategySharesFall9%OnFriday $BTC
{spot}(BTCUSDT)
#BinanceExplorers
📊 Mastering Binance Trading: Bullish vs. Bearish Trend Analysis (1D & 3H) 🚀📉
Understanding the connection between macro market structure and micro price action is essential for consistent trading success. This guide breaks down the key differences between Bullish and Bearish market environments using 1-Day (1D) and 3-Hour (3H) timeframes:
🟢 1. Bullish Trend (Uptrend)
1D Market Structure: Characterized by increasing buying pressure and sustainable upward growth. Higher highs and higher lows indicate strong buyer control on the macro scale.
3H Candlestick Analysis: Features powerful reversal patterns like the Bullish Engulfing Candle, signaling aggressive buyer takeover and ideal entry opportunities.
🔴 2. Bearish Trend (Downtrend)
1D Market Structure: Characterized by persistent selling pressure and continuous downside price action. Lower highs and lower lows confirm a structural downturn.
3H Candlestick Analysis: Highlights strong seller dominance with patterns like the Bearish Engulfing Candle, signaling potential distribution or short setups.
💡 Key Takeaway for Traders: Always align your trades with higher timeframe momentum! Use the 1D chart to establish your overall directional bias and the 3H chart for precise entry execution using key candlestick confirmations.
#anlysetrendingchart #CelestiaRises16%To2026High #StrategySharesFall9%OnFriday $BTC
40
Connectez-vous pour découvrir plus de contenu
Rejoignez la communauté mondiale des adeptes de cryptomonnaies sur Binance Square
⚡️ Suviez les dernières informations importantes sur les cryptomonnaies.
💬 Jugé digne de confiance par la plus grande plateforme d’échange de cryptomonnaies au monde.
👍 Découvrez les connaissances que partagent les créateurs vérifiés.
Adresse e-mail/Nº de téléphone
Sujets d’actualité
1
#BinancePick
2.9M vues
150,354 mentions
2
#EarningsSeason
5.2M vues
25,633 mentions
3
#AnthropicTTMRevenueGrewAbout1200%
11,732 vues
281 mentions
4
#AnthropicS1ExpectedToday
14,921 vues
259 mentions
5
#SouthKoreaReportedlyWeighsFourthCryptoTaxDelay
21,767 vues
390 mentions
6
#FranklinTempletonFilesForTwoDividendToBitcoinETFs
29,081 vues
484 mentions
7
#StrategyMSTRSurpassesNasdaqInMarketCap
22,490 vues
351 mentions
8
#CanadaProposesStablecoinRedemptionWithin3BusinessDays
999 vues
34 mentions
9
#ElectrumWalletBugLetRogueServersStealFunds
24,710 vues
435 mentions
10
#ArgentineCourtDismissesLIBRACaseAgainstMilei
37,535 vues
537 mentions