

#earnfreecrypto2024
earnfreecrypto2024
67.5M vues
34,714 mentions
Get involved with our #EarnFreeCrypto2024 campaign for a chance to win up to 500 FDUSD! Share your top 6 ways to earn free cryptocurrency in 2024. Include solutions such as airdrops, specifically Binance's Megadrop, features like Binance Earn, Binance Learn and Earn, Binance Launchpool, Write2Earn on Binance Square, referral programmes, and social media giveaways.
Populaire
Récents


Article
Participate in #EarnFreeCrypto2024 and win up to 500 FDUSD! Dive into our #EarnFreeCrypto2024 campaign to seize a chance to win up to 500 FDUSD! 💰 Post an informative article on Binance Square, outlining your top 6 strategies for earning free cryptocurrency in 2024. Dive into techniques like airdrops, particularly highlighting Binance's Megadrop, tools like Binance Earn, Binance Learn and Earn, Binance Launchpool, Write2Earn on Binance Square, enticing referral programmes, and dynamic social media giveaways.
Campaign Period: 2024-05-24 00:00 to 2024-05-29 23:59 (UTC)
To Participate:
Craft an in-depth article on Binance Square, where you present your top strategies to earn free cryptocurrency. Deliver comprehensive insights into each method, elaborating on how users can actively participate. Your article can feature Binance’s products or campaigns, such as:
Binance [Megadrop](https://www.binance.com/en/megadrop)Binance [Earn](https://www.binance.com/en/earn) Binance [Launchpool](https://launchpad.binance.com/en)Binance [Learn and Earn](https://academy.binance.com/en/learn-and-earn)[Write2Earn](https://www.binance.com/en/square/WritetoEarn) on Binance Square.
Make sure your article has a minimum length of 600 words.
Guidelines:
Make certain your shared content is original, filled with insightful information, and based on real incidents. Posts with high engagement lacking original content may be disqualified.
Winner Selection:
Five posts generating the most interaction will each be rewarded with 100 FDUSD.
Terms and Conditions:
This campaign may not be available in your region.Submissions will be evaluated by a panel from the Binance Square team, based on topic relevance, formatting, research quality, factual sourcing, and originality. Content must also align with Campaign Rules. Only content no shorter than 600 words will qualify for the rewards.Posts that attempt to boost engagement by exploiting Red Packets and giveaways will be disqualified.The content needs to be posted on Binance Square organically to qualify for the reward.Winners of the week will be notified within 14 days via a push notification under Creator Center > [Square Assistant](https://www.binance.com/feed/secretary). Entries by Media & Project partners will not be considered for this campaign.The FDUSD token voucher rewards will be distributed within 30 working days after the activity ends. Users may check their rewards via Profile > [Rewards Hub](https://www.binance.com/rewards-hub). The validity period for the token voucher is set at seven days from the day of distribution. [Learn how to redeem a voucher](https://www.binance.com/support/faq/what-are-binance-vouchers-and-how-to-redeem-acb5e3f3e3024506b8f4cedefe334d0e).Illegally bulk registered accounts or sub-accounts shall not be eligible to participate or receive any rewards. Binance reserves the right to disqualify any account acting against the [Binance Square Community Guidelines](https://www.binance.com/support/faq/binance-square-community-management-guidelines-ecb50ef2012f40b2a2c4f72eaa5b569f) or [Terms and Conditions](https://www.binance.com/support/faq/binance-square-community-platform-terms-and-conditions-5dfcea5fbc0d4c4c9c90c2597f3da358).Binance reserves the right at any time in its sole and absolute discretion to determine and/or amend or vary these terms and conditions without prior notice, including but not limited to canceling, extending, terminating or suspending this activity, the eligibility terms and criteria, the selection and number of winners, and the timing of any act to be done, and all participants shall be bound by these amendments.Binance reserves the right of final interpretation of this activity.Where any discrepancy arises between the translated versions of this announcement and the original English version, the English version of this announcement shall prevail.Additional promotion terms and conditions can be accessed [here](https://www.binance.com/en/pp-terms).
Participate in #EarnFreeCrypto2024 and win up to 500 FDUSD!
Dive into our #EarnFreeCrypto2024 campaign to seize a chance to win up to 500 FDUSD! 💰 Post an informative article on Binance Square, outlining your top 6 strategies for earning free cryptocurrency in 2024. Dive into techniques like airdrops, particularly highlighting Binance's Megadrop, tools like Binance Earn, Binance Learn and Earn, Binance Launchpool, Write2Earn on Binance Square, enticing referral programmes, and dynamic social media giveaways.
Campaign Period: 2024-05-24 00:00 to 2024-05-29 23:59 (UTC)
To Participate:
Craft an in-depth article on Binance Square, where you present your top strategies to earn free cryptocurrency. Deliver comprehensive insights into each method, elaborating on how users can actively participate. Your article can feature Binance’s products or campaigns, such as:
Binance MegadropBinance Earn Binance LaunchpoolBinance Learn and EarnWrite2Earn on Binance Square.
Make sure your article has a minimum length of 600 words.
Guidelines:
Make certain your shared content is original, filled with insightful information, and based on real incidents. Posts with high engagement lacking original content may be disqualified.
Winner Selection:
Five posts generating the most interaction will each be rewarded with 100 FDUSD.
Terms and Conditions:
This campaign may not be available in your region.Submissions will be evaluated by a panel from the Binance Square team, based on topic relevance, formatting, research quality, factual sourcing, and originality. Content must also align with Campaign Rules. Only content no shorter than 600 words will qualify for the rewards.Posts that attempt to boost engagement by exploiting Red Packets and giveaways will be disqualified.The content needs to be posted on Binance Square organically to qualify for the reward.Winners of the week will be notified within 14 days via a push notification under Creator Center > Square Assistant. Entries by Media & Project partners will not be considered for this campaign.The FDUSD token voucher rewards will be distributed within 30 working days after the activity ends. Users may check their rewards via Profile > Rewards Hub. The validity period for the token voucher is set at seven days from the day of distribution. Learn how to redeem a voucher.Illegally bulk registered accounts or sub-accounts shall not be eligible to participate or receive any rewards. Binance reserves the right to disqualify any account acting against the Binance Square Community Guidelines or Terms and Conditions.Binance reserves the right at any time in its sole and absolute discretion to determine and/or amend or vary these terms and conditions without prior notice, including but not limited to canceling, extending, terminating or suspending this activity, the eligibility terms and criteria, the selection and number of winners, and the timing of any act to be done, and all participants shall be bound by these amendments.Binance reserves the right of final interpretation of this activity.Where any discrepancy arises between the translated versions of this announcement and the original English version, the English version of this announcement shall prevail.Additional promotion terms and conditions can be accessed here.
Campaign Period: 2024-05-24 00:00 to 2024-05-29 23:59 (UTC)
To Participate:
Craft an in-depth article on Binance Square, where you present your top strategies to earn free cryptocurrency. Deliver comprehensive insights into each method, elaborating on how users can actively participate. Your article can feature Binance’s products or campaigns, such as:
Binance MegadropBinance Earn Binance LaunchpoolBinance Learn and EarnWrite2Earn on Binance Square.
Make sure your article has a minimum length of 600 words.
Guidelines:
Make certain your shared content is original, filled with insightful information, and based on real incidents. Posts with high engagement lacking original content may be disqualified.
Winner Selection:
Five posts generating the most interaction will each be rewarded with 100 FDUSD.
Terms and Conditions:
This campaign may not be available in your region.Submissions will be evaluated by a panel from the Binance Square team, based on topic relevance, formatting, research quality, factual sourcing, and originality. Content must also align with Campaign Rules. Only content no shorter than 600 words will qualify for the rewards.Posts that attempt to boost engagement by exploiting Red Packets and giveaways will be disqualified.The content needs to be posted on Binance Square organically to qualify for the reward.Winners of the week will be notified within 14 days via a push notification under Creator Center > Square Assistant. Entries by Media & Project partners will not be considered for this campaign.The FDUSD token voucher rewards will be distributed within 30 working days after the activity ends. Users may check their rewards via Profile > Rewards Hub. The validity period for the token voucher is set at seven days from the day of distribution. Learn how to redeem a voucher.Illegally bulk registered accounts or sub-accounts shall not be eligible to participate or receive any rewards. Binance reserves the right to disqualify any account acting against the Binance Square Community Guidelines or Terms and Conditions.Binance reserves the right at any time in its sole and absolute discretion to determine and/or amend or vary these terms and conditions without prior notice, including but not limited to canceling, extending, terminating or suspending this activity, the eligibility terms and criteria, the selection and number of winners, and the timing of any act to be done, and all participants shall be bound by these amendments.Binance reserves the right of final interpretation of this activity.Where any discrepancy arises between the translated versions of this announcement and the original English version, the English version of this announcement shall prevail.Additional promotion terms and conditions can be accessed here.
605
394
1.8k
81.2k

Article
How to Earn $2 to $3 Daily on Binance Without Any Investment1. Binance Learn & Earn (Educational Rewards)
Binance regularly launches Learn & Earn campaigns aimed at educating users on new blockchain projects.
How it works: You watch brief educational videos or read short articles, then complete a quick quiz testing your understanding.
Earning Potential: Correct quiz responses reward you with free cryptocurrency deposited directly into your spot or reward center wallet (typically $1 to $3 per campaign).
Pro Tip: New campaigns operate on a first-come, first-served basis. Turn on notifications for the Binance Academy/Campaign center so you can complete quizzes the moment they go live.
2. Binance Megadrop & Airdrop Portals
Binance regularly coordinates with emerging Web3 projects to distribute free tokens via official Airdrop portals and Megadrop initiatives.
How it works: Participate in simple Web3 quests (such as connecting a Binance Web3 Wallet, swapping a micro-amount, or following social handles).
Earning Potential: Free token allocations can vary, but selling newly listed airdropped tokens upon listing often yields $5 to $20+ per event. When averaged over a month, this adds $0.50 to $1.50 per day.
3. Affiliate & Referral Commissions
If you want to build a truly sustainable daily income stream with zero capital, the Binance Referral Program is one of the most effective tools.
How it works: Share your custom referral link across social media platforms, blogs, or messaging channels. When users sign up and trade, you earn a percentage of their trading fees as passive commission.
Earning Potential: Inviting just 3 to 5 active traders can easily generate a continuous $2 to $5 daily in passive spot assets or USDT.
4. Binance Square Creator Rewards & Campaign Tasks
Binance Square (Binance's social platform) actively incentivizes creators and community members for engagement and content creation.
How it works:
Participate in "Write2Earn" campaigns by sharing market analysis, trade breakdowns, or crypto updates.
Complete routine activity tasks in the Task Center / Reward Center (such as participating in official voting events or prediction challenges).
Earning Potential: Top content contributions and promotional task completions regularly reward users with token vouchers, trading fee rebate vouchers, or distribution pools.
5. Compounding via Binance Simple Earn (Flexible Savings)
Once you earn your first few dollars from Learn & Earn, Airdrops, or tasks, do not leave the funds idle.
How it works: Transfer your earned zero-cost crypto into Binance Simple Earn (Flexible Products).
Earning Potential: Your balance earns daily compounded interest (APY). While the daily yield on a small balance is modest initially, reinvesting 100% of your free promotional rewards gradually accelerates your passive daily earnings over time.
$USDC
#freesignal #Write2Earn #EarnFreeCrypto2024
How to Earn $2 to $3 Daily on Binance Without Any Investment
1. Binance Learn & Earn (Educational Rewards)
Binance regularly launches Learn & Earn campaigns aimed at educating users on new blockchain projects.
How it works: You watch brief educational videos or read short articles, then complete a quick quiz testing your understanding.
Earning Potential: Correct quiz responses reward you with free cryptocurrency deposited directly into your spot or reward center wallet (typically $1 to $3 per campaign).
Pro Tip: New campaigns operate on a first-come, first-served basis. Turn on notifications for the Binance Academy/Campaign center so you can complete quizzes the moment they go live.
2. Binance Megadrop & Airdrop Portals
Binance regularly coordinates with emerging Web3 projects to distribute free tokens via official Airdrop portals and Megadrop initiatives.
How it works: Participate in simple Web3 quests (such as connecting a Binance Web3 Wallet, swapping a micro-amount, or following social handles).
Earning Potential: Free token allocations can vary, but selling newly listed airdropped tokens upon listing often yields $5 to $20+ per event. When averaged over a month, this adds $0.50 to $1.50 per day.
3. Affiliate & Referral Commissions
If you want to build a truly sustainable daily income stream with zero capital, the Binance Referral Program is one of the most effective tools.
How it works: Share your custom referral link across social media platforms, blogs, or messaging channels. When users sign up and trade, you earn a percentage of their trading fees as passive commission.
Earning Potential: Inviting just 3 to 5 active traders can easily generate a continuous $2 to $5 daily in passive spot assets or USDT.
4. Binance Square Creator Rewards & Campaign Tasks
Binance Square (Binance's social platform) actively incentivizes creators and community members for engagement and content creation.
How it works:
Participate in "Write2Earn" campaigns by sharing market analysis, trade breakdowns, or crypto updates.
Complete routine activity tasks in the Task Center / Reward Center (such as participating in official voting events or prediction challenges).
Earning Potential: Top content contributions and promotional task completions regularly reward users with token vouchers, trading fee rebate vouchers, or distribution pools.
5. Compounding via Binance Simple Earn (Flexible Savings)
Once you earn your first few dollars from Learn & Earn, Airdrops, or tasks, do not leave the funds idle.
How it works: Transfer your earned zero-cost crypto into Binance Simple Earn (Flexible Products).
Earning Potential: Your balance earns daily compounded interest (APY). While the daily yield on a small balance is modest initially, reinvesting 100% of your free promotional rewards gradually accelerates your passive daily earnings over time.
$USDC
#freesignal #Write2Earn #EarnFreeCrypto2024
Binance regularly launches Learn & Earn campaigns aimed at educating users on new blockchain projects.
How it works: You watch brief educational videos or read short articles, then complete a quick quiz testing your understanding.
Earning Potential: Correct quiz responses reward you with free cryptocurrency deposited directly into your spot or reward center wallet (typically $1 to $3 per campaign).
Pro Tip: New campaigns operate on a first-come, first-served basis. Turn on notifications for the Binance Academy/Campaign center so you can complete quizzes the moment they go live.
2. Binance Megadrop & Airdrop Portals
Binance regularly coordinates with emerging Web3 projects to distribute free tokens via official Airdrop portals and Megadrop initiatives.
How it works: Participate in simple Web3 quests (such as connecting a Binance Web3 Wallet, swapping a micro-amount, or following social handles).
Earning Potential: Free token allocations can vary, but selling newly listed airdropped tokens upon listing often yields $5 to $20+ per event. When averaged over a month, this adds $0.50 to $1.50 per day.
3. Affiliate & Referral Commissions
If you want to build a truly sustainable daily income stream with zero capital, the Binance Referral Program is one of the most effective tools.
How it works: Share your custom referral link across social media platforms, blogs, or messaging channels. When users sign up and trade, you earn a percentage of their trading fees as passive commission.
Earning Potential: Inviting just 3 to 5 active traders can easily generate a continuous $2 to $5 daily in passive spot assets or USDT.
4. Binance Square Creator Rewards & Campaign Tasks
Binance Square (Binance's social platform) actively incentivizes creators and community members for engagement and content creation.
How it works:
Participate in "Write2Earn" campaigns by sharing market analysis, trade breakdowns, or crypto updates.
Complete routine activity tasks in the Task Center / Reward Center (such as participating in official voting events or prediction challenges).
Earning Potential: Top content contributions and promotional task completions regularly reward users with token vouchers, trading fee rebate vouchers, or distribution pools.
5. Compounding via Binance Simple Earn (Flexible Savings)
Once you earn your first few dollars from Learn & Earn, Airdrops, or tasks, do not leave the funds idle.
How it works: Transfer your earned zero-cost crypto into Binance Simple Earn (Flexible Products).
Earning Potential: Your balance earns daily compounded interest (APY). While the daily yield on a small balance is modest initially, reinvesting 100% of your free promotional rewards gradually accelerates your passive daily earnings over time.
$USDC
#freesignal #Write2Earn #EarnFreeCrypto2024
3
198
Article
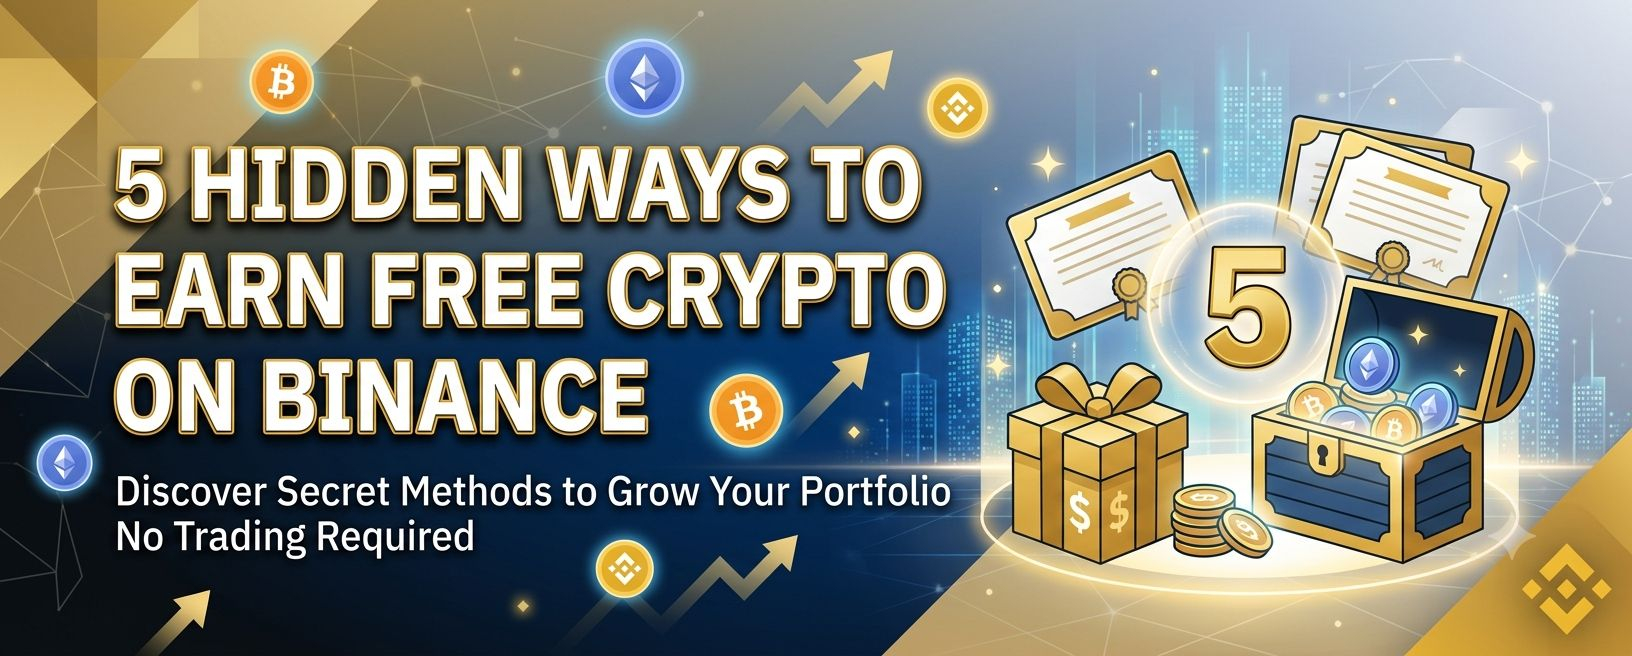
5 Hidden ways to earn free crypto on binance 🎁1. Binance Learn & Earn
How it works: Binance Academy regularly runs promotional educational campaigns. You read short educational modules or watch 1–2 minute videos, then complete a brief quiz at the end.
Payout: Successful quizzes instantly deposit free crypto (such as SUI, NEAR, BNB, or stablecoins) directly into your Rewards Hub/Spot wallet.
* Pro Tip: Rewards are distributed on a first-come, first-served basis, so check the "Learn & Earn" tab immediately after platform announcements.
2. Launchpool Farming
How it works: When new projects list on Binance, the exchange allows users to farm the new token prior to spot trading launch.
Payout: Stake idle BNB or FDUSD in the Launchpool tab to earn daily distributions of the new token for free.
Pro Tip: Staking can be unstaked at any point with zero lockup penalty, making it a risk-free way to collect new launch tokens while preserving principal capital.
3. Simple Earn Auto-Subscribe
How it works: Rather than leaving idle USDT, BNB, or spot altcoins sitting unutilized in a spot wallet, Binance Simple Earn yields daily interest on flexible terms.
Payout: Turning on Auto-Subscribe automatically sweeps uninvested spot balances into flexible yield pools every 24 hours without manual intervention.
Pro Tip: New token listings often launch temporary promotional APRs (ranging from 10% to 50%+) on Simple Earn prior to or right after going live.
4. Binance Rewards Hub & Task Center
How it works: Located inside the user profile dashboard, the Rewards Hub assigns micro-tasks to active users.
Payout: Tasks range from trying a specific feature (e.g., executing a P2P order or setting up an Auto-Invest plan) to participating in voting events or platform campaigns. Rewards include cash vouchers, trading fee rebate coupons, or direct token distribution.
Pro Tip: Check the "Voucher Center" routinely; unclaimed vouchers expire after a set duration.
5. Web3 Wallet Quests & Airdrop Zone
How it works: Integrated directly within the main Binance app, the native Web3 Wallet features interactive quests in collaboration with emerging decentralized protocols.
Payout: Completing basic on-chain tasks—such as bridging a small balance, swapping tokens, or testing a decentralized application (dApp)—qualifies users for exclusive token airdrops.
Pro Tip: Web3 Airdrop campaigns often distribute thousands of dollars worth of project tokens to early participants with minimal
gas fee requirements.
$HEI $CTSI $SKYAI
#FreeEarnings #Crypto_Jobs🎯 #Write2Earn #EarnFreeCrypto2024
5 Hidden ways to earn free crypto on binance 🎁
1. Binance Learn & Earn
How it works: Binance Academy regularly runs promotional educational campaigns. You read short educational modules or watch 1–2 minute videos, then complete a brief quiz at the end.
Payout: Successful quizzes instantly deposit free crypto (such as SUI, NEAR, BNB, or stablecoins) directly into your Rewards Hub/Spot wallet.
* Pro Tip: Rewards are distributed on a first-come, first-served basis, so check the "Learn & Earn" tab immediately after platform announcements.
2. Launchpool Farming
How it works: When new projects list on Binance, the exchange allows users to farm the new token prior to spot trading launch.
Payout: Stake idle BNB or FDUSD in the Launchpool tab to earn daily distributions of the new token for free.
Pro Tip: Staking can be unstaked at any point with zero lockup penalty, making it a risk-free way to collect new launch tokens while preserving principal capital.
3. Simple Earn Auto-Subscribe
How it works: Rather than leaving idle USDT, BNB, or spot altcoins sitting unutilized in a spot wallet, Binance Simple Earn yields daily interest on flexible terms.
Payout: Turning on Auto-Subscribe automatically sweeps uninvested spot balances into flexible yield pools every 24 hours without manual intervention.
Pro Tip: New token listings often launch temporary promotional APRs (ranging from 10% to 50%+) on Simple Earn prior to or right after going live.
4. Binance Rewards Hub & Task Center
How it works: Located inside the user profile dashboard, the Rewards Hub assigns micro-tasks to active users.
Payout: Tasks range from trying a specific feature (e.g., executing a P2P order or setting up an Auto-Invest plan) to participating in voting events or platform campaigns. Rewards include cash vouchers, trading fee rebate coupons, or direct token distribution.
Pro Tip: Check the "Voucher Center" routinely; unclaimed vouchers expire after a set duration.
5. Web3 Wallet Quests & Airdrop Zone
How it works: Integrated directly within the main Binance app, the native Web3 Wallet features interactive quests in collaboration with emerging decentralized protocols.
Payout: Completing basic on-chain tasks—such as bridging a small balance, swapping tokens, or testing a decentralized application (dApp)—qualifies users for exclusive token airdrops.
Pro Tip: Web3 Airdrop campaigns often distribute thousands of dollars worth of project tokens to early participants with minimal
gas fee requirements.
$HEI $CTSI $SKYAI
#FreeEarnings #Crypto_Jobs🎯 #Write2Earn #EarnFreeCrypto2024
How it works: Binance Academy regularly runs promotional educational campaigns. You read short educational modules or watch 1–2 minute videos, then complete a brief quiz at the end.
Payout: Successful quizzes instantly deposit free crypto (such as SUI, NEAR, BNB, or stablecoins) directly into your Rewards Hub/Spot wallet.
* Pro Tip: Rewards are distributed on a first-come, first-served basis, so check the "Learn & Earn" tab immediately after platform announcements.
2. Launchpool Farming
How it works: When new projects list on Binance, the exchange allows users to farm the new token prior to spot trading launch.
Payout: Stake idle BNB or FDUSD in the Launchpool tab to earn daily distributions of the new token for free.
Pro Tip: Staking can be unstaked at any point with zero lockup penalty, making it a risk-free way to collect new launch tokens while preserving principal capital.
3. Simple Earn Auto-Subscribe
How it works: Rather than leaving idle USDT, BNB, or spot altcoins sitting unutilized in a spot wallet, Binance Simple Earn yields daily interest on flexible terms.
Payout: Turning on Auto-Subscribe automatically sweeps uninvested spot balances into flexible yield pools every 24 hours without manual intervention.
Pro Tip: New token listings often launch temporary promotional APRs (ranging from 10% to 50%+) on Simple Earn prior to or right after going live.
4. Binance Rewards Hub & Task Center
How it works: Located inside the user profile dashboard, the Rewards Hub assigns micro-tasks to active users.
Payout: Tasks range from trying a specific feature (e.g., executing a P2P order or setting up an Auto-Invest plan) to participating in voting events or platform campaigns. Rewards include cash vouchers, trading fee rebate coupons, or direct token distribution.
Pro Tip: Check the "Voucher Center" routinely; unclaimed vouchers expire after a set duration.
5. Web3 Wallet Quests & Airdrop Zone
How it works: Integrated directly within the main Binance app, the native Web3 Wallet features interactive quests in collaboration with emerging decentralized protocols.
Payout: Completing basic on-chain tasks—such as bridging a small balance, swapping tokens, or testing a decentralized application (dApp)—qualifies users for exclusive token airdrops.
Pro Tip: Web3 Airdrop campaigns often distribute thousands of dollars worth of project tokens to early participants with minimal
gas fee requirements.
$HEI $CTSI $SKYAI
#FreeEarnings #Crypto_Jobs🎯 #Write2Earn #EarnFreeCrypto2024
450

·
--
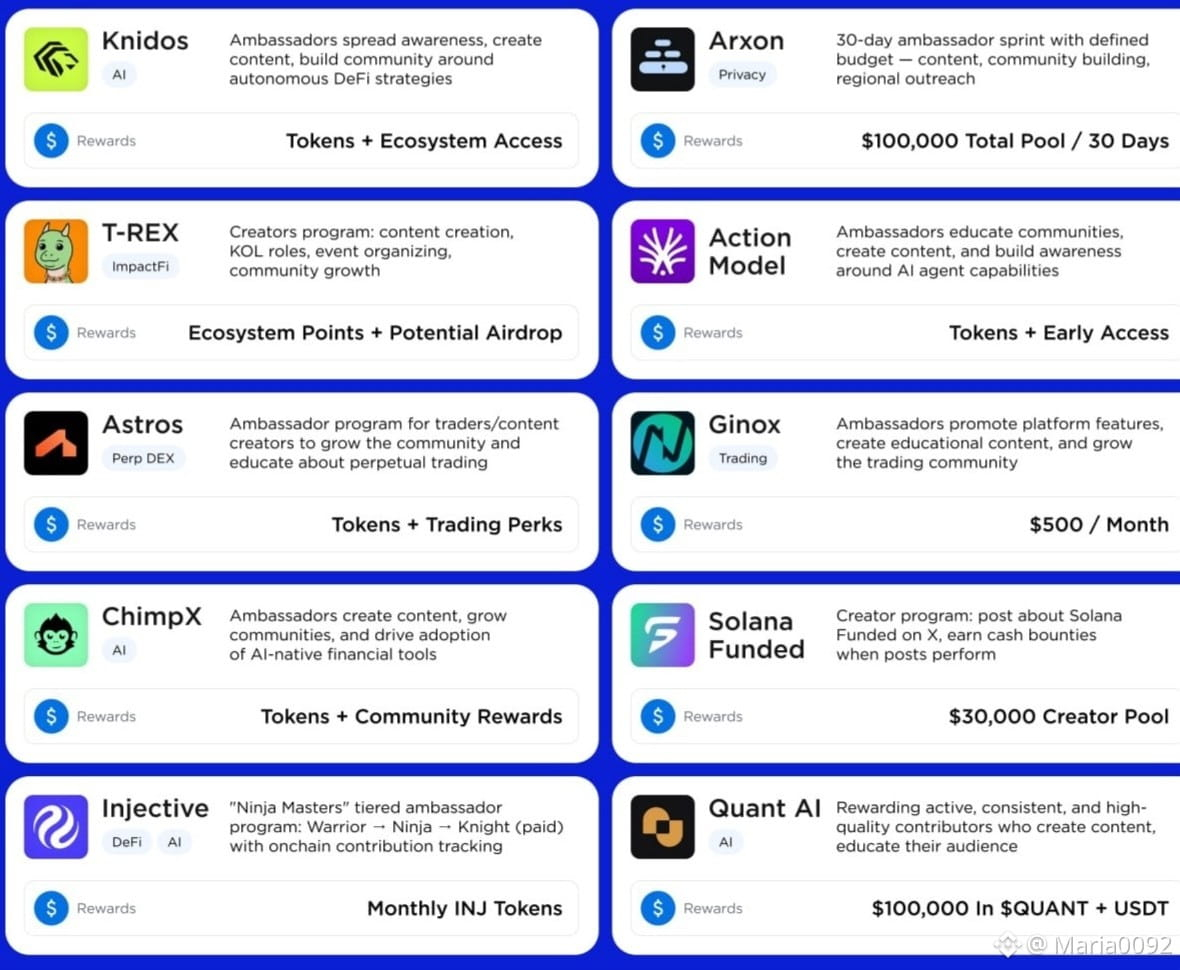
10 Ambassador Programs in June
Ambassador and creator programs are one of the lowest-effort ways to farm crypto right now - no capital needed, just content and community.
Here are 10 live this month, by reward:
• Knidos - Tokens + Ecosystem Access
• Arxon - $100,000 pool / 30 days
• T-REX - Ecosystem Points + Potential Airdrop
• Action Model - Tokens + Early Access
• Astros - Tokens + Trading Perks
• Ginox - $500/month
• ChimpX - Tokens + Community Rewards
• Solana Funded - $30,000 creator pool
• Injective - Monthly INJ tokens
• Quant AI - $100,000 in $QUANT + USDT
#AmbassadorCampaign #AmbassadorProgram #EarnFreeCrypto2024
10 Ambassador Programs in June
Ambassador and creator programs are one of the lowest-effort ways to farm crypto right now - no capital needed, just content and community.
Here are 10 live this month, by reward:
• Knidos - Tokens + Ecosystem Access
• Arxon - $100,000 pool / 30 days
• T-REX - Ecosystem Points + Potential Airdrop
• Action Model - Tokens + Early Access
• Astros - Tokens + Trading Perks
• Ginox - $500/month
• ChimpX - Tokens + Community Rewards
• Solana Funded - $30,000 creator pool
• Injective - Monthly INJ tokens
• Quant AI - $100,000 in $QUANT + USDT
#AmbassadorCampaign #AmbassadorProgram #EarnFreeCrypto2024
Ambassador and creator programs are one of the lowest-effort ways to farm crypto right now - no capital needed, just content and community.
Here are 10 live this month, by reward:
• Knidos - Tokens + Ecosystem Access
• Arxon - $100,000 pool / 30 days
• T-REX - Ecosystem Points + Potential Airdrop
• Action Model - Tokens + Early Access
• Astros - Tokens + Trading Perks
• Ginox - $500/month
• ChimpX - Tokens + Community Rewards
• Solana Funded - $30,000 creator pool
• Injective - Monthly INJ tokens
• Quant AI - $100,000 in $QUANT + USDT
#AmbassadorCampaign #AmbassadorProgram #EarnFreeCrypto2024
1
338
Article
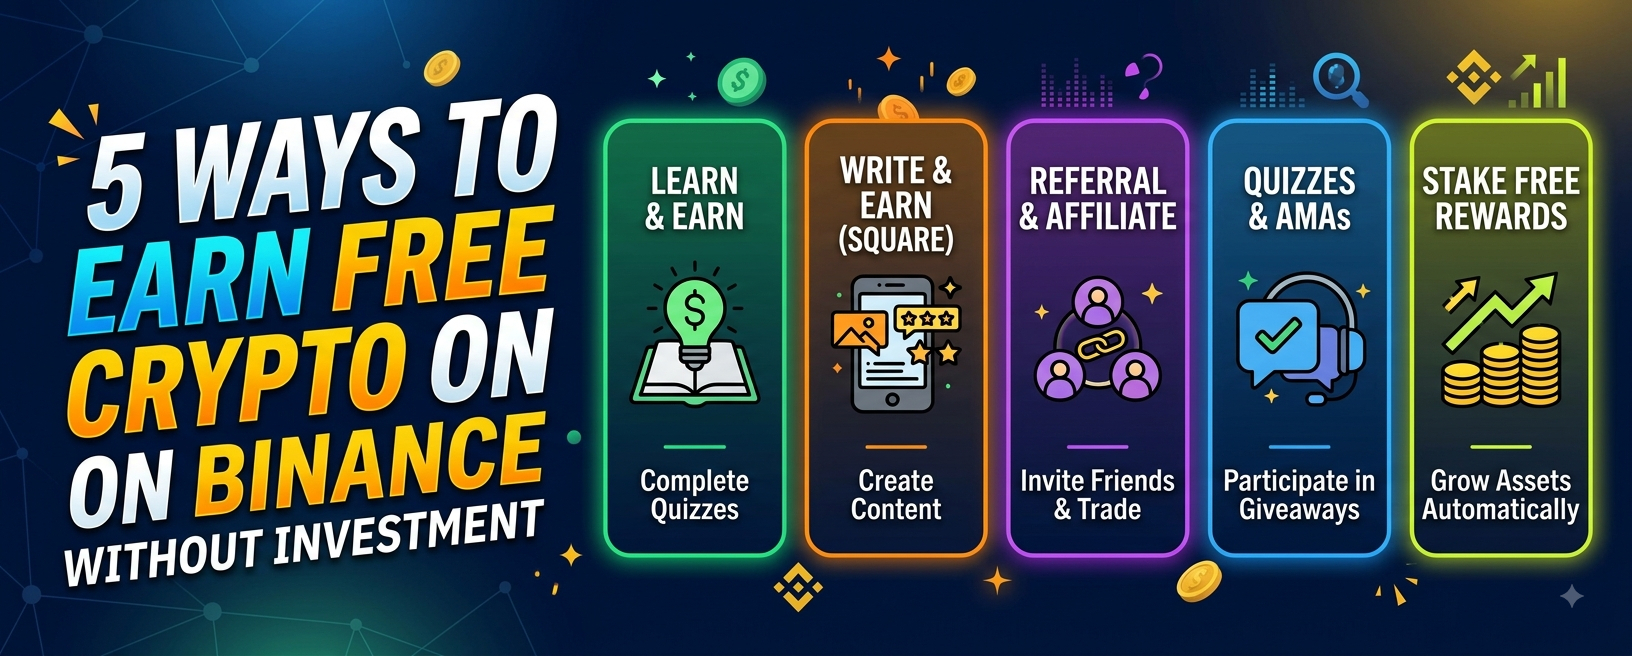
5 way to earn free money on bianance without investment💸1. Binance Learn & Earn
One of the most straightforward ways to earn free crypto is by educating yourself. Binance regularly partners with new blockchain projects to host short courses.
How it works: Watch brief educational videos, read short articles, and complete a quick quiz.
Payout: Successful completion deposits tokens directly into your Rewards Hub or spot wallet.
2. Binance Square Content Creation (Write2Earn)
If you enjoy writing market updates, technical analysis, or educational posts, Binance Square allows you to monetize your activity.
How it works: Post original analysis, news summaries, or trading insights using active campaign hashtags.
Payout: Creators earn token vouchers and creator pool rewards based on engagement, content quality, and trading fees generated by readers through their posts.
3. Referral & Affiliate Program
You can monetize your network by inviting friends and traders to the platform.
How it works: Share your unique referral link or code across social channels, messaging groups, or blogs.
Payout: Every time a user who signed up under your link executes a spot or futures trade, you receive a percentage commission of their trading fee.
4. Community Quizzes, AMAs & Giveaways
Binance regularly hosts interactive events across Binance Square, Telegram, and X (formerly Twitter).
How it works: Join live Ask-Me-Anything (AMA) sessions, complete social media tasks, or participate in platform prediction contests.
Payout: Rewards range from $5 to $50+ in trial funds, token vouchers, or USDT drops for active participants.
5. Put Free Earnings into Binance Simple Earn
Once you earn free tokens from quizzes, giveaways, or creator tasks, you can make those assets grow passively without buying more.
How it works: Transfer your free rewards into Simple Earn (Flexible Products).
Payout: You earn daily APR yields on your free balance, compounding your earnings over time risk-free.
$VELVET
#Write2Earn #EarnFreeCrypto2024 #PassiveIncome
5 way to earn free money on bianance without investment💸
1. Binance Learn & Earn
One of the most straightforward ways to earn free crypto is by educating yourself. Binance regularly partners with new blockchain projects to host short courses.
How it works: Watch brief educational videos, read short articles, and complete a quick quiz.
Payout: Successful completion deposits tokens directly into your Rewards Hub or spot wallet.
2. Binance Square Content Creation (Write2Earn)
If you enjoy writing market updates, technical analysis, or educational posts, Binance Square allows you to monetize your activity.
How it works: Post original analysis, news summaries, or trading insights using active campaign hashtags.
Payout: Creators earn token vouchers and creator pool rewards based on engagement, content quality, and trading fees generated by readers through their posts.
3. Referral & Affiliate Program
You can monetize your network by inviting friends and traders to the platform.
How it works: Share your unique referral link or code across social channels, messaging groups, or blogs.
Payout: Every time a user who signed up under your link executes a spot or futures trade, you receive a percentage commission of their trading fee.
4. Community Quizzes, AMAs & Giveaways
Binance regularly hosts interactive events across Binance Square, Telegram, and X (formerly Twitter).
How it works: Join live Ask-Me-Anything (AMA) sessions, complete social media tasks, or participate in platform prediction contests.
Payout: Rewards range from $5 to $50+ in trial funds, token vouchers, or USDT drops for active participants.
5. Put Free Earnings into Binance Simple Earn
Once you earn free tokens from quizzes, giveaways, or creator tasks, you can make those assets grow passively without buying more.
How it works: Transfer your free rewards into Simple Earn (Flexible Products).
Payout: You earn daily APR yields on your free balance, compounding your earnings over time risk-free.
$VELVET
#Write2Earn #EarnFreeCrypto2024 #PassiveIncome
One of the most straightforward ways to earn free crypto is by educating yourself. Binance regularly partners with new blockchain projects to host short courses.
How it works: Watch brief educational videos, read short articles, and complete a quick quiz.
Payout: Successful completion deposits tokens directly into your Rewards Hub or spot wallet.
2. Binance Square Content Creation (Write2Earn)
If you enjoy writing market updates, technical analysis, or educational posts, Binance Square allows you to monetize your activity.
How it works: Post original analysis, news summaries, or trading insights using active campaign hashtags.
Payout: Creators earn token vouchers and creator pool rewards based on engagement, content quality, and trading fees generated by readers through their posts.
3. Referral & Affiliate Program
You can monetize your network by inviting friends and traders to the platform.
How it works: Share your unique referral link or code across social channels, messaging groups, or blogs.
Payout: Every time a user who signed up under your link executes a spot or futures trade, you receive a percentage commission of their trading fee.
4. Community Quizzes, AMAs & Giveaways
Binance regularly hosts interactive events across Binance Square, Telegram, and X (formerly Twitter).
How it works: Join live Ask-Me-Anything (AMA) sessions, complete social media tasks, or participate in platform prediction contests.
Payout: Rewards range from $5 to $50+ in trial funds, token vouchers, or USDT drops for active participants.
5. Put Free Earnings into Binance Simple Earn
Once you earn free tokens from quizzes, giveaways, or creator tasks, you can make those assets grow passively without buying more.
How it works: Transfer your free rewards into Simple Earn (Flexible Products).
Payout: You earn daily APR yields on your free balance, compounding your earnings over time risk-free.
$VELVET
#Write2Earn #EarnFreeCrypto2024 #PassiveIncome
175

·
--
¡Participe en#EarnFreeCrypto2024y gane hasta 500 FDUSD!
¡Sumérgete en nuestra campaña #EarnFreeCrypto2024 para aprovechar la oportunidad de ganar hasta 500 FDUSD! 💰 Publique un artículo informativo en Binance Square, que describa sus 6 estrategias principales para ganar criptomonedas gratis en 2024. Sumérjase en técnicas como airdrops, destacando particularmente Megadrop de Binance, herramientas como Binance Earn, Binance Learn and Earn, Binance Launchpool, Write2Earn en Binance Square, atractivos programas de referencia y obsequios dinámicos en las redes sociales.
Período de campaña: 2024-05-24 00:00 a 2024-05-29 23:59 (UTC) #EarnFreeCrypto2024
¡Participe en#EarnFreeCrypto2024y gane hasta 500 FDUSD!
¡Sumérgete en nuestra campaña #EarnFreeCrypto2024 para aprovechar la oportunidad de ganar hasta 500 FDUSD! 💰 Publique un artículo informativo en Binance Square, que describa sus 6 estrategias principales para ganar criptomonedas gratis en 2024. Sumérjase en técnicas como airdrops, destacando particularmente Megadrop de Binance, herramientas como Binance Earn, Binance Learn and Earn, Binance Launchpool, Write2Earn en Binance Square, atractivos programas de referencia y obsequios dinámicos en las redes sociales.
Período de campaña: 2024-05-24 00:00 a 2024-05-29 23:59 (UTC) #EarnFreeCrypto2024
¡Sumérgete en nuestra campaña #EarnFreeCrypto2024 para aprovechar la oportunidad de ganar hasta 500 FDUSD! 💰 Publique un artículo informativo en Binance Square, que describa sus 6 estrategias principales para ganar criptomonedas gratis en 2024. Sumérjase en técnicas como airdrops, destacando particularmente Megadrop de Binance, herramientas como Binance Earn, Binance Learn and Earn, Binance Launchpool, Write2Earn en Binance Square, atractivos programas de referencia y obsequios dinámicos en las redes sociales.
Período de campaña: 2024-05-24 00:00 a 2024-05-29 23:59 (UTC) #EarnFreeCrypto2024
1
326
Article
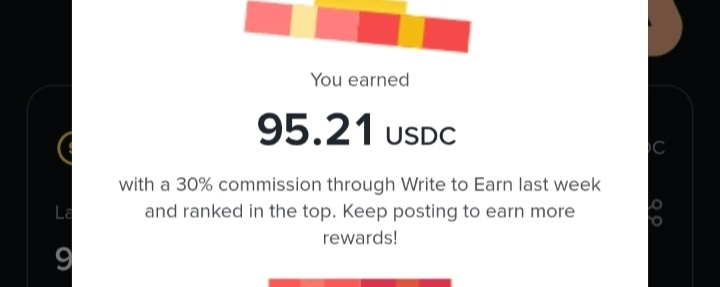
How to Earn $4 to $8 dollar Every day on binance without any investment 💰1. Binance Square "Write to Earn"
If you can write simple market updates or share trading insights, Binance Square is one of the fastest ways to earn without cash. Through the Write to Earn program, Binance rewards creators with crypto or trading fee rebate vouchers based on how much engagement (likes, clicks, and comments) your posts get.
How to do it: Post short technical analysis updates, coin recaps, or participate in official trending hashtag campaigns where Binance gives out direct prize pools to active creators.
2. Binance Academy "Learn & Earn"
Binance regularly runs Learn & Earn campaigns to introduce users to new blockchain projects.
How to do it: You open the Academy tab, watch a quick educational video or read a short article about a project, and then take a brief quiz. If you get the answers right, free crypto tokens are dropped directly into your wallet. These reward pools go fast, so check your notifications daily.
3. Web3 Wallet Quests & Megadrop
In the Web3 Wallet section of the Binance app, many new crypto projects partner with Binance to gain exposure before or during their official launch.
How to do it: Look for free airdrop tasks or Binance Megadrop integration events. These often reward you for finishing simple, non-monetary tasks (like following a project on social media or interacting with a zero-fee test network). When the project lists, you can sell your airdropped tokens for immediate profit.
4. Affiliate & Referral Programs
If you have a social media page, a blog, or an active private community group, you can turn your network into daily cash.
Lite Referrals: Invite friends to complete basic, non-monetary identity checks to unlock reward mystery boxes and token vouchers.
Binance Affiliate: If you build up your audience, you can apply to become an official affiliate. This lets you earn up to a 40-50% commission on the trading fees of everyone who joins through your link, creating a steady stream of passive daily income.
$PIPPIN
#freesignal #Write2Earn #EarnFreeCrypto2024
How to Earn $4 to $8 dollar Every day on binance without any investment 💰
1. Binance Square "Write to Earn"
If you can write simple market updates or share trading insights, Binance Square is one of the fastest ways to earn without cash. Through the Write to Earn program, Binance rewards creators with crypto or trading fee rebate vouchers based on how much engagement (likes, clicks, and comments) your posts get.
How to do it: Post short technical analysis updates, coin recaps, or participate in official trending hashtag campaigns where Binance gives out direct prize pools to active creators.
2. Binance Academy "Learn & Earn"
Binance regularly runs Learn & Earn campaigns to introduce users to new blockchain projects.
How to do it: You open the Academy tab, watch a quick educational video or read a short article about a project, and then take a brief quiz. If you get the answers right, free crypto tokens are dropped directly into your wallet. These reward pools go fast, so check your notifications daily.
3. Web3 Wallet Quests & Megadrop
In the Web3 Wallet section of the Binance app, many new crypto projects partner with Binance to gain exposure before or during their official launch.
How to do it: Look for free airdrop tasks or Binance Megadrop integration events. These often reward you for finishing simple, non-monetary tasks (like following a project on social media or interacting with a zero-fee test network). When the project lists, you can sell your airdropped tokens for immediate profit.
4. Affiliate & Referral Programs
If you have a social media page, a blog, or an active private community group, you can turn your network into daily cash.
Lite Referrals: Invite friends to complete basic, non-monetary identity checks to unlock reward mystery boxes and token vouchers.
Binance Affiliate: If you build up your audience, you can apply to become an official affiliate. This lets you earn up to a 40-50% commission on the trading fees of everyone who joins through your link, creating a steady stream of passive daily income.
$PIPPIN
#freesignal #Write2Earn #EarnFreeCrypto2024
If you can write simple market updates or share trading insights, Binance Square is one of the fastest ways to earn without cash. Through the Write to Earn program, Binance rewards creators with crypto or trading fee rebate vouchers based on how much engagement (likes, clicks, and comments) your posts get.
How to do it: Post short technical analysis updates, coin recaps, or participate in official trending hashtag campaigns where Binance gives out direct prize pools to active creators.
2. Binance Academy "Learn & Earn"
Binance regularly runs Learn & Earn campaigns to introduce users to new blockchain projects.
How to do it: You open the Academy tab, watch a quick educational video or read a short article about a project, and then take a brief quiz. If you get the answers right, free crypto tokens are dropped directly into your wallet. These reward pools go fast, so check your notifications daily.
3. Web3 Wallet Quests & Megadrop
In the Web3 Wallet section of the Binance app, many new crypto projects partner with Binance to gain exposure before or during their official launch.
How to do it: Look for free airdrop tasks or Binance Megadrop integration events. These often reward you for finishing simple, non-monetary tasks (like following a project on social media or interacting with a zero-fee test network). When the project lists, you can sell your airdropped tokens for immediate profit.
4. Affiliate & Referral Programs
If you have a social media page, a blog, or an active private community group, you can turn your network into daily cash.
Lite Referrals: Invite friends to complete basic, non-monetary identity checks to unlock reward mystery boxes and token vouchers.
Binance Affiliate: If you build up your audience, you can apply to become an official affiliate. This lets you earn up to a 40-50% commission on the trading fees of everyone who joins through your link, creating a steady stream of passive daily income.
$PIPPIN
#freesignal #Write2Earn #EarnFreeCrypto2024
7
399
#EarnFreeCrypto2024 earn money without any investment
#EarnFreeCrypto2024 earn money without any investment

76

·
--
رحلة الوصول إلي الف دولار بدون استثمار من خلال الكتابة فقط على بايننس #EarnFreeCrypto2024
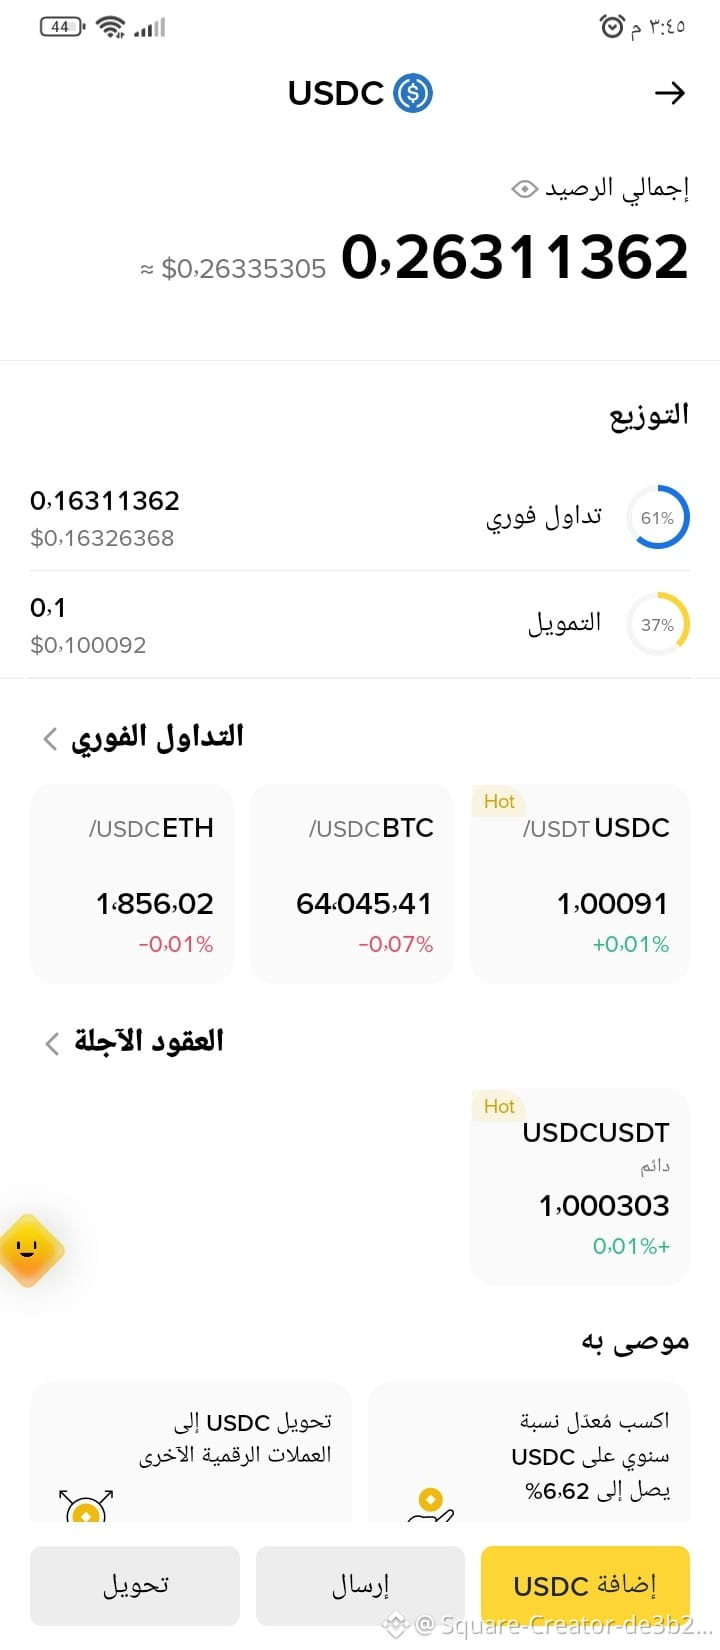
رحلة الوصول إلي الف دولار بدون استثمار من خلال الكتابة فقط على بايننس #EarnFreeCrypto2024
1
70

·
--
#BinancePickAndWin is offering you a chance to win free $BNB $SXT and $C just by guessing on simple football related questions. No investment needed! Yes! So don't waste your time and join now! #EarnFreeCrypto2024
[Join now!](https://www.binance.com/activity/pick-and-win/2026-football-challenge?ref=SLYTERINKLEA)
#BinancePickAndWin is offering you a chance to win free $BNB $SXT and $C just by guessing on simple football related questions. No investment needed! Yes! So don't waste your time and join now! #EarnFreeCrypto2024
Join now!
Join now!
1
199
·
--
🎉 Binance Turns 9! $7,000 USDC Up for Grabs 🎂🎈
The News:
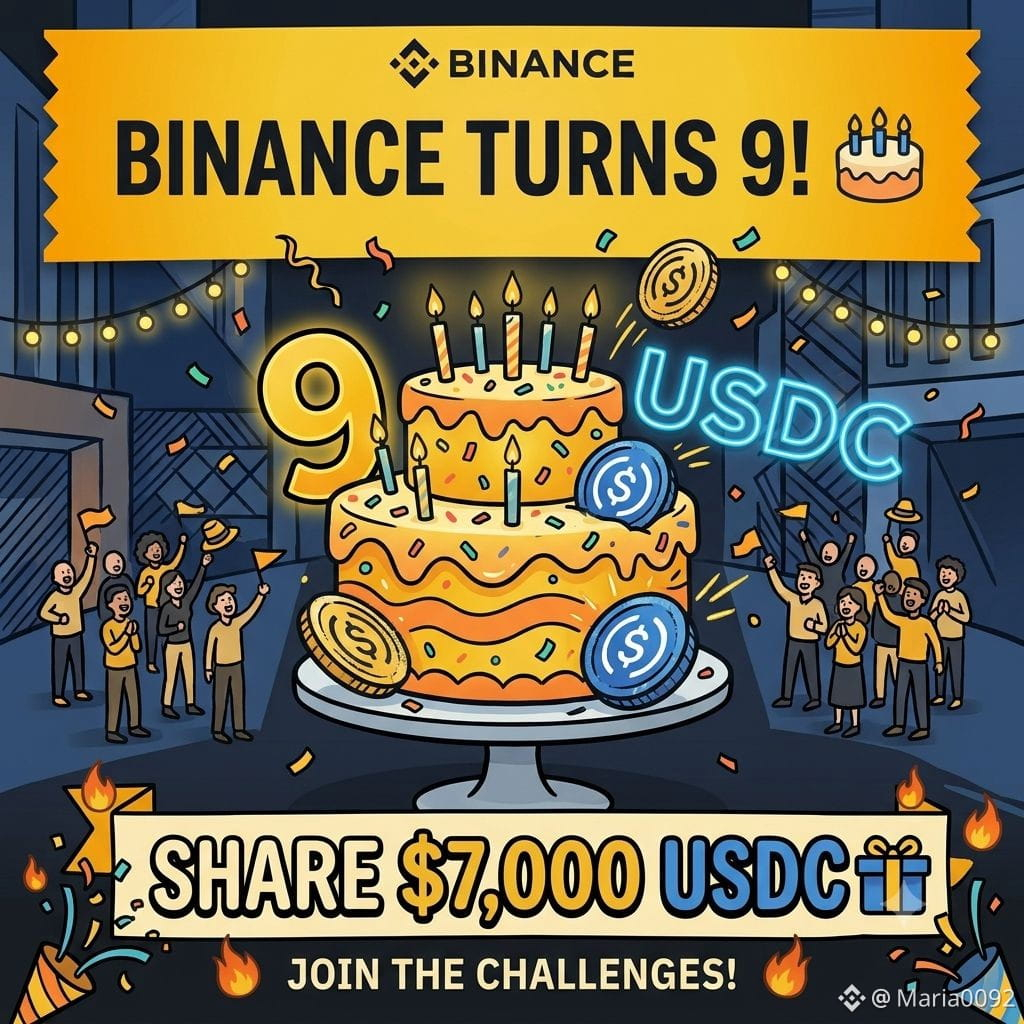
It's official—Binance is celebrating its 9th Anniversary! To mark the occasion, a new series of community challenges is live where you can share in 7,000 USDC rewards.
💡 Opportunity:
Look for the "Anniversary Challenges" in your tasks center.Rewards are often distributed on a first-come, first-served basis. Speed matters.
👇 What year did you join Binance?
Drop the date!
Follow for Updates
#BinanceTurns9 #CryptoNews #EarnFreeCrypto2024 #Binance $USDC
{spot}(USDCUSDT)
🎉 Binance Turns 9! $7,000 USDC Up for Grabs 🎂🎈
The News:
It's official—Binance is celebrating its 9th Anniversary! To mark the occasion, a new series of community challenges is live where you can share in 7,000 USDC rewards.
💡 Opportunity:
Look for the "Anniversary Challenges" in your tasks center.Rewards are often distributed on a first-come, first-served basis. Speed matters.
👇 What year did you join Binance?
Drop the date!
Follow for Updates
#BinanceTurns9 #CryptoNews #EarnFreeCrypto2024 #Binance $USDC
The News:
It's official—Binance is celebrating its 9th Anniversary! To mark the occasion, a new series of community challenges is live where you can share in 7,000 USDC rewards.
💡 Opportunity:
Look for the "Anniversary Challenges" in your tasks center.Rewards are often distributed on a first-come, first-served basis. Speed matters.
👇 What year did you join Binance?
Drop the date!
Follow for Updates
#BinanceTurns9 #CryptoNews #EarnFreeCrypto2024 #Binance $USDC
1
141
·
--
💬 سؤال للنقاش: هل تعتقدون أن الإغلاق الأسبوعي سيكون إيجابياً أم سنرى تصحيحاً؟ شاركوني توقعاتكم!
2. نموذج ميزات Binance (Feature Spotlight) 🚀
العنوان: كيف تجعل أموالك تعمل بدلاً منك؟ 💤💼
المحتوى:
إذا كنت تحتفظ بعملاتك في المحفظة الفورية (Spot) دون استثمارها، فأنت تفوت فرصة ممتازة!
الميزة: Binance Earn (الكسب المرن).
لماذا تستخدمها؟ تتيح لك إيداع عملاتك الرقمية والحصول على عائد يومي (APR) مع ميزة سحب أموالك في أي وقت تريده دون شروط معقدة.
الأمان: مثالية جداً للمستثمرين على المدى الطويل (HODLers) الذين يرغبون في زيادة عدد عملاتهم بأمان.
💡 خطوة سريعة: ابحث عن قسم "Earn" في التطبيق واكتشف العملات المدعومة اليوم!
#BinanceTurns9 #EarnFreeCrypto2024
💬 سؤال للنقاش: هل تعتقدون أن الإغلاق الأسبوعي سيكون إيجابياً أم سنرى تصحيحاً؟ شاركوني توقعاتكم!
2. نموذج ميزات Binance (Feature Spotlight) 🚀
العنوان: كيف تجعل أموالك تعمل بدلاً منك؟ 💤💼
المحتوى:
إذا كنت تحتفظ بعملاتك في المحفظة الفورية (Spot) دون استثمارها، فأنت تفوت فرصة ممتازة!
الميزة: Binance Earn (الكسب المرن).
لماذا تستخدمها؟ تتيح لك إيداع عملاتك الرقمية والحصول على عائد يومي (APR) مع ميزة سحب أموالك في أي وقت تريده دون شروط معقدة.
الأمان: مثالية جداً للمستثمرين على المدى الطويل (HODLers) الذين يرغبون في زيادة عدد عملاتهم بأمان.
💡 خطوة سريعة: ابحث عن قسم "Earn" في التطبيق واكتشف العملات المدعومة اليوم!
#BinanceTurns9 #EarnFreeCrypto2024
2. نموذج ميزات Binance (Feature Spotlight) 🚀
العنوان: كيف تجعل أموالك تعمل بدلاً منك؟ 💤💼
المحتوى:
إذا كنت تحتفظ بعملاتك في المحفظة الفورية (Spot) دون استثمارها، فأنت تفوت فرصة ممتازة!
الميزة: Binance Earn (الكسب المرن).
لماذا تستخدمها؟ تتيح لك إيداع عملاتك الرقمية والحصول على عائد يومي (APR) مع ميزة سحب أموالك في أي وقت تريده دون شروط معقدة.
الأمان: مثالية جداً للمستثمرين على المدى الطويل (HODLers) الذين يرغبون في زيادة عدد عملاتهم بأمان.
💡 خطوة سريعة: ابحث عن قسم "Earn" في التطبيق واكتشف العملات المدعومة اليوم!
#BinanceTurns9 #EarnFreeCrypto2024
143


·
--
#EarnFreeCrypto2024 10 Programas de Embajadores en Junio
Los programas de embajadores y creadores son una de las formas más sencillas de farmear cripto en este momento - no se necesita capital, solo contenido y comunidad.
Aquí hay 10 en vivo este mes, por recompensa:
• Knidos - Tokens + Acceso al Ecosistema
• Arxon - $100,000 en el pool / 30 días
• T-REX - Puntos del Ecosistema + Posible Airdrop
• Action Model - Tokens + Acceso Anticipado
• Astros - Tokens + Beneficios de Trading
• Ginox - $500/mes
• ChimpX - Tokens + Recompensas Comunitarias
• Solana Funded - $30,000 en el pool de creadores
• Injective - Tokens INJ mensuales
• Quant AI - $100,000 en $QUANT + USDT
#EarnFreeCrypto2024 10 Programas de Embajadores en Junio
Los programas de embajadores y creadores son una de las formas más sencillas de farmear cripto en este momento - no se necesita capital, solo contenido y comunidad.
Aquí hay 10 en vivo este mes, por recompensa:
• Knidos - Tokens + Acceso al Ecosistema
• Arxon - $100,000 en el pool / 30 días
• T-REX - Puntos del Ecosistema + Posible Airdrop
• Action Model - Tokens + Acceso Anticipado
• Astros - Tokens + Beneficios de Trading
• Ginox - $500/mes
• ChimpX - Tokens + Recompensas Comunitarias
• Solana Funded - $30,000 en el pool de creadores
• Injective - Tokens INJ mensuales
• Quant AI - $100,000 en $QUANT + USDT
Los programas de embajadores y creadores son una de las formas más sencillas de farmear cripto en este momento - no se necesita capital, solo contenido y comunidad.
Aquí hay 10 en vivo este mes, por recompensa:
• Knidos - Tokens + Acceso al Ecosistema
• Arxon - $100,000 en el pool / 30 días
• T-REX - Puntos del Ecosistema + Posible Airdrop
• Action Model - Tokens + Acceso Anticipado
• Astros - Tokens + Beneficios de Trading
• Ginox - $500/mes
• ChimpX - Tokens + Recompensas Comunitarias
• Solana Funded - $30,000 en el pool de creadores
• Injective - Tokens INJ mensuales
• Quant AI - $100,000 en $QUANT + USDT
171

·
--
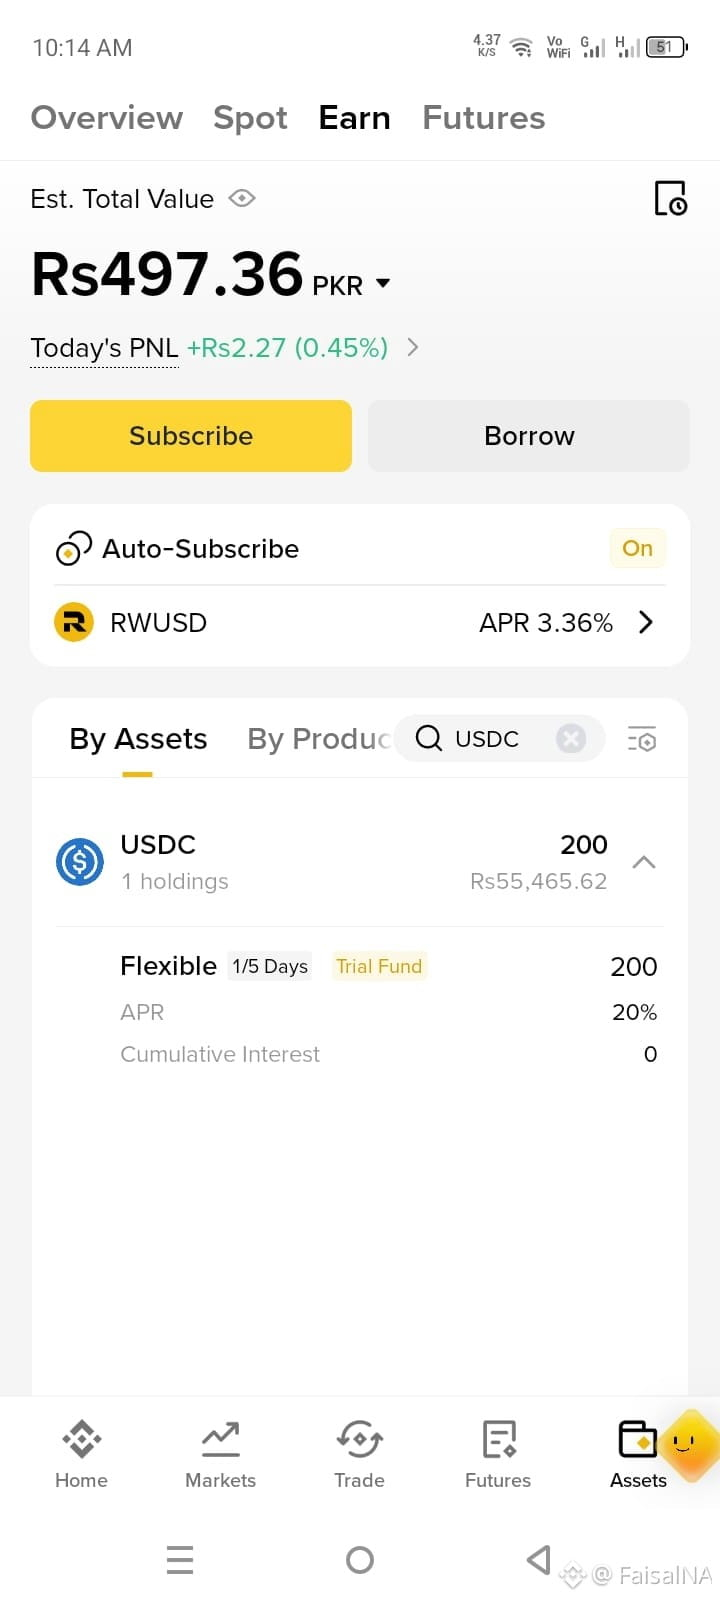
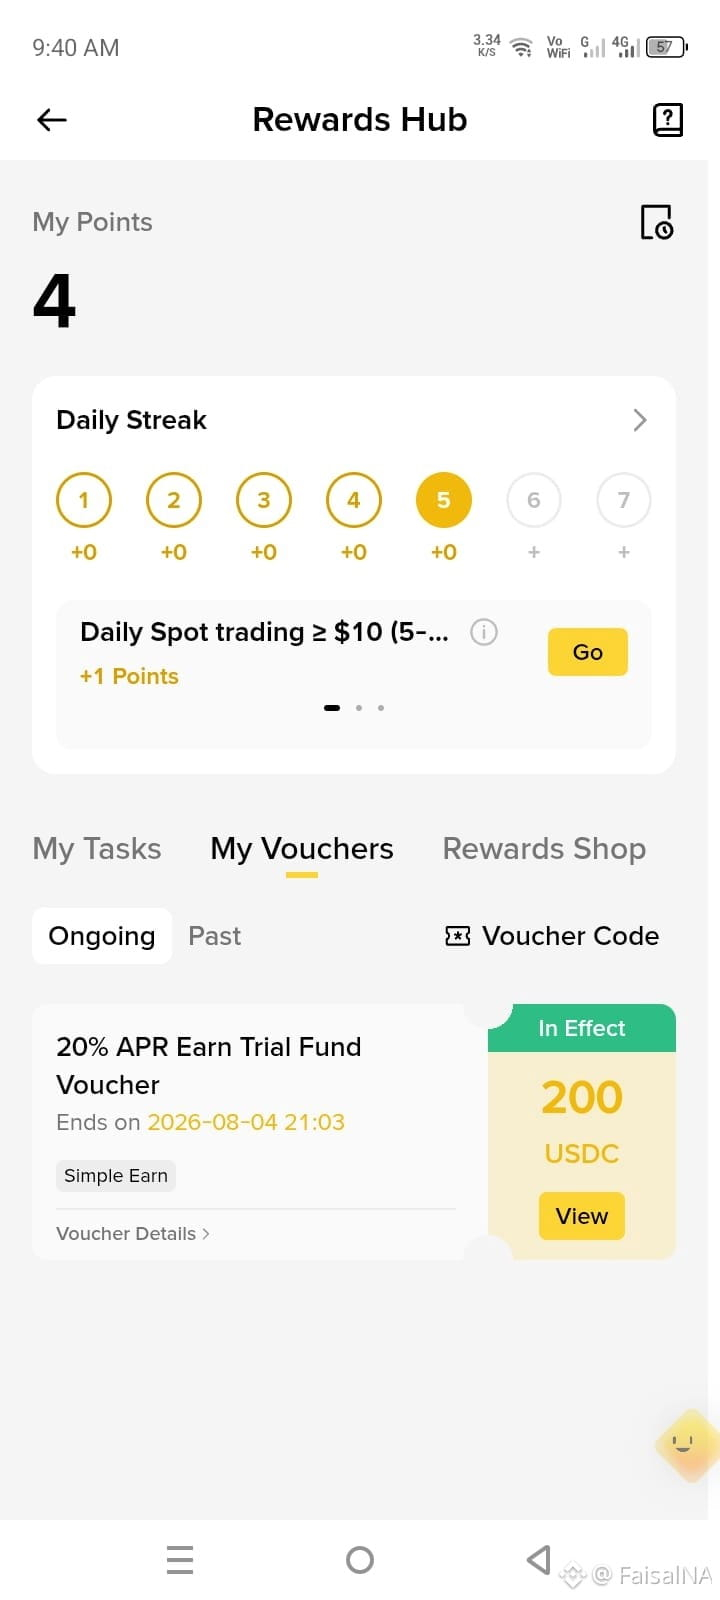
This is a Binance Earn Trial Fund Voucher worth 200 $USDC (around 55,400 PKR).What does it mean?Not Free Cash: You cannot withdraw, sell, or trade this 200 $USDC capital. It is temporary "demo money" provided by the exchange.Earn Real Profit: Binance has safely invested this fund for you in Simple Earn at a high 20% APR (Annual Percentage Rate) for a few days.Keep the Interest: While the 200 USDC capital will disappear when the voucher expires, any interest profit generated from it is 100% yours to keep, withdraw, or trade.
#BTC走势分析 #EarnFreeCrypto2024
This is a Binance Earn Trial Fund Voucher worth 200 $USDC (around 55,400 PKR).What does it mean?Not Free Cash: You cannot withdraw, sell, or trade this 200 $USDC capital. It is temporary "demo money" provided by the exchange.Earn Real Profit: Binance has safely invested this fund for you in Simple Earn at a high 20% APR (Annual Percentage Rate) for a few days.Keep the Interest: While the 200 USDC capital will disappear when the voucher expires, any interest profit generated from it is 100% yours to keep, withdraw, or trade.
#BTC走势分析 #EarnFreeCrypto2024
#BTC走势分析 #EarnFreeCrypto2024
118

#EarnFreeCrypto2024 participa en nuestra campaña
#EarnFreeCrypto2024 participa en nuestra campaña
47
Article
$2 to $4 daily on Binance without depositing capital 💸1. Content Creation on Binance Square (Write2Earn)
Mechanism: Post market commentary, trade setup breakdowns, technical charts, or macro news analysis directly on Binance Square.
Earning Potential: High. The Write2Earn program pays commissions based on reader engagement, tipping, and trades placed through content links.
Execution: Publishing 2–3 sharp, consistent posts daily can comfortably generate $2–$5+ daily once an audience is built.
2. Learn & Earn Quizzes
Mechanism: Complete short educational courses and pass simple multiple-choice quizzes inside the Binance app.
Earning Potential: Moderate (Varies per campaign). Rewards typically range from $1 to $10 in token vouchers per course.
Execution: Check the Binance Academy / Learn & Earn tab regularly for new campaign drops before the reward pools run out.
3. Referral & Affiliate Commissions
Mechanism: Share a referral link or custom code with active crypto traders.
Earning Potential: Scalable ($1–$100+ daily depending on network volume).
Execution: You receive up to a 20%–40% kickback from the trading fees generated by your referred users across Spot and Futures markets.
4. Web3 Wallet Quizzes & Airdrops
Mechanism: Participate in promotional Megadrops, Web3 Wallet quest tasks, and ecosystem interactive campaigns hosted on Binance.
Earning Potential: Periodic payouts ($5–$20 per successful event).
Execution: Complete basic on-chain interactions or social verification tasks to qualify for free token distributions.
$TRUMP
{future}(TRUMPUSDT)
#Write2Earn #freesignal #EarnFreeCrypto2024
$2 to $4 daily on Binance without depositing capital 💸
1. Content Creation on Binance Square (Write2Earn)
Mechanism: Post market commentary, trade setup breakdowns, technical charts, or macro news analysis directly on Binance Square.
Earning Potential: High. The Write2Earn program pays commissions based on reader engagement, tipping, and trades placed through content links.
Execution: Publishing 2–3 sharp, consistent posts daily can comfortably generate $2–$5+ daily once an audience is built.
2. Learn & Earn Quizzes
Mechanism: Complete short educational courses and pass simple multiple-choice quizzes inside the Binance app.
Earning Potential: Moderate (Varies per campaign). Rewards typically range from $1 to $10 in token vouchers per course.
Execution: Check the Binance Academy / Learn & Earn tab regularly for new campaign drops before the reward pools run out.
3. Referral & Affiliate Commissions
Mechanism: Share a referral link or custom code with active crypto traders.
Earning Potential: Scalable ($1–$100+ daily depending on network volume).
Execution: You receive up to a 20%–40% kickback from the trading fees generated by your referred users across Spot and Futures markets.
4. Web3 Wallet Quizzes & Airdrops
Mechanism: Participate in promotional Megadrops, Web3 Wallet quest tasks, and ecosystem interactive campaigns hosted on Binance.
Earning Potential: Periodic payouts ($5–$20 per successful event).
Execution: Complete basic on-chain interactions or social verification tasks to qualify for free token distributions.
$TRUMP
#Write2Earn #freesignal #EarnFreeCrypto2024
Mechanism: Post market commentary, trade setup breakdowns, technical charts, or macro news analysis directly on Binance Square.
Earning Potential: High. The Write2Earn program pays commissions based on reader engagement, tipping, and trades placed through content links.
Execution: Publishing 2–3 sharp, consistent posts daily can comfortably generate $2–$5+ daily once an audience is built.
2. Learn & Earn Quizzes
Mechanism: Complete short educational courses and pass simple multiple-choice quizzes inside the Binance app.
Earning Potential: Moderate (Varies per campaign). Rewards typically range from $1 to $10 in token vouchers per course.
Execution: Check the Binance Academy / Learn & Earn tab regularly for new campaign drops before the reward pools run out.
3. Referral & Affiliate Commissions
Mechanism: Share a referral link or custom code with active crypto traders.
Earning Potential: Scalable ($1–$100+ daily depending on network volume).
Execution: You receive up to a 20%–40% kickback from the trading fees generated by your referred users across Spot and Futures markets.
4. Web3 Wallet Quizzes & Airdrops
Mechanism: Participate in promotional Megadrops, Web3 Wallet quest tasks, and ecosystem interactive campaigns hosted on Binance.
Earning Potential: Periodic payouts ($5–$20 per successful event).
Execution: Complete basic on-chain interactions or social verification tasks to qualify for free token distributions.
$TRUMP
#Write2Earn #freesignal #EarnFreeCrypto2024
1
185
Crypto Trading Basics: Spot Covert Earn & P2P 💡
Spot Trading 📊: The most straightforward method. Buy or sell cryptocurrencies instantly at current market prices to take direct ownership.
Covert Trading 🔄: Simple, one-click token swaps. Swap one crypto directly for another with zero order-book complexity and zero slippage surprise.
Earn 📈: Put your idle crypto to work. Deposit assets into flexible or fixed savings accounts to yield passive interest over time—similar to a traditional bank savings account.
P2P (Peer-to-Peer) 🤝: Buy or sell directly with other users using local currencies and preferred payment methods (bank transfers, digital wallets), backed by platform escrow for safety.
Whether you're looking to swap instantly, trade actively, grow passively, or cash out locally, choosing the right tool makes all the difference! 🚀
also trade here $KOMA $RAYSOL $LSK
#SpotTrading. #EarnFreeCrypto2024 #P2PTradingTips
Crypto Trading Basics: Spot Covert Earn & P2P 💡
Spot Trading 📊: The most straightforward method. Buy or sell cryptocurrencies instantly at current market prices to take direct ownership.
Covert Trading 🔄: Simple, one-click token swaps. Swap one crypto directly for another with zero order-book complexity and zero slippage surprise.
Earn 📈: Put your idle crypto to work. Deposit assets into flexible or fixed savings accounts to yield passive interest over time—similar to a traditional bank savings account.
P2P (Peer-to-Peer) 🤝: Buy or sell directly with other users using local currencies and preferred payment methods (bank transfers, digital wallets), backed by platform escrow for safety.
Whether you're looking to swap instantly, trade actively, grow passively, or cash out locally, choosing the right tool makes all the difference! 🚀
also trade here $KOMA $RAYSOL $LSK
#SpotTrading. #EarnFreeCrypto2024 #P2PTradingTips
Spot Trading 📊: The most straightforward method. Buy or sell cryptocurrencies instantly at current market prices to take direct ownership.
Covert Trading 🔄: Simple, one-click token swaps. Swap one crypto directly for another with zero order-book complexity and zero slippage surprise.
Earn 📈: Put your idle crypto to work. Deposit assets into flexible or fixed savings accounts to yield passive interest over time—similar to a traditional bank savings account.
P2P (Peer-to-Peer) 🤝: Buy or sell directly with other users using local currencies and preferred payment methods (bank transfers, digital wallets), backed by platform escrow for safety.
Whether you're looking to swap instantly, trade actively, grow passively, or cash out locally, choosing the right tool makes all the difference! 🚀
also trade here $KOMA $RAYSOL $LSK
#SpotTrading. #EarnFreeCrypto2024 #P2PTradingTips

1
1
301

est-ce que vous saviez que vous pouvez gagner des pièces facilement sans investir sur binance? c'est Trop facile.
si tu es intéressé faire Moi signe et je t'explique
#Binance #EarnFreeCrypto2024
est-ce que vous saviez que vous pouvez gagner des pièces facilement sans investir sur binance? c'est Trop facile.
si tu es intéressé faire Moi signe et je t'explique
#Binance #EarnFreeCrypto2024
si tu es intéressé faire Moi signe et je t'explique
#Binance #EarnFreeCrypto2024
3
346

#BONO OPORTUNIDAD OFICIAL POR POCOS DIAS#BONO#BONO
Hablamos de la promocion vigente de #USDT. Adjunta la imagen oficial del anuncio de Binance. Muestro como reclamarla paso a paso con mi propia cuenta. Solo compartimos avisos oficiales para evitar confusiones.
ESTRATEGIA: Cumplo todos los requisitos antes de reclamar, sumo el bono a mi capital para llegar mas rapido a la meta. No dejo pasar oportunidades seguras.
ENLACE. https://www.binance.com/es/promotions | https://www.binance.com/pe #JtaAB #EarnFreeCrypto2024 #Binance #JtaAB
#JtaAB #BonoGratis #PromocionOficial #JtaAB #TiempoLimitado #AprovechaYa #BinancePromociones
#BONO OPORTUNIDAD OFICIAL POR POCOS DIAS
#BONO#BONO
Hablamos de la promocion vigente de #USDT. Adjunta la imagen oficial del anuncio de Binance. Muestro como reclamarla paso a paso con mi propia cuenta. Solo compartimos avisos oficiales para evitar confusiones.
ESTRATEGIA: Cumplo todos los requisitos antes de reclamar, sumo el bono a mi capital para llegar mas rapido a la meta. No dejo pasar oportunidades seguras.
ENLACE. https://www.binance.com/es/promotions | https://www.binance.com/pe #JtaAB #EarnFreeCrypto2024 #Binance #JtaAB
#JtaAB #BonoGratis #PromocionOficial #JtaAB #TiempoLimitado #AprovechaYa #BinancePromociones
Hablamos de la promocion vigente de #USDT. Adjunta la imagen oficial del anuncio de Binance. Muestro como reclamarla paso a paso con mi propia cuenta. Solo compartimos avisos oficiales para evitar confusiones.
ESTRATEGIA: Cumplo todos los requisitos antes de reclamar, sumo el bono a mi capital para llegar mas rapido a la meta. No dejo pasar oportunidades seguras.
ENLACE. https://www.binance.com/es/promotions | https://www.binance.com/pe #JtaAB #EarnFreeCrypto2024 #Binance #JtaAB
#JtaAB #BonoGratis #PromocionOficial #JtaAB #TiempoLimitado #AprovechaYa #BinancePromociones
147
·
--
Haussier
#RECOMPENSAS COMO SUMAR MAS SIN RIESGO
TEXTO:
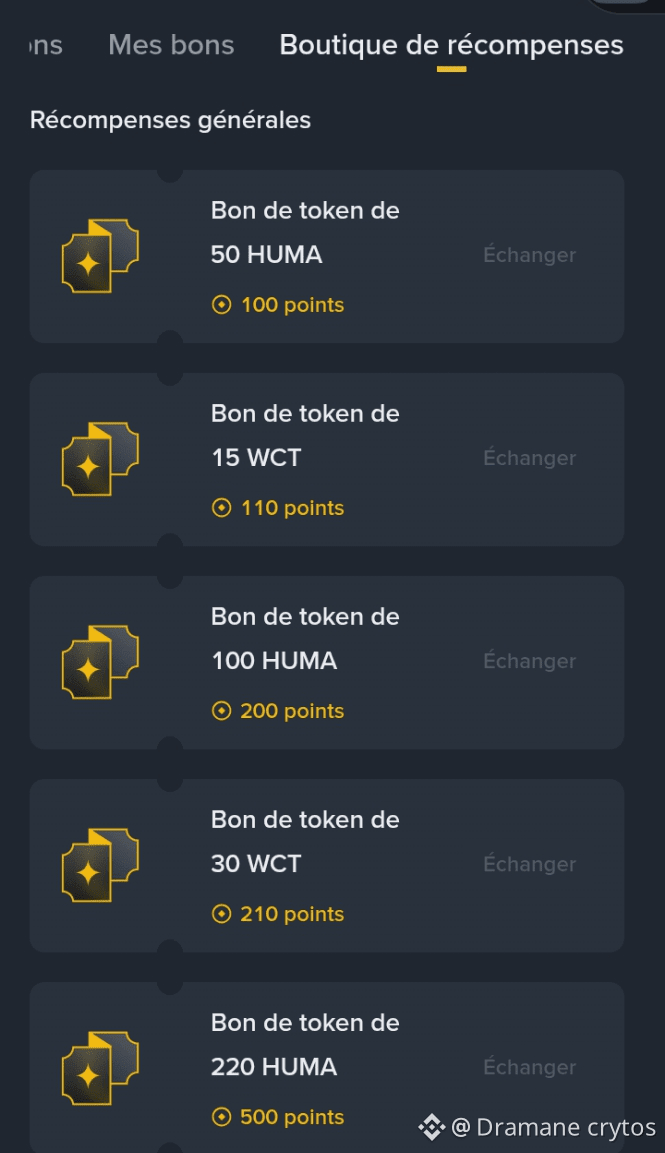
Hablamos de otras formas seguras de ganar en #BINANCE. Adjunta la lista de recompensas disponibles. Muestro cuales son seguras y cuales debes revisar bien. Ayudo a que no pierdas tiempo en cosas inutiles.
ESTRATEGIA: Solo uso recompensas de la plataforma oficial, nunca de terceros. Todo suma a mi saldo principal para crecer mas rapido.
ENLACES: https://www.binance.com/es/rewards | https://www.binance.com/es/support/faq/recompensas
HASHTAGS: #Recompensas #SinInvertirMas #SeguridadPrimero #MasOportunidades #SiguemeParaMas #JtaAB
🤑🤑🤑🤑🤑🤑#earn_crypto #EarnFreeCrypto2024
#RECOMPENSAS COMO SUMAR MAS SIN RIESGO
TEXTO:
Hablamos de otras formas seguras de ganar en #BINANCE. Adjunta la lista de recompensas disponibles. Muestro cuales son seguras y cuales debes revisar bien. Ayudo a que no pierdas tiempo en cosas inutiles.
ESTRATEGIA: Solo uso recompensas de la plataforma oficial, nunca de terceros. Todo suma a mi saldo principal para crecer mas rapido.
ENLACES: https://www.binance.com/es/rewards | https://www.binance.com/es/support/faq/recompensas
HASHTAGS: #Recompensas #SinInvertirMas #SeguridadPrimero #MasOportunidades #SiguemeParaMas #JtaAB
🤑🤑🤑🤑🤑🤑#earn_crypto #EarnFreeCrypto2024
TEXTO:
Hablamos de otras formas seguras de ganar en #BINANCE. Adjunta la lista de recompensas disponibles. Muestro cuales son seguras y cuales debes revisar bien. Ayudo a que no pierdas tiempo en cosas inutiles.
ESTRATEGIA: Solo uso recompensas de la plataforma oficial, nunca de terceros. Todo suma a mi saldo principal para crecer mas rapido.
ENLACES: https://www.binance.com/es/rewards | https://www.binance.com/es/support/faq/recompensas
HASHTAGS: #Recompensas #SinInvertirMas #SeguridadPrimero #MasOportunidades #SiguemeParaMas #JtaAB
🤑🤑🤑🤑🤑🤑#earn_crypto #EarnFreeCrypto2024
138
Connectez-vous pour découvrir plus de contenu
Rejoignez la communauté mondiale des adeptes de cryptomonnaies sur Binance Square
⚡️ Suviez les dernières informations importantes sur les cryptomonnaies.
💬 Jugé digne de confiance par la plus grande plateforme d’échange de cryptomonnaies au monde.
👍 Découvrez les connaissances que partagent les créateurs vérifiés.
Adresse e-mail/Nº de téléphone
Sujets d’actualité
1
#EarningsSeason
399,424 vues
3,035 mentions
2
#SECChairWantsStockMarketsOnChain
2,088 vues
93 mentions
3
#MulticoinInvestsInGrass
835 vues
63 mentions
4
#CEARenamesToBNBStandardUnderBNC
2,145 vues
83 mentions
5
#BitwiseLaunchesFirstSpotNEARETF
50,152 vues
716 mentions
6
#USJobOpeningsFallToFiveMonthLow
54,215 vues
553 mentions
7
#ECBToTestAIAgentsInDigitalEuroPayments
35,894 vues
601 mentions
8
#JapanFSABacksFourthStablecoinTradeSettlementPilot
40,778 vues
628 mentions
9
#BitgetHackerFailsToMoveStolenFunds
57,978 vues
691 mentions
10
#BitMineETHHoldingsTop6Million
45,250 vues
754 mentions