Bitcoin Reclaims Its 50-Week Moving Average! 📈
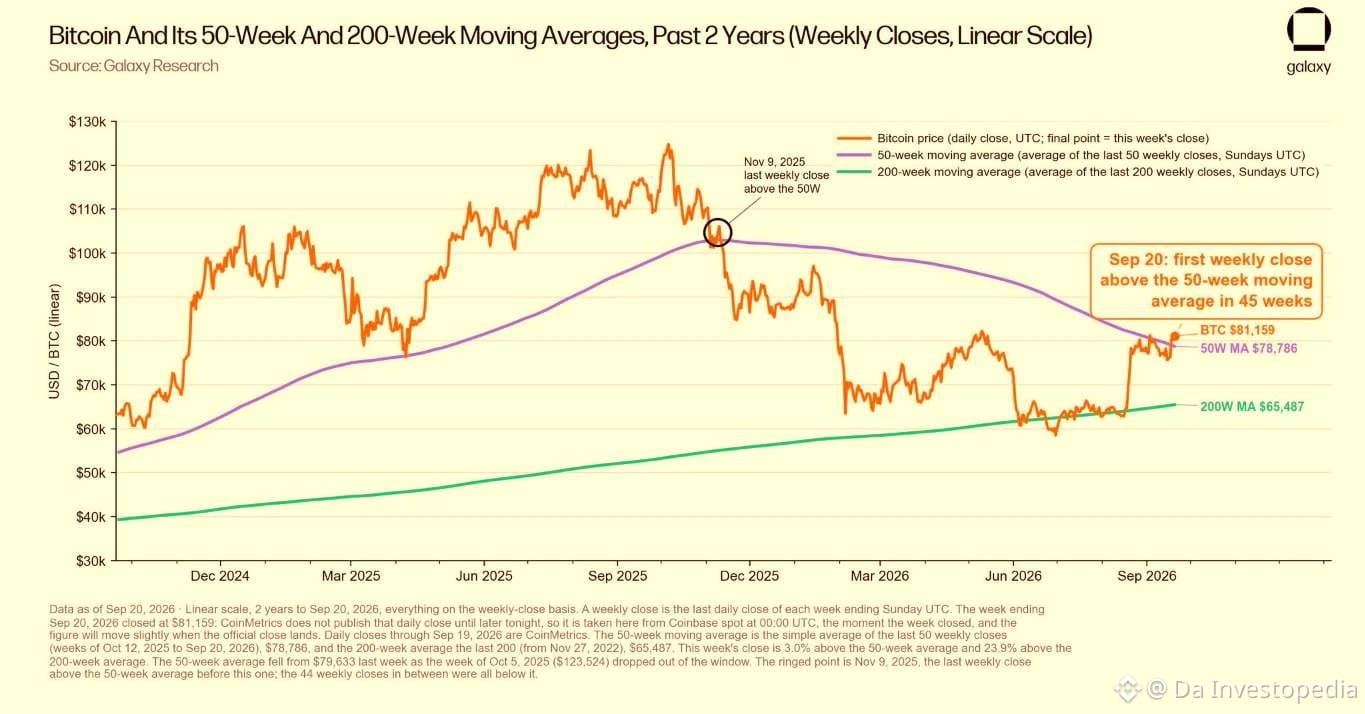
Bitcoin’s weekly close at $81,159, moving back above its 50-week moving average at $78,786 for the first time in 45 weeks.
The 50-week MA has been an important trend indicator throughout Bitcoin’s market cycles. The chart also shows $BTC remaining well above its 200-week moving average at $65,487, keeping the broader long-term structure constructive. What makes this move interesting is not simply the breakout above one moving average, but the length of time #BTC spent below it.
The next key factor is whether Bitcoin can maintain weekly closes above the 50-week MA and turn this reclaimed level into lasting support.
#BTC Price Analysis# #Bitcoin Price Prediction: What is Bitcoins next move?#
(Chart: Galaxy Research’s Alex Thorn)
Bitcoin’s weekly close at $81,159, moving back above its 50-week moving average at $78,786 for the first time in 45 weeks.
The 50-week MA has been an important trend indicator throughout Bitcoin’s market cycles. The chart also shows $BTC remaining well above its 200-week moving average at $65,487, keeping the broader long-term structure constructive. What makes this move interesting is not simply the breakout above one moving average, but the length of time #BTC spent below it.
The next key factor is whether Bitcoin can maintain weekly closes above the 50-week MA and turn this reclaimed level into lasting support.
#BTC Price Analysis# #Bitcoin Price Prediction: What is Bitcoins next move?#
(Chart: Galaxy Research’s Alex Thorn)