+62.79% range in 24 hours.
That’s not a trend — that’s a liquidation cascade looking for a resting place.
$PNT printed a 35% green candle, then gave back 24% in the next 4H close. Daily RSI sits at 27.65 — deep oversold, but on this volatility, oversold can outlast most accounts.
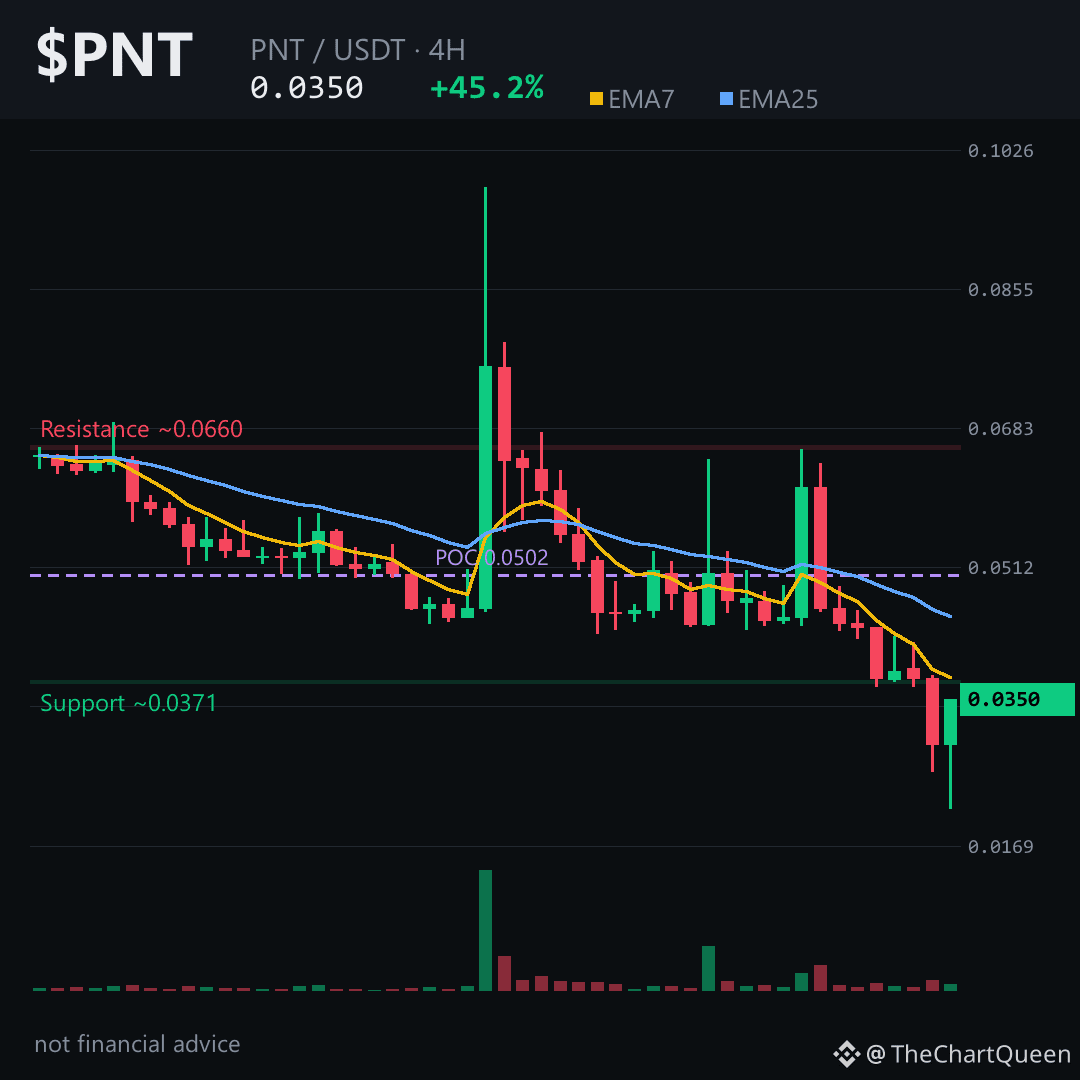
4H structure is the cleanest read. Price hovers near 0.035, with the 7 EMA still below the 25 EMA — textbook bearish alignment. Every bounce in 48 hours has been sold.
Volume profile POC sits near 0.050 — bulk of recent trading happened far above current price. That overhead supply is now resistance.
Invalidation zone is tight: a 4H close back above 0.037 signals the bounce has legs. Until then, path of least resistance points toward 0.032, with lower levels possible if momentum stalls.
My read: the bounce off 0.0215 is real, but it’s a relief rally inside a larger downtrend — not a reversal. The risk isn’t missing the bottom; it’s mistaking a dead-cat bounce for trend change.
Tap $PNT to pull up the chart and see these levels yourself.
I’ll keep tracking whether 0.032 gets tested or 0.037 invalidation holds first — follow so the next read lands in your feed.
Which level are you watching more closely on $PNT right now — the bounce zone or the breakdown zone? 👇
⚠️ Not financial advice. DYOR.
#PNT #Crypto #BinanceSquare
That’s not a trend — that’s a liquidation cascade looking for a resting place.
$PNT printed a 35% green candle, then gave back 24% in the next 4H close. Daily RSI sits at 27.65 — deep oversold, but on this volatility, oversold can outlast most accounts.
4H structure is the cleanest read. Price hovers near 0.035, with the 7 EMA still below the 25 EMA — textbook bearish alignment. Every bounce in 48 hours has been sold.
Volume profile POC sits near 0.050 — bulk of recent trading happened far above current price. That overhead supply is now resistance.
Invalidation zone is tight: a 4H close back above 0.037 signals the bounce has legs. Until then, path of least resistance points toward 0.032, with lower levels possible if momentum stalls.
My read: the bounce off 0.0215 is real, but it’s a relief rally inside a larger downtrend — not a reversal. The risk isn’t missing the bottom; it’s mistaking a dead-cat bounce for trend change.
Tap $PNT to pull up the chart and see these levels yourself.
I’ll keep tracking whether 0.032 gets tested or 0.037 invalidation holds first — follow so the next read lands in your feed.
Which level are you watching more closely on $PNT right now — the bounce zone or the breakdown zone? 👇
⚠️ Not financial advice. DYOR.
#PNT #Crypto #BinanceSquare