

Technical Analysis
💵 Coin: ARB / USDT
⏳ Time Frame: 6D
📐 Pattern: Descending Channel
📍 Current Price: around $0.165
---
📐 DESCENDING CHANNEL
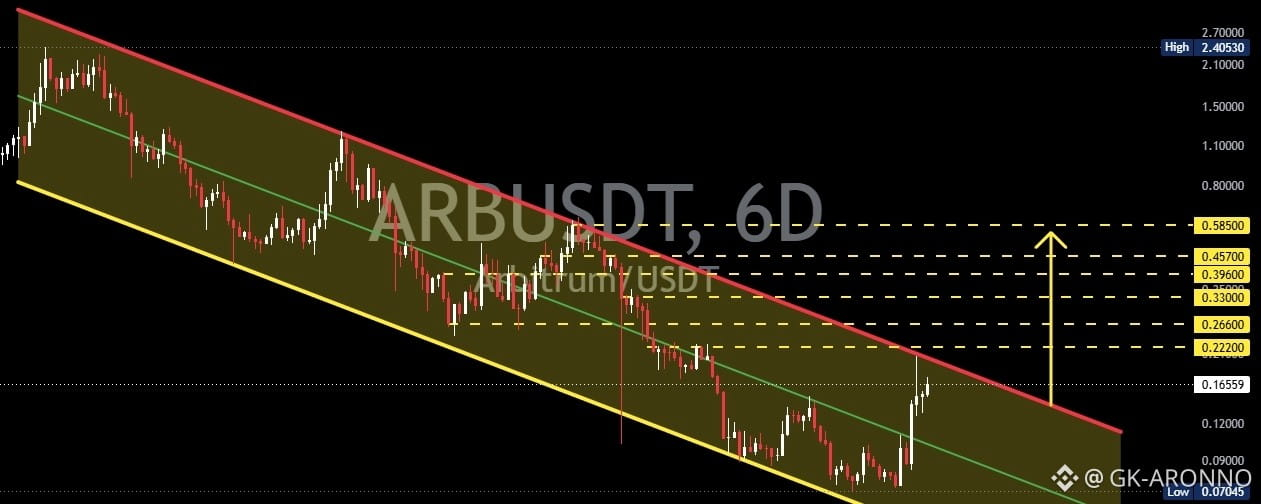
🔻 ARB has been moving within a long-term Descending Channel, with price forming a sequence of Lower Highs and Lower Lows since the 2024 peak.
📉 The channel resistance is represented by the red trendline, which has continued to pressure price from above.
📈 The channel support is represented by the yellow trendline, which has acted as a reaction area near the lower boundary of the channel.
🟢 The middle channel line also acts as dynamic resistance/support, making price behavior around this area important to monitor.
💡 As long as ARB remains inside the channel, the long-term structure continues to show bearish pressure. However, as price approaches the upper resistance, the possibility of a breakout becomes increasingly relevant.
---
🟢 BULLISH SCENARIO
🚀 Bullish confirmation would become stronger if ARB manages to break out and close convincingly above the descending trendline (red line).
📈 If a breakout occurs, the horizontal resistance levels shown on the chart can be monitored progressively:
🎯 Target 1: $0.222
🎯 Target 2: $0.266
🎯 Target 3: $0.330
🎯 Target 4: $0.396
🎯 Target 5: $0.457
🎯 Target 6: $0.585
🔥 The $0.457–$0.585 area represents an important resistance zone on this chart structure.
💡 If price manages to break through this resistance and maintain a bullish structure, the move could develop into a long-term reversal, rather than simply a relief rally.
⚠️ However, the breakout should ideally be confirmed through a candle close, volume, and the ability of price to successfully retest the broken resistance.
---
🔴 BEARISH SCENARIO
🔻 The bearish scenario remains valid if ARB fails to break above the descending trendline and receives another rejection from the channel resistance.
📉 If price moves deeper back into the channel, the following support areas should be monitored:
🛡️ Support: $0.165
🛡️ Support: $0.120
🛡️ Major Support: around $0.090–$0.070
⚠️ If ARB loses the lower support area and forms another Lower Low, the long-term bearish structure could continue.
📌 As long as price has not successfully broken out of the channel, the breakout should not be considered a fully confirmed trend reversal.
---
🧠 CONCLUSION
🔎 ARB is currently approaching an important area within its long-term Descending Channel structure.
📉 Bearish: Price remains below the descending resistance and gets rejected → potential continuation within the channel.
📈 Bullish: Breakout + close above the descending trendline → opens the possibility toward $0.222 → $0.266 → $0.330 → $0.396 → $0.457 → $0.585.
🔥 Therefore, the red descending trendline is the key structural level to watch. A confirmed breakout could represent an important change in ARB's long-term market structure.
⚠️ DYOR — Not Financial Advice.
