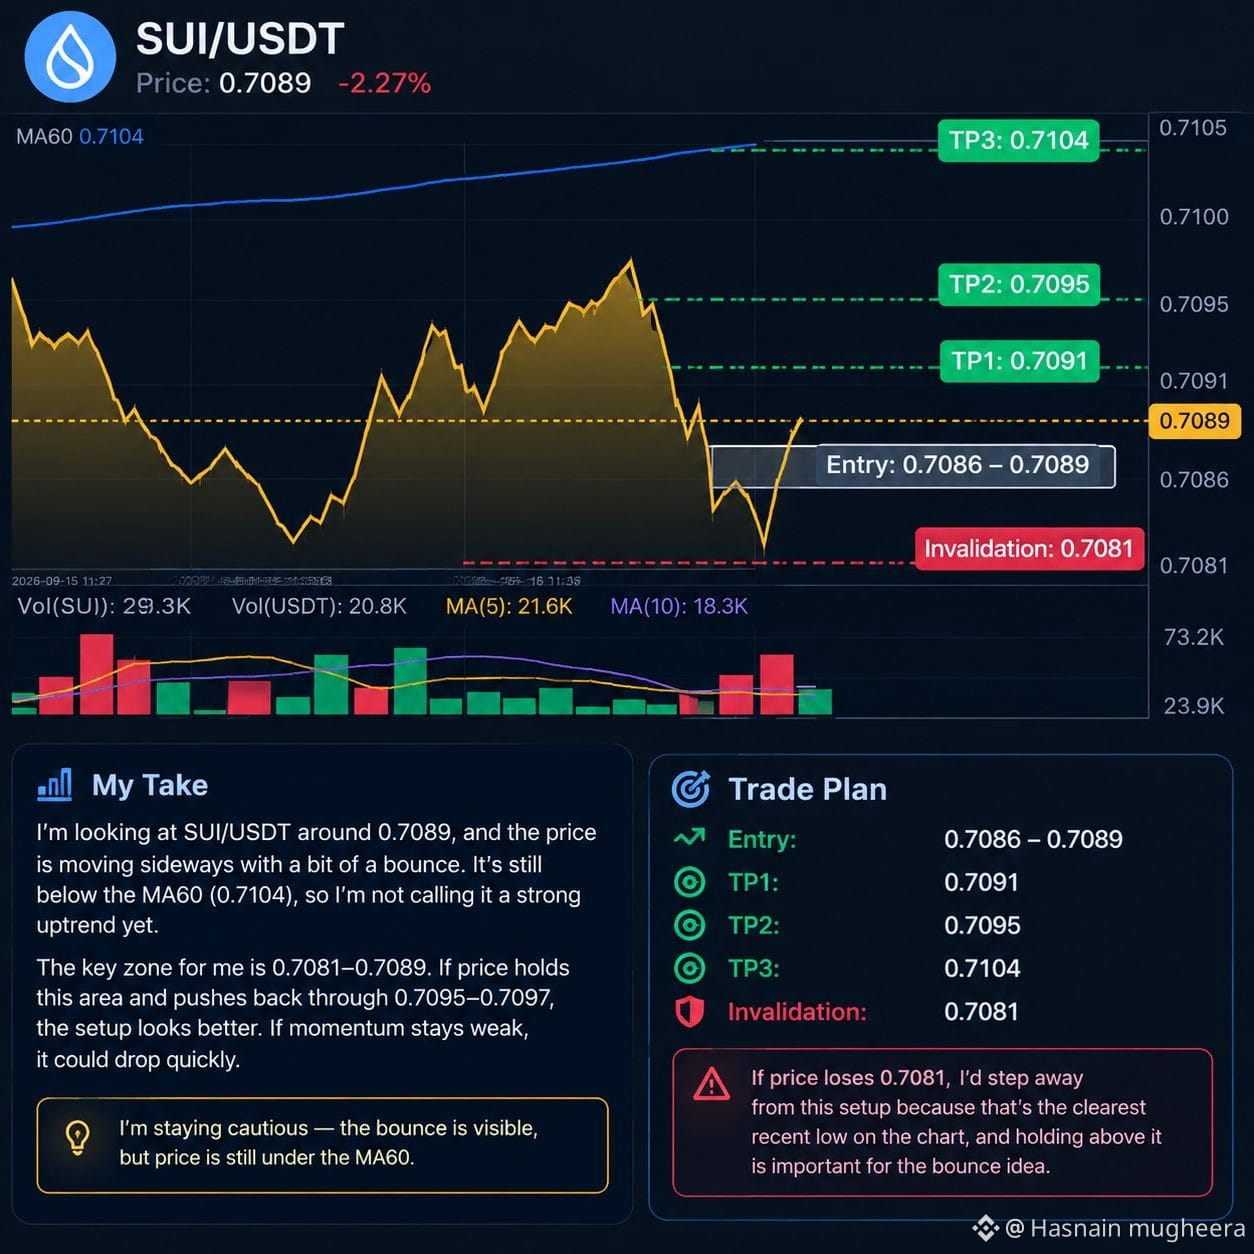
I’m looking at $SUI /USDT around 0.7089, and the immediate price action looks choppy rather than strongly directional. Price has bounced from the visible 0.7081 area, but it’s still sitting below the MA60 at 0.7104, so I’m not treating this as a confirmed bullish move.
For me, the key area is 0.7081–0.7089. I’d like to see price hold this zone and push back through the recent visible highs around 0.7095–0.7097. If momentum stays weak, this setup can fail quickly.
📍 Entry: 0.7086–0.7089
🎯 TP1: 0.7091
🎯 TP2: 0.7095
🎯 TP3: 0.7104
🛑 Invalidation: 0.7081
If price loses 0.7081, I’d step away from this setup because that’s the clearest recent low visible on the chart, and holding above it is important for the bounce idea.
I’m keeping this one cautious: the rebound is visible, but price remains under the MA60. I’d rather see a clean push higher before getting more confident.
For me, the key area is 0.7081–0.7089. I’d like to see price hold this zone and push back through the recent visible highs around 0.7095–0.7097. If momentum stays weak, this setup can fail quickly.
📍 Entry: 0.7086–0.7089
🎯 TP1: 0.7091
🎯 TP2: 0.7095
🎯 TP3: 0.7104
🛑 Invalidation: 0.7081
If price loses 0.7081, I’d step away from this setup because that’s the clearest recent low visible on the chart, and holding above it is important for the bounce idea.
I’m keeping this one cautious: the rebound is visible, but price remains under the MA60. I’d rather see a clean push higher before getting more confident.