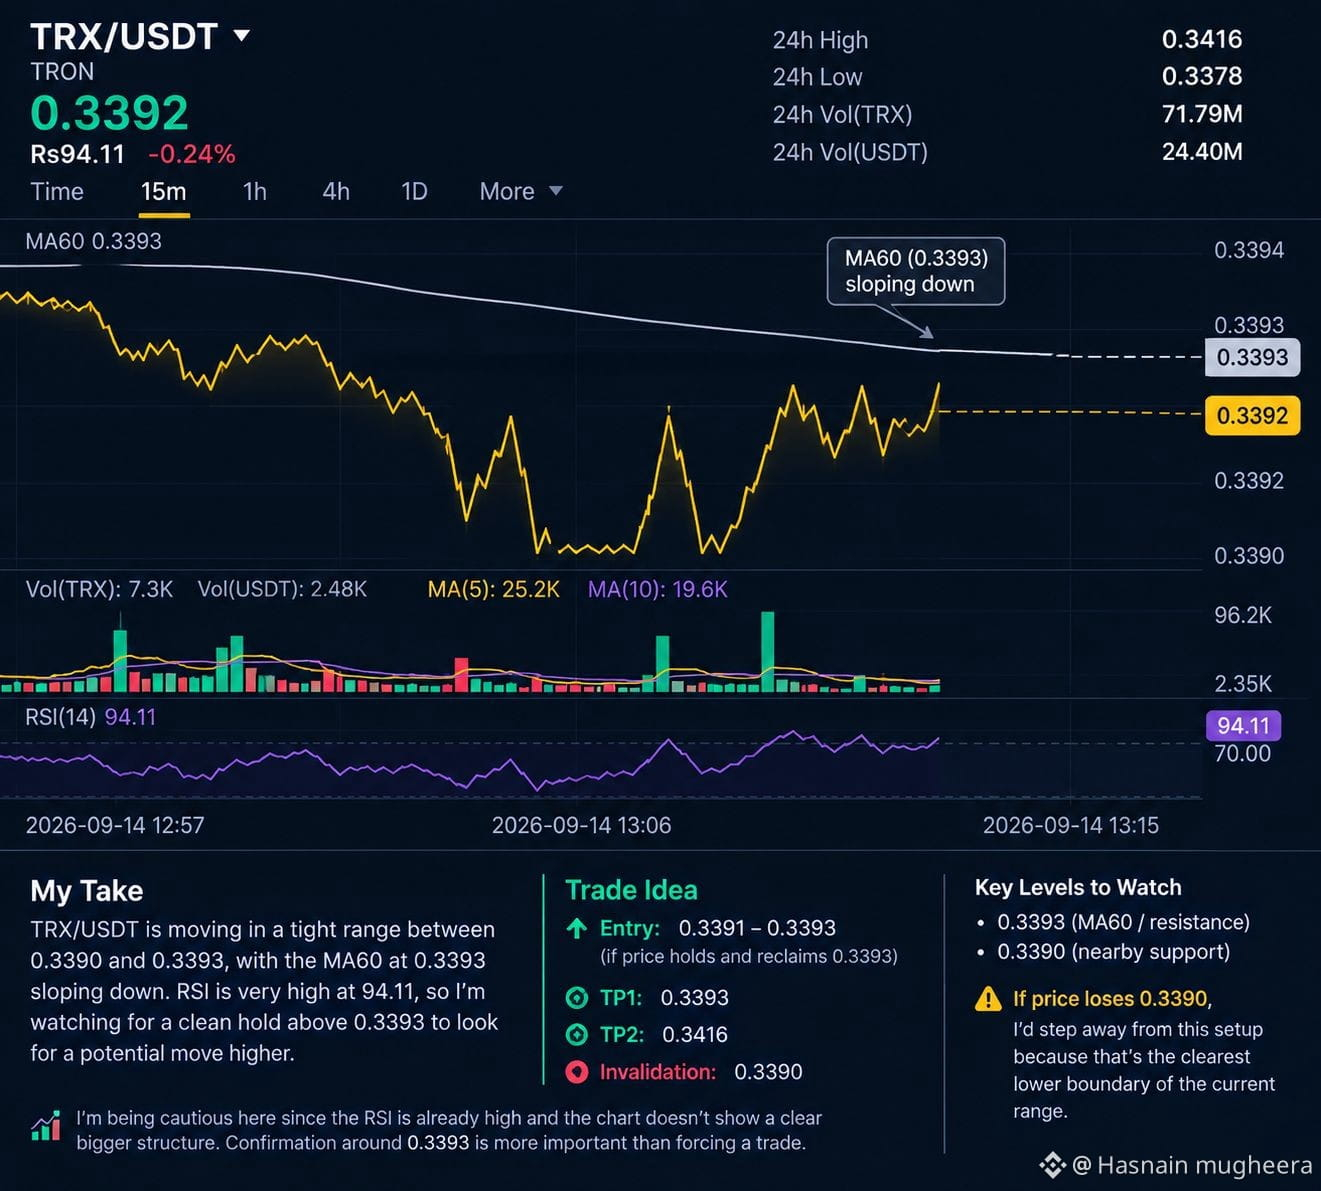
I’m looking at $TRX /USDT around 0.3392, with the visible price action moving inside a very tight 0.3390–0.3393 range. For me, the key point is that the MA60 sits at 0.3393 and is sloping down, while RSI is extremely high at 94.11.
Price is currently below the visible MA60 level, so I’d want to see a clean move back above 0.3393 before considering the setup attractive. The repeated reactions around 0.3390 make that the main nearby level I’m watching.
📍 Entry: 0.3391–0.3393, only if price holds this area and reclaims 0.3393
🎯 TP1: 0.3393
🎯 TP2: 0.3416
🛑 Invalidation: 0.3390
If price loses 0.3390, I’d step away from this setup because that is the clearest visible lower boundary of the current range.
I’m keeping this cautious because the screenshot doesn’t provide enough structure to justify additional targets. The high RSI also makes chasing strength less attractive. For me, confirmation around 0.3393 is more important than forcing a trade from this tight range.
Price is currently below the visible MA60 level, so I’d want to see a clean move back above 0.3393 before considering the setup attractive. The repeated reactions around 0.3390 make that the main nearby level I’m watching.
📍 Entry: 0.3391–0.3393, only if price holds this area and reclaims 0.3393
🎯 TP1: 0.3393
🎯 TP2: 0.3416
🛑 Invalidation: 0.3390
If price loses 0.3390, I’d step away from this setup because that is the clearest visible lower boundary of the current range.
I’m keeping this cautious because the screenshot doesn’t provide enough structure to justify additional targets. The high RSI also makes chasing strength less attractive. For me, confirmation around 0.3393 is more important than forcing a trade from this tight range.