
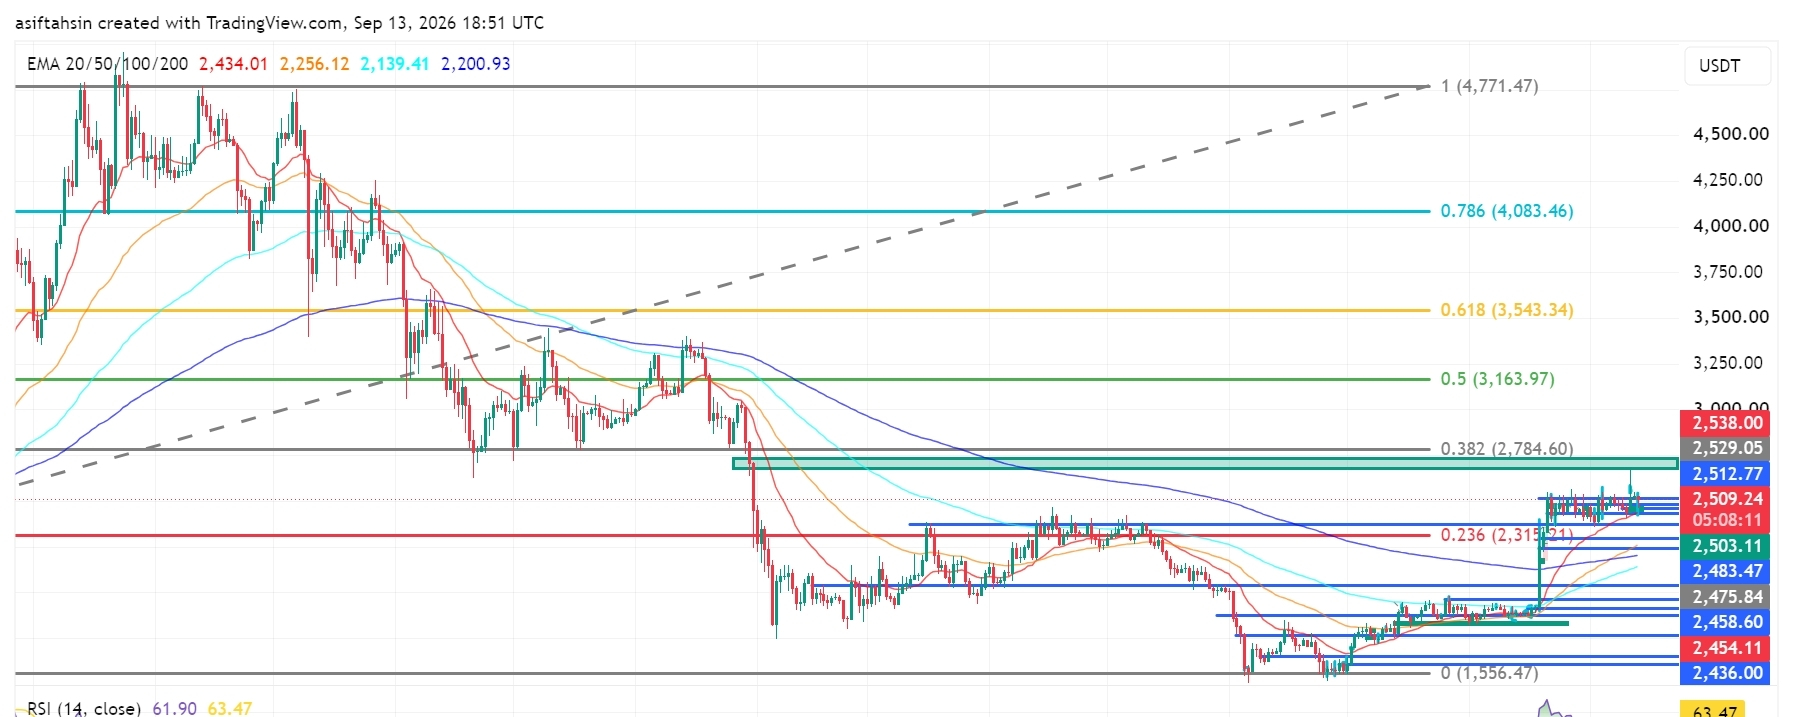

ETH is currently trading around $2,509, consolidating above the psychological $2,500 level after a strong recovery from the June lows.
The broader structure remains constructive, with ETH trading well above all four major EMAs. However, price is now approaching a significant resistance cluster around $2,512–$2,538. Bulls need a clean breakout above this zone to open the path toward the $2,784 Fibonacci resistance.
📈 EMA Structure
20 EMA: $2,434.01
50 EMA: $2,256.12
100 EMA: $2,139.41
200 EMA: $2,200.93
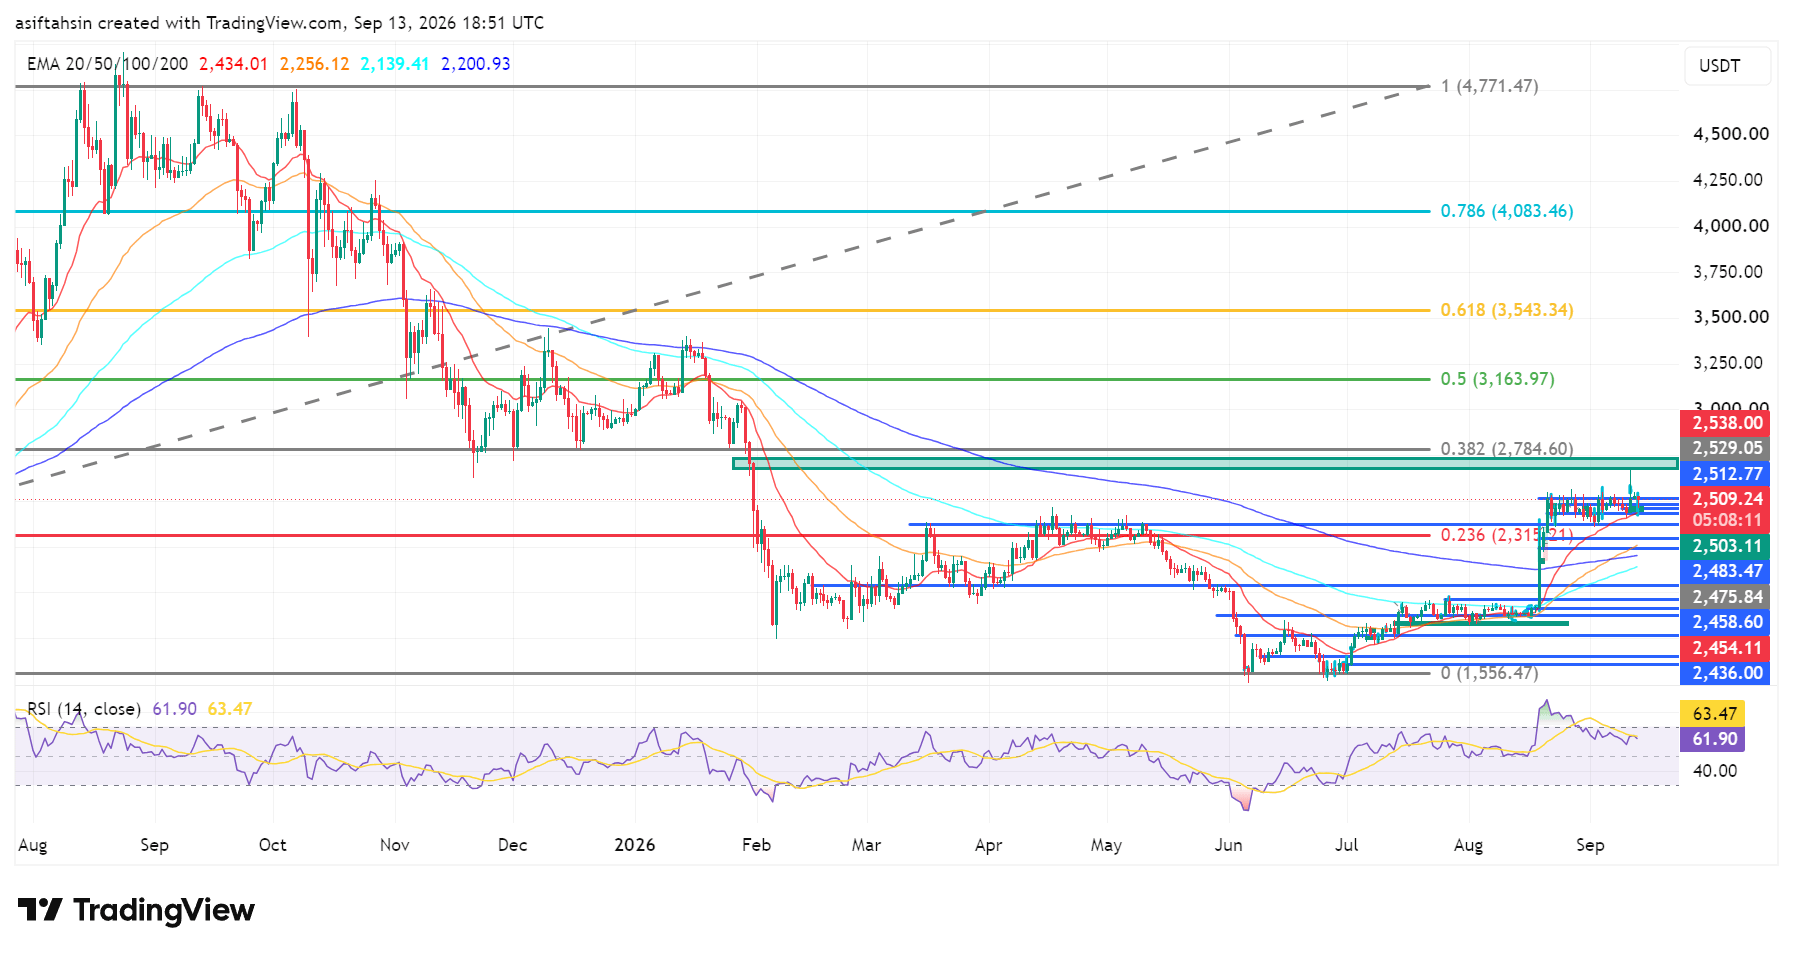
ETH remains comfortably above all four major EMAs, keeping the medium-term recovery structure bullish.
The $2,434 20 EMA is now the key dynamic support. As long as ETH remains above this level, buyers maintain control of the current recovery.
📐 Fibonacci Levels
0.236: $2,315.21
0.382: $2,784.60
0.5: $3,163.97
0.618: $3,543.34
0.786: $4,083.46
1.0: $4,771.47
The $2,784.60 0.382 Fibonacci level is the next major upside objective after the current resistance cluster.
🟢 Bullish Scenario
ETH is consolidating just below the $2,512–$2,538 resistance zone.
A clean breakout and sustained close above $2,538 could trigger another bullish expansion.
🎯 Target 1: $2,550
🎯 Target 2: $2,600
🎯 Target 3: $2,700
🎯 Target 4: $2,784.60
🎯 Target 5: $3,163.97
🎯 Target 6: $3,543.34
A decisive reclaim of $2,784.60 would be an important confirmation that ETH is transitioning into a stronger medium-term recovery phase.
🔴 Pullback Scenario
If ETH fails to break the $2,512–$2,538 resistance cluster, a short-term pullback could develop.
Key supports:
$2,503.11
$2,483.47
$2,475.84
$2,458.60
$2,454.11
$2,434.01 — 20 EMA
$2,315.21 — 0.236 Fib
The $2,454–$2,434 region is particularly important. A successful retest here could provide a base for another attempt at the $2,538 resistance.
A sustained break below the 20 EMA would weaken the short-term bullish structure.
🧠 Market Structure & Liquidity
ETH's recent structure can be viewed as:
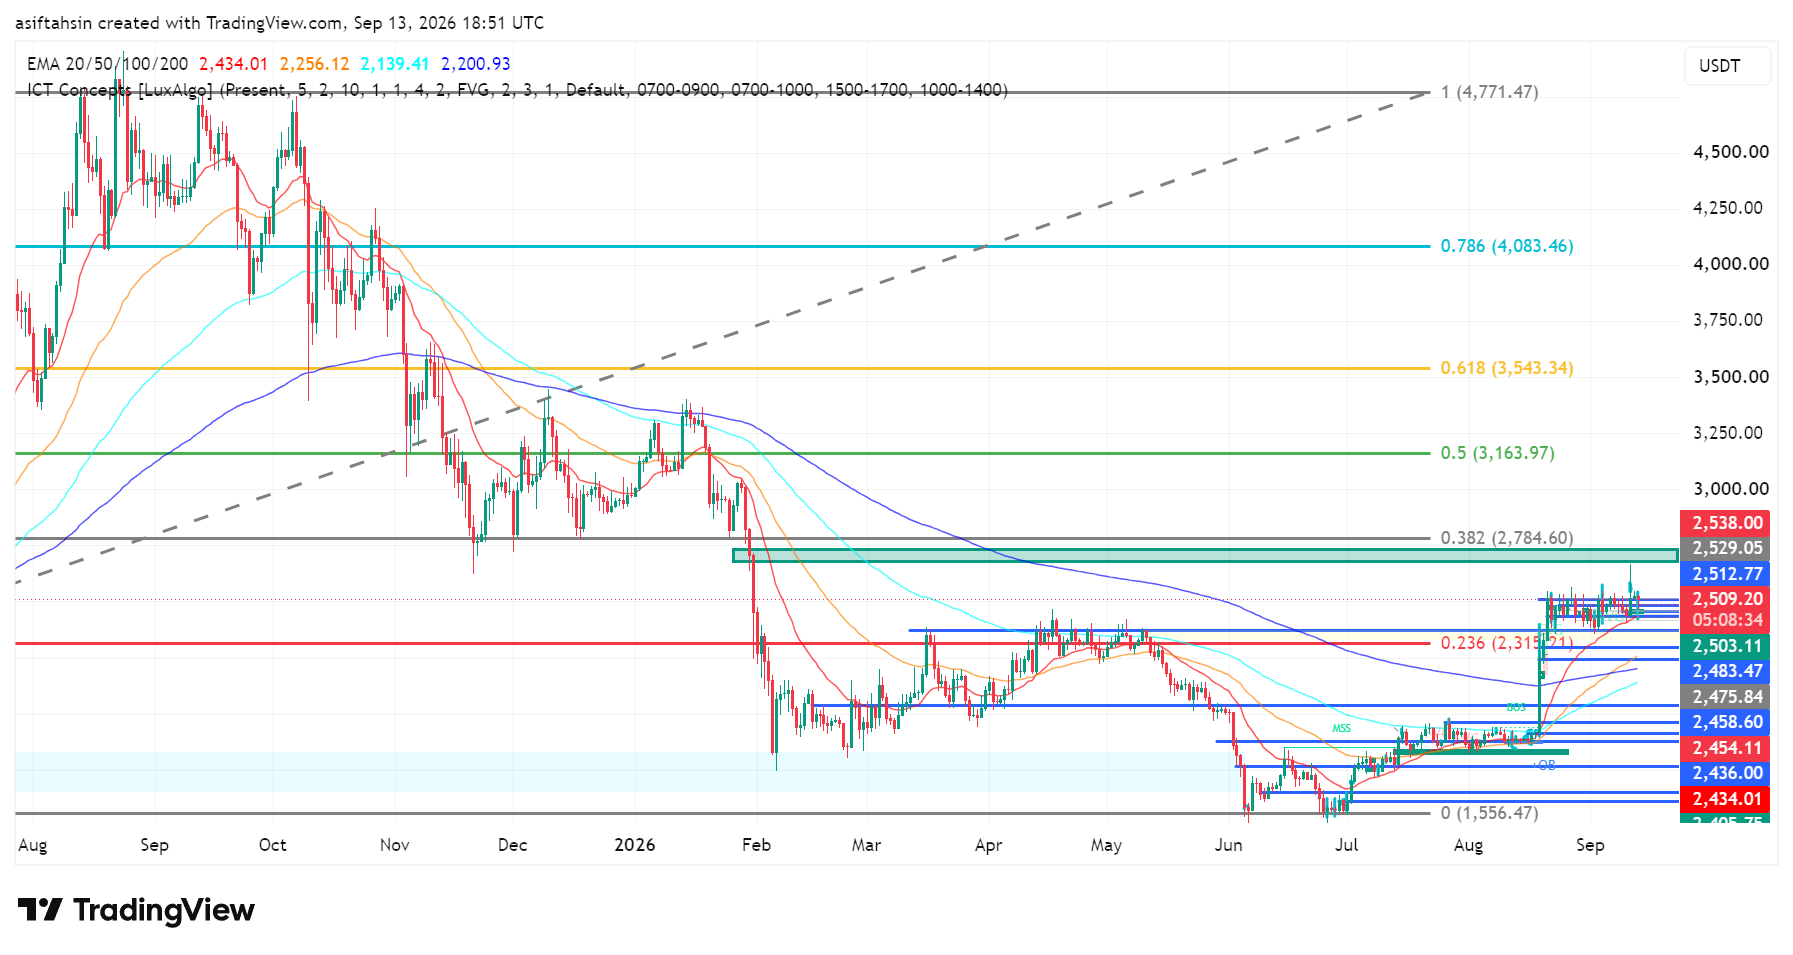
Liquidity Sweep → Accumulation → Higher Lows → Breakout → Reclaim → Consolidation → Potential Continuation
The June low around $1,556 created a major liquidity sweep, followed by a strong recovery and a series of higher lows.
ETH has now reclaimed the $2,500 psychological level and is consolidating near the recent highs.
The next major structural test is $2,538, followed by the $2,784.60 Fibonacci resistance.
📊 RSI Momentum
RSI: 61.90
RSI MA: 63.47
RSI remains above 60, confirming that bullish momentum is still present.
However, RSI is slightly below its moving average, suggesting momentum has cooled from the recent spike. A renewed move above 63–65 would strengthen the continuation setup.
🎯 Key Levels
Resistance:
$2,512.77 → $2,529.05 → $2,538 → $2,784.60 → $3,163.97 → $3,543.34
Support:
$2,503.11 → $2,483.47 → $2,475.84 → $2,458.60 → $2,454.11 → $2,434.01 → $2,315.21
📌 Final Outlook
ETH remains in a constructive recovery structure while holding above the $2,500 area and all major EMAs.
The immediate battle is $2,512–$2,538. A decisive breakout above this zone could push ETH toward $2,600 → $2,700 → $2,784.60, while a confirmed break above $2,784 could open the path toward $3,163.97.
On the downside, $2,434 is the key dynamic support. As long as ETH holds above this level, the broader bullish recovery remains intact.
Bias: 🟢 Bullish above $2,434 | Stronger above $2,538
