$NOW / #NOW — A BIG TECHNICAL SETUP IS FORMING 🚨
ServiceNow is showing a very interesting structure on the 1D chart.
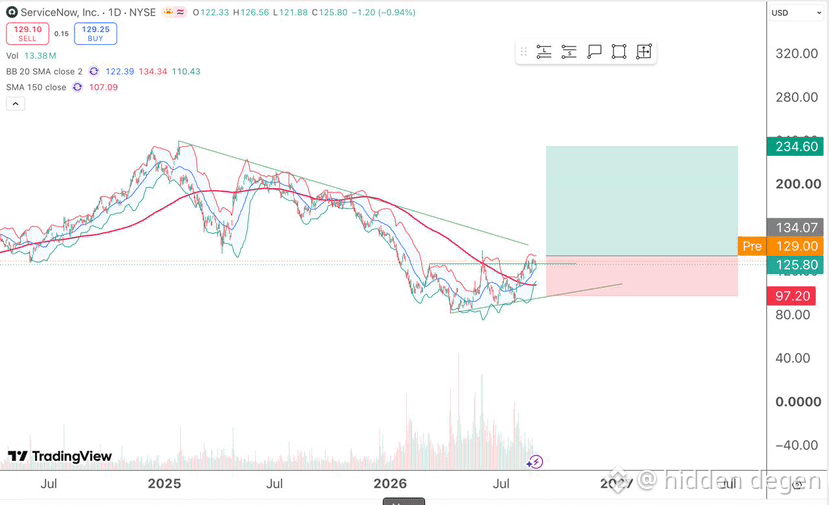
After a major decline from the previous highs, price appears to be building a base + higher-low structure while pushing back toward the key resistance zone around $129–$134.
📊 What I’m watching:
🟢 Current price: ~$125.80
🟢 Key resistance: $129–$134
🟢 Major upside target: ~$234.60
🔴 Invalidation / risk zone: ~$97.20
The chart is also showing price recovering from the lower region and attempting to reclaim the descending trendline / previous resistance area.
🔥 Bullish scenario
If $NOW can get a strong daily close above $129–$134, followed by a successful retest, this could confirm a much larger trend reversal.
Potential upside levels to watch:
🎯 $150
🎯 $170
🎯 $190
🎯 $210
🎯 $234+
The $234–235 area is particularly interesting because it lines up with the projected resistance/target zone on the chart.
⚠️ Bearish scenario
If price gets rejected around $129–$134 and loses the recent support structure, the setup could fail.
A sustained move back below the lower support area would weaken the bullish thesis significantly, with ~$97 acting as the major invalidation zone shown on the chart.
👀 The key level
$134 is the level I’m watching.
A clean breakout + retest above this area could completely change the structure from recovery → potential new uptrend.
Not financial advice. Always manage risk and do your own research.
#NOW #ServiceNow #StockMarket #Stocks #TechnicalAnalysis #Trading #Breakout #Bullish #Investing
ServiceNow is showing a very interesting structure on the 1D chart.
After a major decline from the previous highs, price appears to be building a base + higher-low structure while pushing back toward the key resistance zone around $129–$134.
📊 What I’m watching:
🟢 Current price: ~$125.80
🟢 Key resistance: $129–$134
🟢 Major upside target: ~$234.60
🔴 Invalidation / risk zone: ~$97.20
The chart is also showing price recovering from the lower region and attempting to reclaim the descending trendline / previous resistance area.
🔥 Bullish scenario
If $NOW can get a strong daily close above $129–$134, followed by a successful retest, this could confirm a much larger trend reversal.
Potential upside levels to watch:
🎯 $150
🎯 $170
🎯 $190
🎯 $210
🎯 $234+
The $234–235 area is particularly interesting because it lines up with the projected resistance/target zone on the chart.
⚠️ Bearish scenario
If price gets rejected around $129–$134 and loses the recent support structure, the setup could fail.
A sustained move back below the lower support area would weaken the bullish thesis significantly, with ~$97 acting as the major invalidation zone shown on the chart.
👀 The key level
$134 is the level I’m watching.
A clean breakout + retest above this area could completely change the structure from recovery → potential new uptrend.
Not financial advice. Always manage risk and do your own research.
#NOW #ServiceNow #StockMarket #Stocks #TechnicalAnalysis #Trading #Breakout #Bullish #Investing