


I have 7 day's left on the essentials plan. I might be enticed to come back during the holiday - year end sale. I dislike the ad's but freemium features is all I need to post idea's (private)
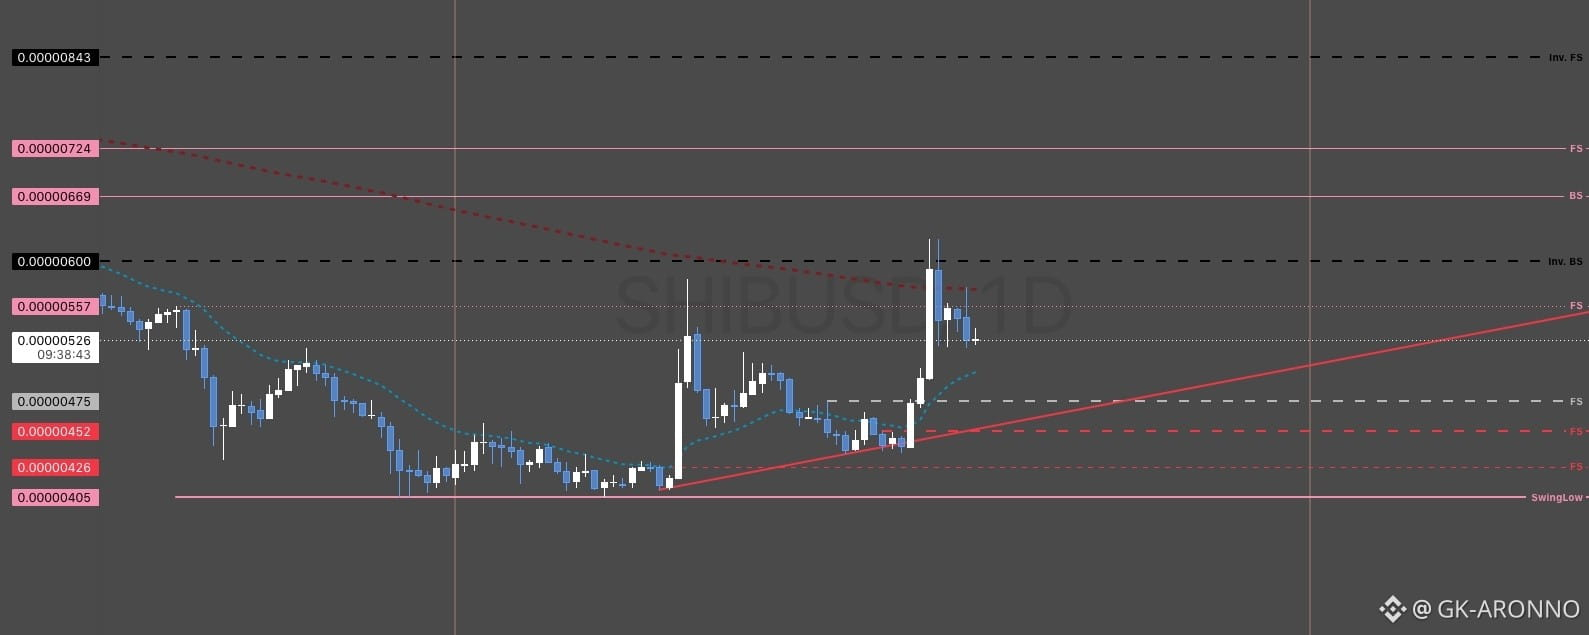
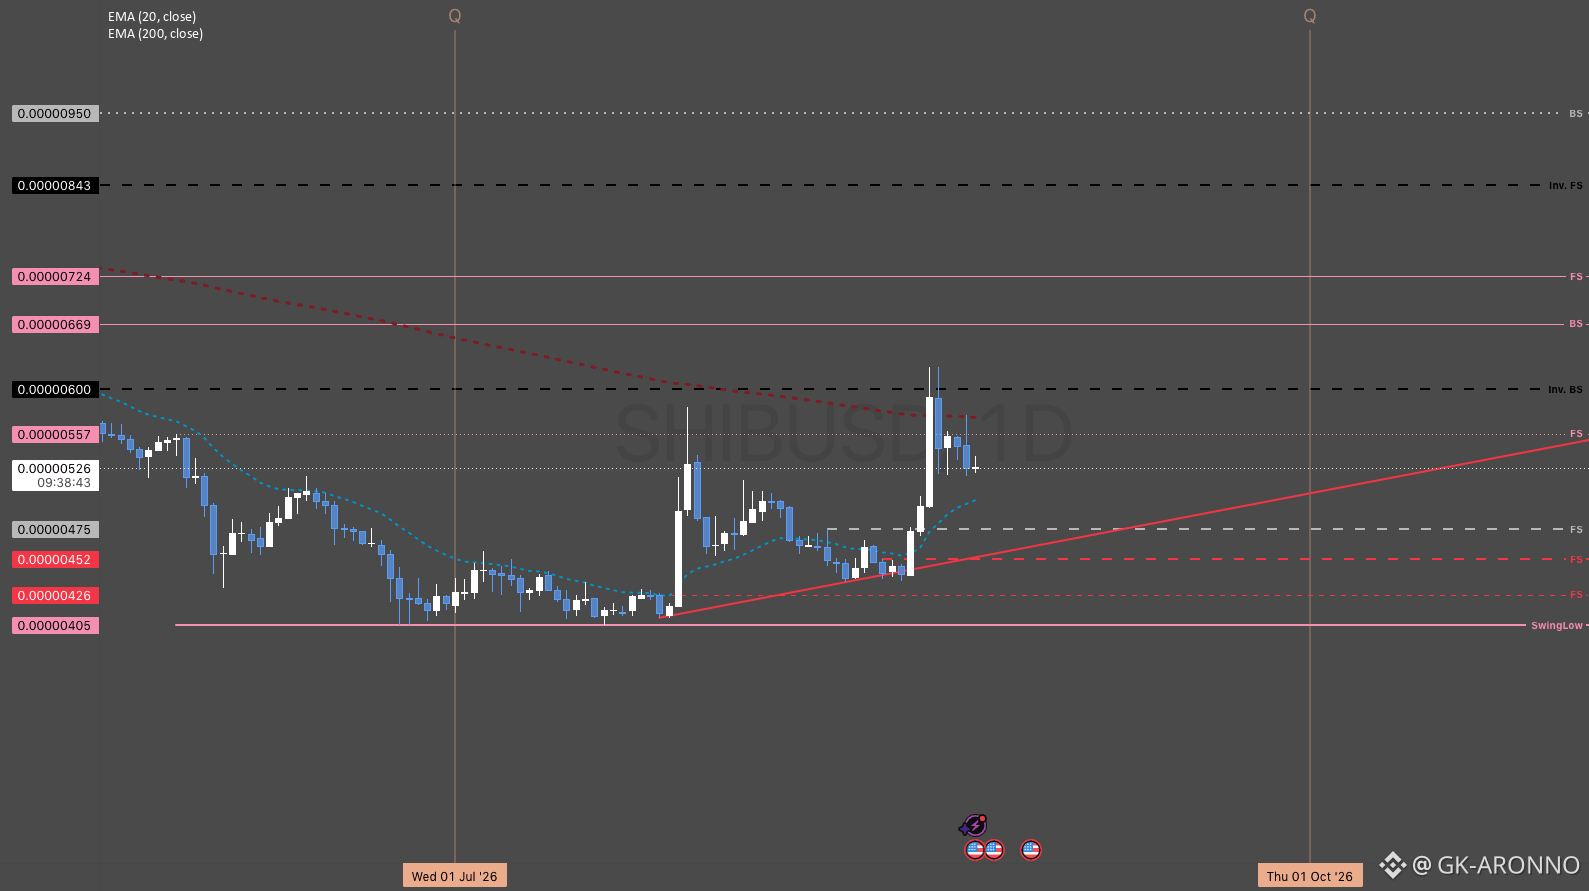
Anyways, here is SHIB with 3.12Billion Dollar marketcap.
Who's buying this stuff?? (*buy's $10) Its an SEC Digital Asset Commodity. Its being used as a commodity?? IDK but this is what price action says.
The Shiba Inu started Q3 off at a bunch of .0's405, June's SwingLow created 26 June. Bulls pushed price above distribution ranges and used them as support rungs to ladder up and test the yearly level in black. The next rungs of the support ladder are a weekly level in grey, and a daily level in red. Both are FrontSide levels which carry an expectation to create a low angle accumulation trend until the resistance level or trend can break.
looks like price action is forming a breakout with the yearly level in black at 0.0's600. Let's see.
-----------------------------------
Multiple Time-Frame Analysis; Color Code | Strength favors the higher timeframe.
Yearly timeframe = black
Monthly timeframe = pink
weekly = grey
daily = red
4hr = orange
1hr = yellow
15min = blue
5min = green if they are shown. (Level visibility on intervals is set to timeframe the level was found on and below to keep chart view organized.)
** Candle Science explained
A Range = two or more consecutive color candles.
There are two types of ranges - accumulation and distribution. A single candle is a range on a lower timeframe. *Find the range and define its, creation dates, prices, and risk parameters. A range is broken down into 4 candle, which create 6 levels that define the range and illustrate market structure.
Focus only on the first and last candle of each range. The last candle of each type of range has two levels - see FS & Inv. FS Candles below.
DISTRIBUTION RANGES DEFINED:
When price is above a distribution range, these candles/levels act as support.
(BS) BACKSIDE Candle - First distribution candle in a distribution range. Expectation = strong reaction to price. long wicks reaching to or away from level. high angle accumulation trends, f.v,g's
(FS) FrontSide Candle - Last distribution candle in a distribution range. Expectation = reversal, create a low angle accumulation trend. The top of Distribution candles are used as support. The bottom of the FrontSide candle is the SwingLow of the range. The FS candle wants to protect the SwingLow. When/if Price Action closes below the SwingLow, the level is invalidated. Find another range to trade.
ACCUMULATION RANGES DEFINED: When price is below an accumulation range, these candles/levels act as resistance.
INVERSE BACKSIDE (Inv.BS) - First Accumulation candle in an accumulation range. Expectation. = strong reaction to price. long wicks reaching to or away from level. Creates high angle distribution trends, f.v.g, protects the Inv.FS candle
INVERSE FRONTSIDE (Inv.FS) - Last accumulation candle in an accumulation range. Expectation = reversal, create a low angle distribution trend. The bottom of Accumulation candles are used as resistance.
The top of the Inv.FrontSide candle is the SwingHigh of the range. The Inv.FS candle wants to protect the SwingHigh. When/if Price Action closes above the SwingHigh, the level is invalidated. Find another range to trade.
