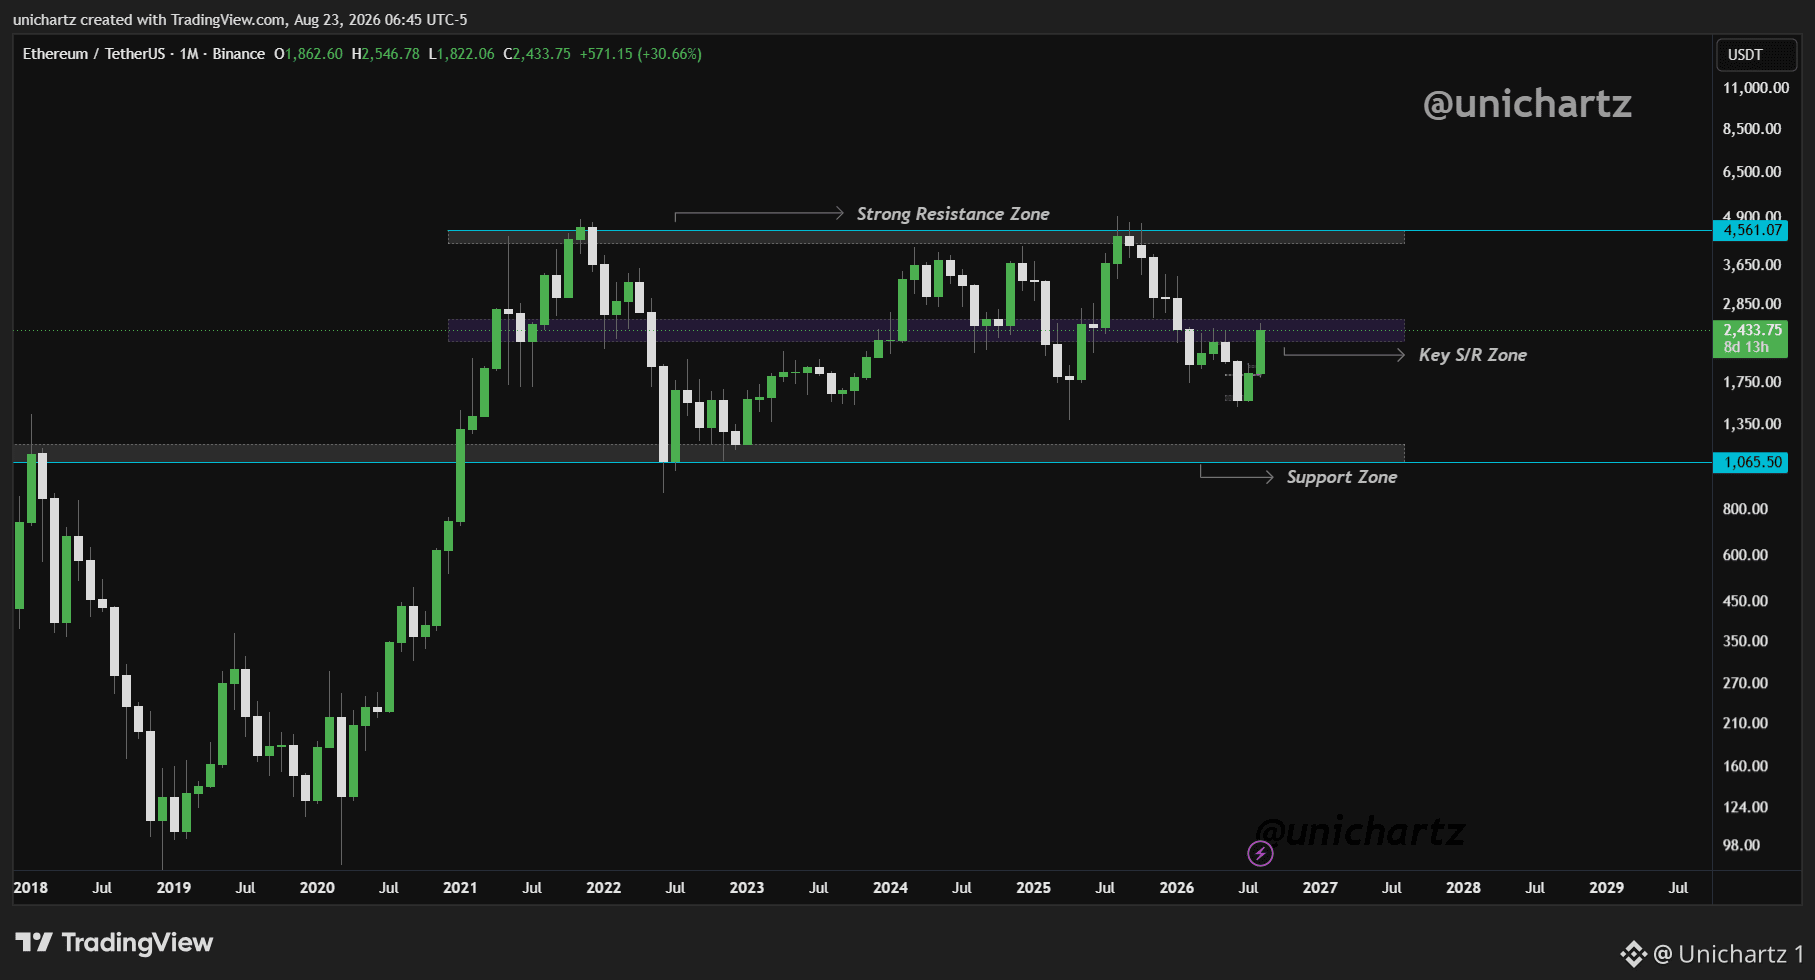
$ETH Monthly Outlook
This chart tells the entire Ethereum story in one image, and right now it's at one of the most important moments since 2020.
After bleeding from the $4,800 highs all the way down to $1,822 earlier this month, ETH has aggressively bounced +30.67% this month alone and is currently sitting at $2,433, right inside the Key S/R Zone that has been the most contested area on this chart for years.
This purple zone has acted as both major support and resistance multiple times since 2021. Price is fighting for it right now in real time.
What this monthly candle is saying:
The wick down to $1,822 followed by a strong recovery suggests the market rejected those lows aggressively. That's a positive sign. But monthly candle isn't closed yet, the close is everything here.
Hold and close above the Key S/R Zone = recovery toward $3,500+ becomes realistic. Fail here and roll back below it = $1,800 retests become possible again.
DYOR, NFA
#ETH #BTC Price Analysis# #Altcoin Season# #BNBChain# $BTC
This chart tells the entire Ethereum story in one image, and right now it's at one of the most important moments since 2020.
After bleeding from the $4,800 highs all the way down to $1,822 earlier this month, ETH has aggressively bounced +30.67% this month alone and is currently sitting at $2,433, right inside the Key S/R Zone that has been the most contested area on this chart for years.
This purple zone has acted as both major support and resistance multiple times since 2021. Price is fighting for it right now in real time.
What this monthly candle is saying:
The wick down to $1,822 followed by a strong recovery suggests the market rejected those lows aggressively. That's a positive sign. But monthly candle isn't closed yet, the close is everything here.
Hold and close above the Key S/R Zone = recovery toward $3,500+ becomes realistic. Fail here and roll back below it = $1,800 retests become possible again.
DYOR, NFA
#ETH #BTC Price Analysis# #Altcoin Season# #BNBChain# $BTC