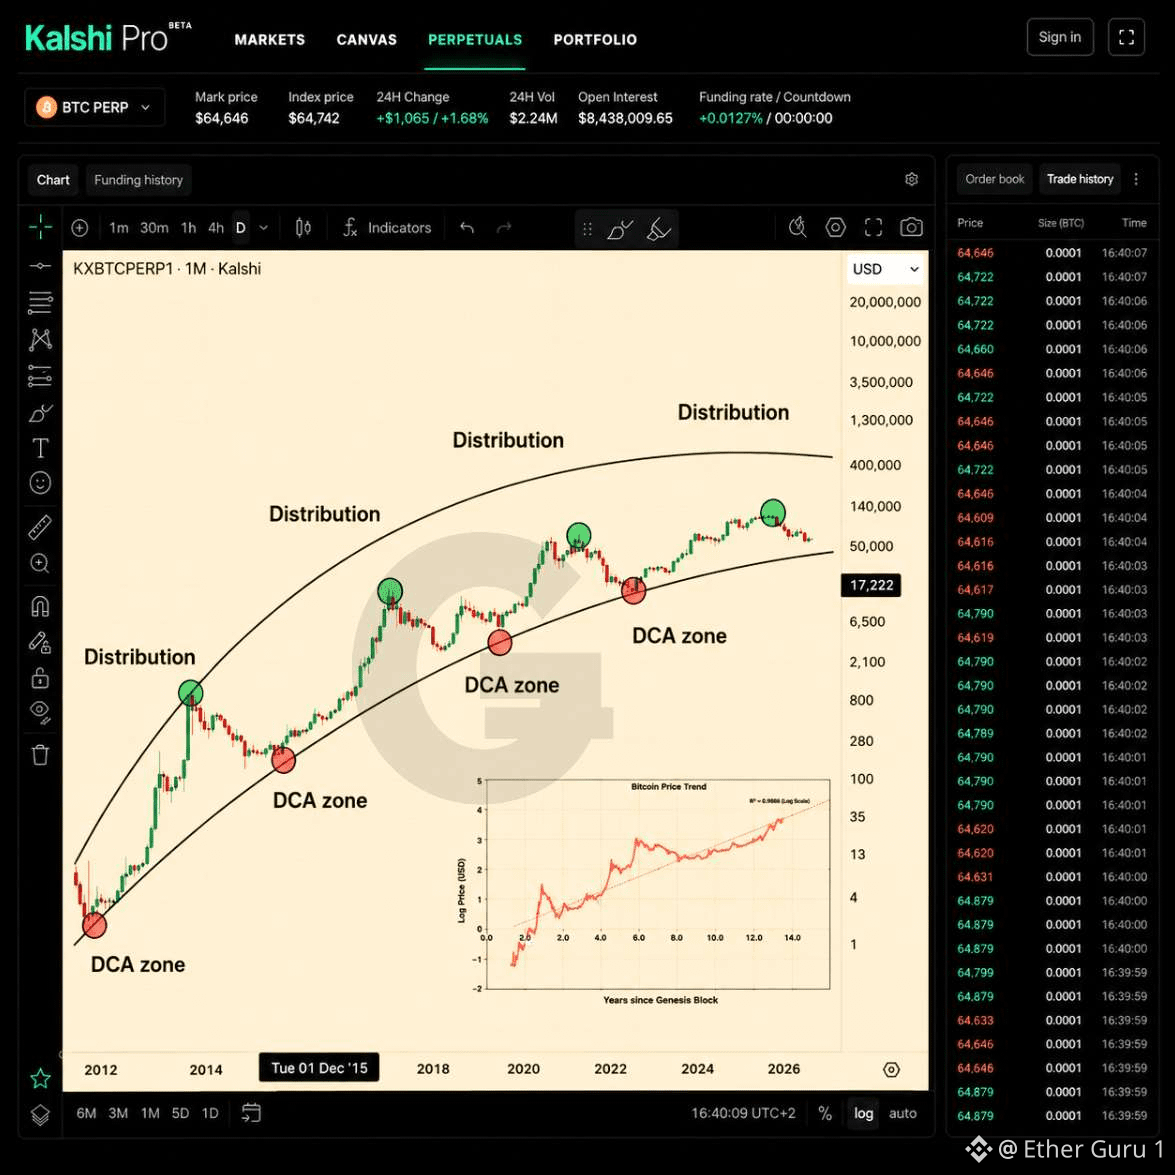
$BTC 🚨 CADA CAÍDA HA DEJADO UN PISO MÁS ALTO
Bitcoin ha experimentado reiteradamente brutales retrocesos, pero los ciclos posteriores establecieron pisos de precio drásticamente más altos.
2010 → ~$0,10
2011 → ~$1
2013 → ~$50
2015 → ~$200
2018 → ~$3.000
2022 → ~$15.000
2024 → ~$39.000
2026 → ~$60.000
La progresión es impactante.
De $0,10 → $60K representa un aumento de aproximadamente 600.000×.
Incluso el movimiento desde el mínimo de 2022 de ~$15K hasta $60K representa aproximadamente 4×.
Eso no significa que cada futura caída deba producir un piso más alto.
Bitcoin aún puede experimentar una volatilidad severa, largos mercados bajistas y correcciones más profundas de lo esperado.
Pero la historia del precio a largo plazo muestra una característica recurrente:
El precio del “desastre” de ayer se ha convertido repetidamente en el punto de referencia histórico de mañana.
La pregunta más interesante no es si ocurre otra caída.
Es si el próximo ciclo importante eventualmente establece otro piso que haga que $60K se vea tan lejano como $15K se ve hoy.
Bitcoin ha experimentado reiteradamente brutales retrocesos, pero los ciclos posteriores establecieron pisos de precio drásticamente más altos.
2010 → ~$0,10
2011 → ~$1
2013 → ~$50
2015 → ~$200
2018 → ~$3.000
2022 → ~$15.000
2024 → ~$39.000
2026 → ~$60.000
La progresión es impactante.
De $0,10 → $60K representa un aumento de aproximadamente 600.000×.
Incluso el movimiento desde el mínimo de 2022 de ~$15K hasta $60K representa aproximadamente 4×.
Eso no significa que cada futura caída deba producir un piso más alto.
Bitcoin aún puede experimentar una volatilidad severa, largos mercados bajistas y correcciones más profundas de lo esperado.
Pero la historia del precio a largo plazo muestra una característica recurrente:
El precio del “desastre” de ayer se ha convertido repetidamente en el punto de referencia histórico de mañana.
La pregunta más interesante no es si ocurre otra caída.
Es si el próximo ciclo importante eventualmente establece otro piso que haga que $60K se vea tan lejano como $15K se ve hoy.