
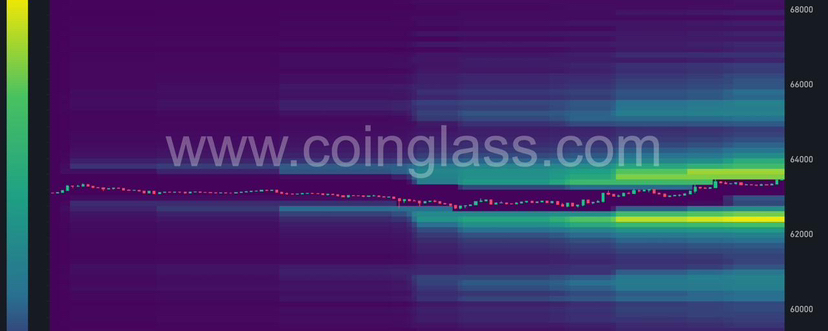

Bitcoin Liquidation Heatmap Update
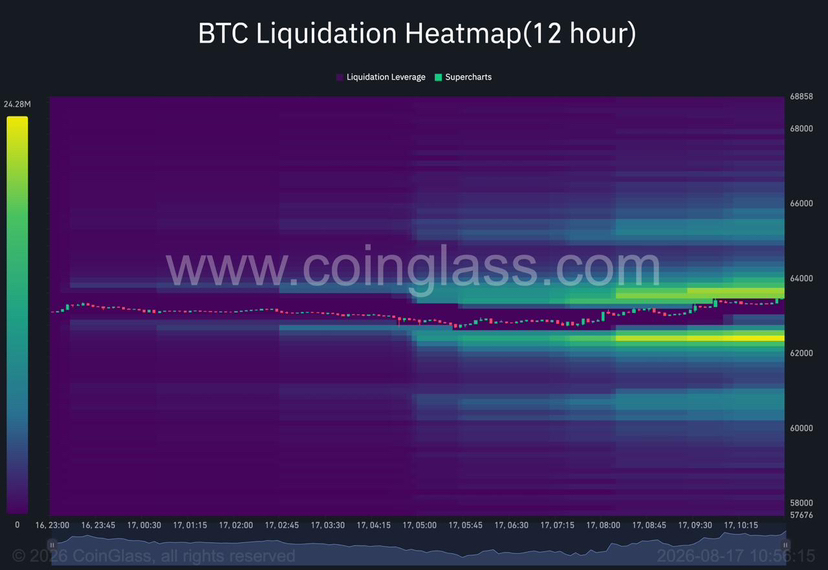
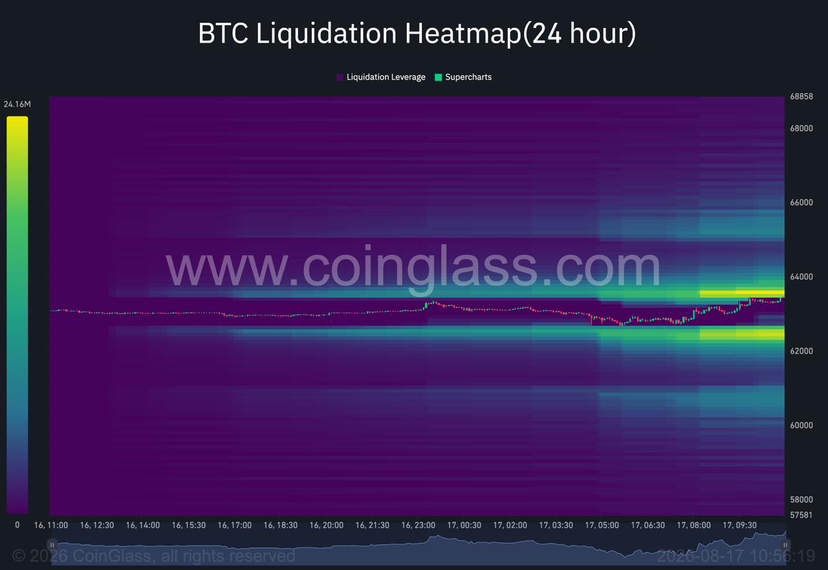
Bitcoin is moving back towards the largest nearby liquidation cluster after spending most of the session consolidating around $63K–$63.5K.
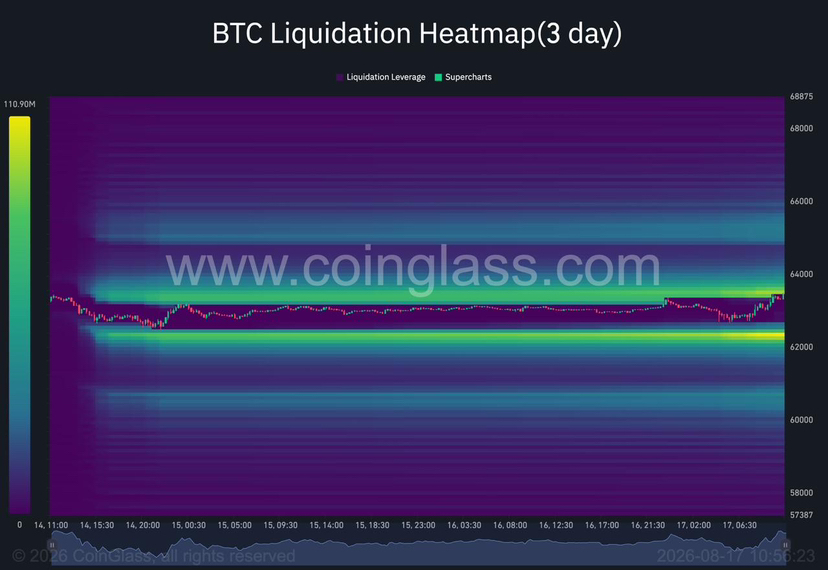
Across the 12H, 24H and 3D heatmaps, the same key zones continue to stand out.
The liquidity structure is becoming increasingly concentrated around the current range.
$63.8K–$64K: Immediate upside liquidity
The strongest nearby liquidity sits just above spot, around $63.8K–$64K.
This zone has strengthened across the shorter-term heatmaps as BTC has pushed higher.
That makes it the first major area to watch.
If BTC moves into this region, the concentration of liquidation liquidity could accelerate the move as positions are forced to close.
A clean sweep through the cluster would put the next upside liquidity around $65K–$65.5K into focus.
$62.2K–$62.6K: Key downside liquidity
There is also a significant concentration of liquidity immediately below the market.
The $62.2K–$62.6K region remains clearly visible across the 12H, 24H and 3D maps.
This is important because BTC has repeatedly consolidated above this area.
A move into the zone could therefore trigger a meaningful flush of leveraged longs.
If that liquidity is swept and BTC quickly reclaims the area, it would create a potentially strong setup for a reversal back towards the upside liquidity.
If BTC loses it decisively, the next major liquidity pocket sits closer to $60.5K–$61K.
The larger 3D picture
The 3D heatmap gives us the clearest view of the broader positioning.
There is substantial liquidity stacked on both sides of the current price rather than one overwhelmingly dominant pocket.
Above:
$63.8K–$64K
$65K–$65.5K
$66K+
Below:
$62.2K–$62.6K
$60.5K–$61K
This creates a relatively defined liquidity range.
The market does not need to break out immediately.
It can continue moving between these pools while leverage gets repositioned.
What we are watching
The most important question is which liquidity pocket gets taken first.
A push into $63.8K–$64K would test the overhead liquidation cluster and could produce a squeeze higher if BTC moves through it with momentum.
A rejection followed by a move below $63K would shift attention towards the $62.2K–$62.6K long-liquidation pocket.
That would be the key downside test.
The important distinction is that a liquidation cluster is a zone of potential forced positioning, not a guaranteed price target.
We are watching how BTC reacts when those levels are reached.
CHR TAKEAWAY
The heatmaps are giving us a very clean setup.
BTC is sitting between two major liquidity pools:
$63.8K–$64K above
$62.2K–$62.6K below
The nearest liquidity sits on both sides, meaning volatility could increase quickly once BTC starts moving away from the current consolidation.
For now, the bias is not about predicting which side gets taken.
It is about waiting for the liquidity sweep and then watching the reaction.
Reclaim after a sweep = strength.
Breakdown after a sweep = continuation risk.
Until then, BTC remains trapped between two major pools of leveraged positioning.