


Riot Platforms Stock rejected a $9.1 billion AI infrastructure deal on 11 August. After opening at $23.57, the shares gave back a 17% after-hours surge to close at $20.24. The distribution on 76 million shares signals positioning risk rather than narrative failure.
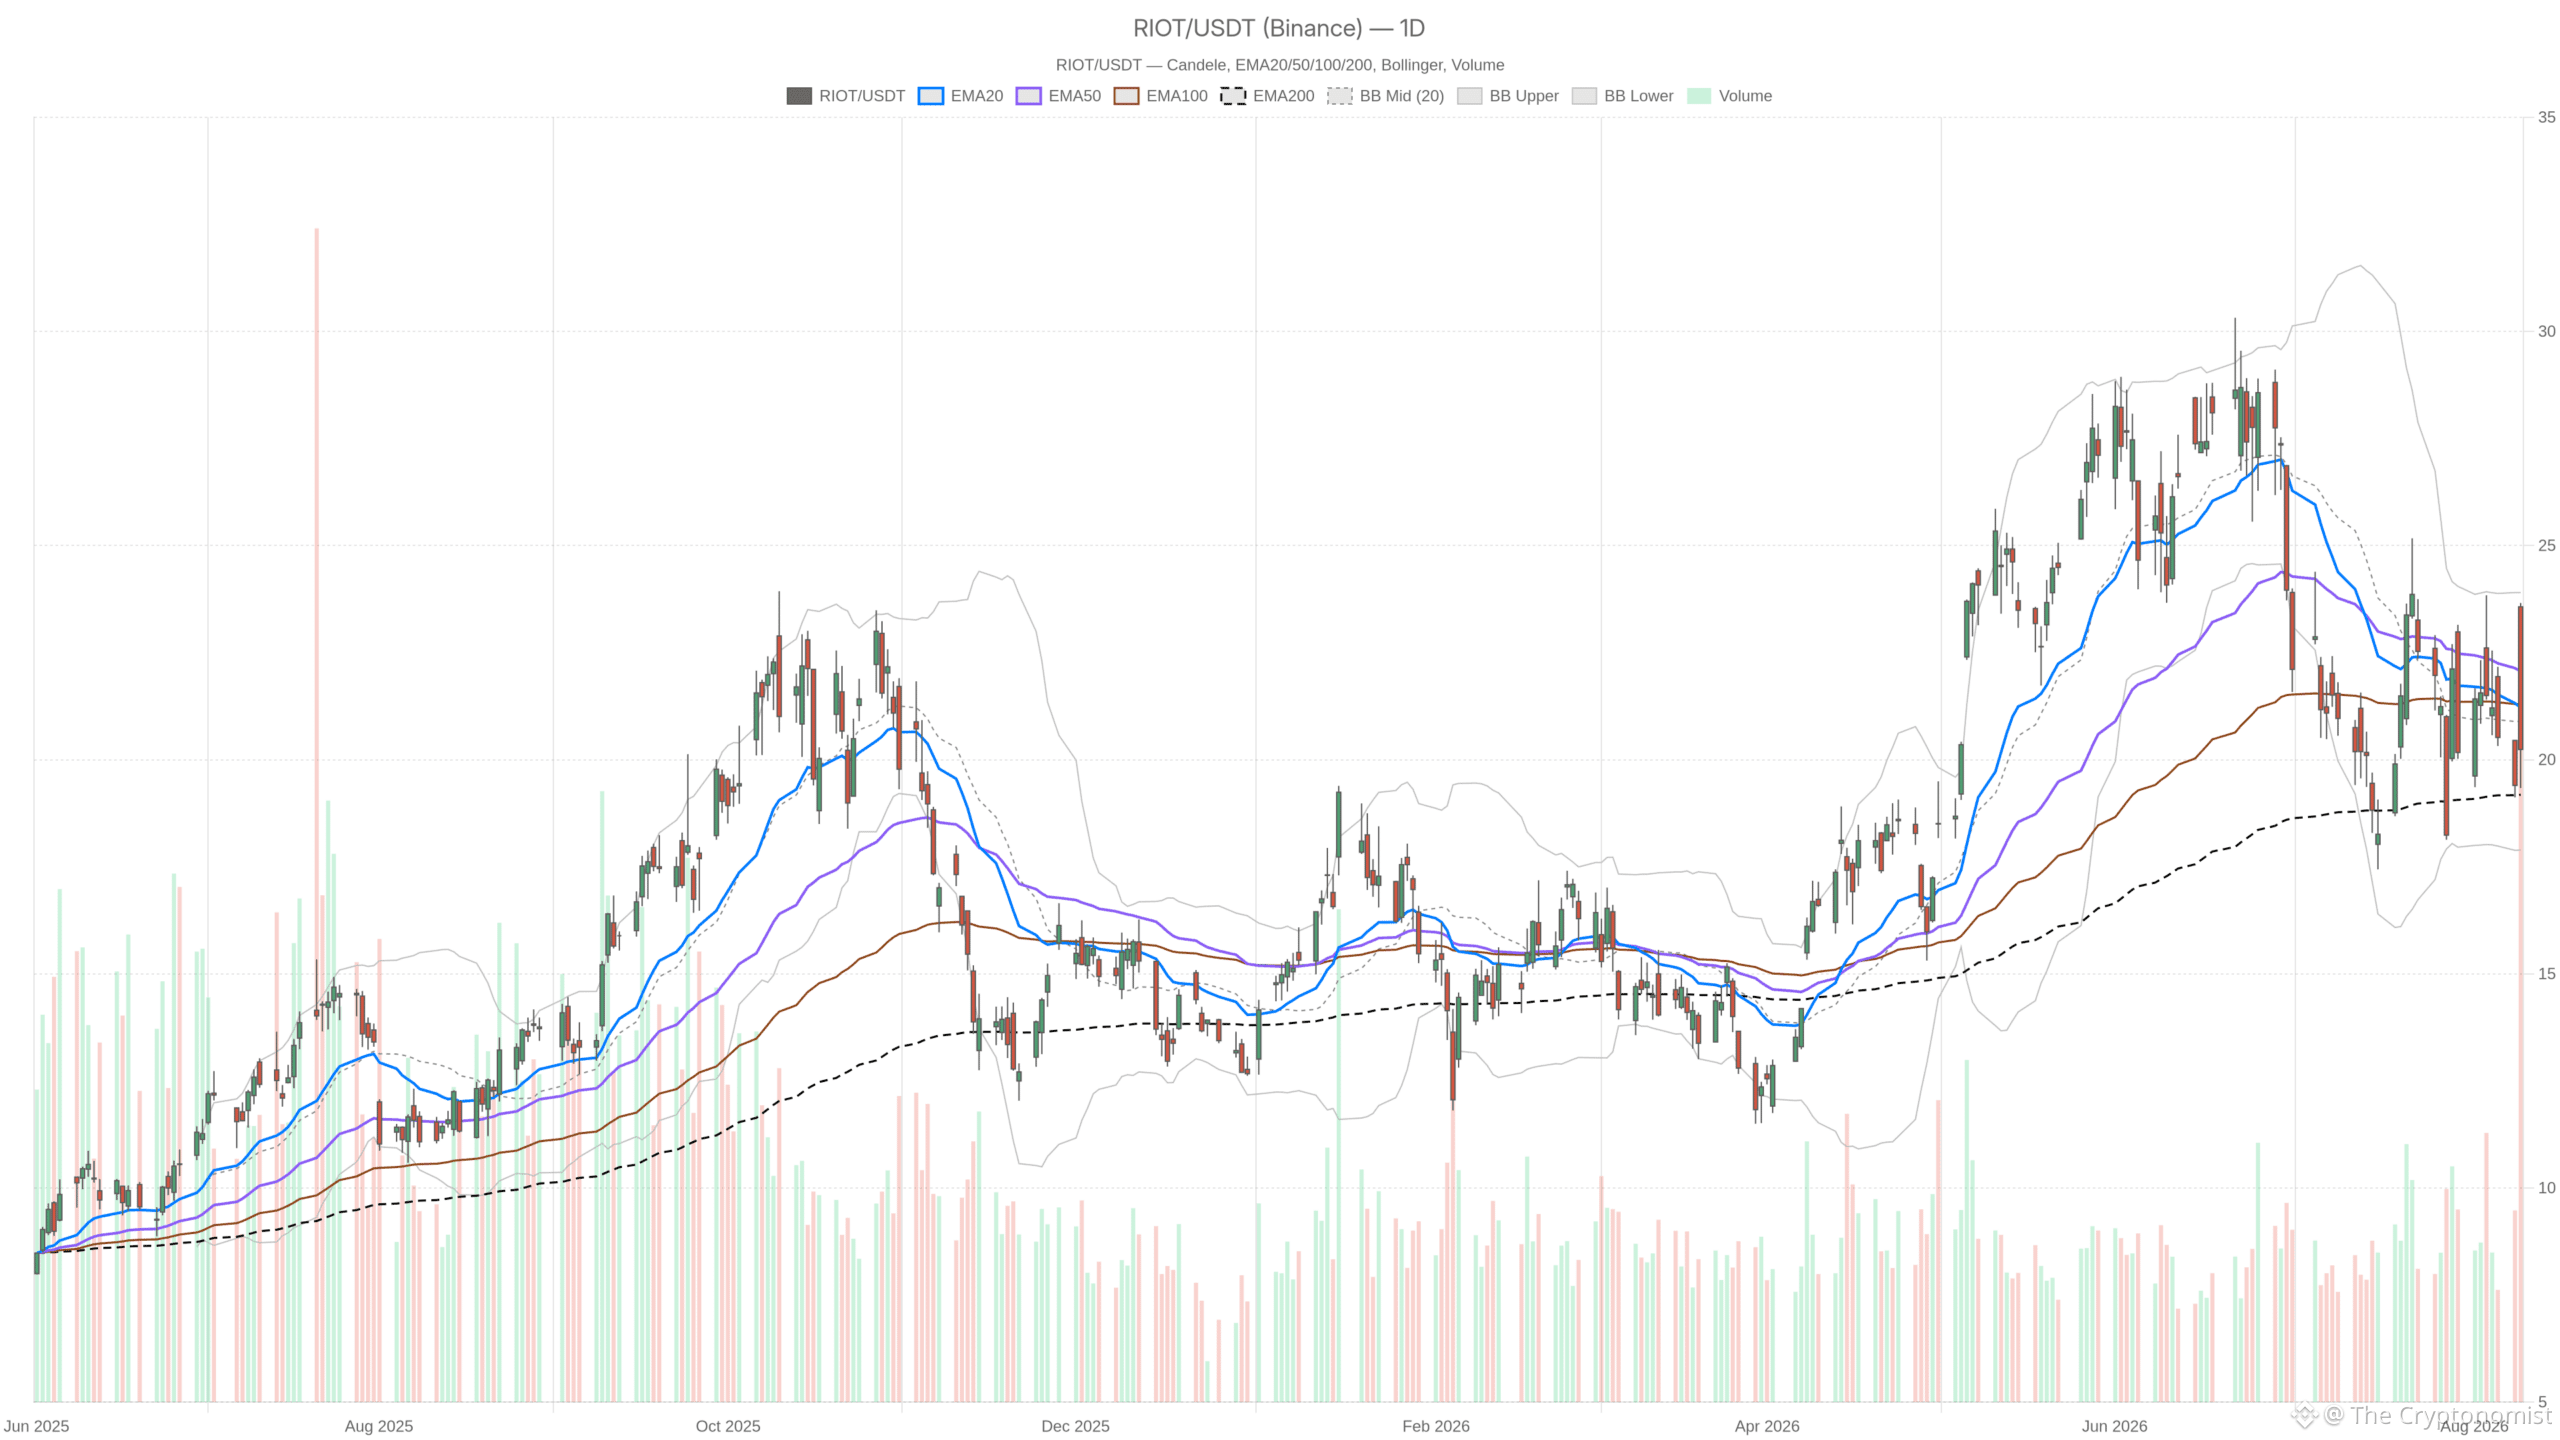 RIOT — daily chart with candlesticks, EMA20/EMA50 and volume.
Key takeaways
Riot Platforms Stock closed at $20.24 on 11 August, surrendering a 17% after-hours surge tied to a $9.1 billion Anthropic lease deal.
Daily RSI sits at 45.09 and MACD histogram is marginally positive at +0.02, confirming a neutral regime rather than a confirmed reversal.
The 200-day EMA at $19.18 is the critical line separating a violent shakeout from a genuine trend change.
Hourly averages remain bearish with price below the 50-period EMA at $20.70 and the 200-period at $21.78.
The $21.08 daily pivot and the $20.41–$20.73 resistance zone define the near-term battle between bulls and bears.
Why the Daily Chart Keeps Riot Platforms Stock in a Neutral Regime
Riot Platforms Stock remains in a neutral daily regime. Price held above the 200-day EMA at $19.18 while closing below its shorter-term moving averages.
The structural picture is not broken. The 200-day EMA sits at $19.18, and Tuesday’s low of $19.34 held just above it. That line separates a violent shakeout from a genuine trend change. Above it, the daily regime stays neutral rather than bearish. Price is pinned between falling short-term averages and a rising long-term one.
Momentum echoes that indecision. The daily RSI at 45.09 sits just under the midpoint — soft, but nowhere near oversold. MACD remains negative at -0.72 against a -0.75 signal. Yet the histogram has flipped marginally positive at +0.02. In practice, downside momentum is decelerating without evidence of a completed bullish turn.
Volatility, meanwhile, is the dominant variable. Daily ATR at 2.40 is roughly 12% of the closing price. Bollinger Bands span $17.89 to $23.90. The 11 August range alone covered 4.32 points. Anyone framing levels here must accept an important reality. A single session can travel from the pivot to either band without changing the underlying structure.
Notably, the pivot map is clean. $21.08 acts as the fulcrum. $22.82 serves as first resistance. $18.50 marks first support. Crucially, $22.82 sits inside the gap-fade zone from Tuesday’s failed breakout. That makes it a natural supply shelf rather than a simple number.
Fundamentals cut both ways
Fundamentals present conflicting narratives for Riot Platforms Stock. Strong AI infrastructure potential is offset by ongoing operational losses and execution uncertainty.
Currently, the tape is arbitrating two conflicting stories. Q2 2026 revenue reached $174.24 million, yet the company posted a net loss of $237.17 million. That includes roughly $27.97 million of impairment charges. On the positive side, Bitcoin production rose to 1,587 coins. On the other, a 20-year contract worth $9.1 billion repositions the company as an AI infrastructure landlord.
However, the subsequent 6.1% decline tells a clear story. The market is discounting execution and dilution risk before it pays for future cash flow.
The 1H Chart Complicates the Bullish Case for Riot Platforms Stock
The 1H chart keeps Riot Platforms Stock under bearish pressure. Price remains trapped below its 50-period and 200-period EMAs despite early signs of stabilisation.
Notably, hourly structure confirms the daily caution rather than contradicting it. The 1H close of $20.23 sits fractionally above the 20-period EMA at $20.17. Still, it remains well below the 50-period at $20.70 and the 200-period at $21.78. That average stack is still bearish. Until $20.70 is reclaimed and held, rallies remain corrective in character.
At the same time, there are signs of stabilisation. Hourly RSI has recovered to 48.72. The MACD histogram is positive at +0.09. The line at -0.32 is improving toward its -0.41 signal. Price is also holding above the 1H Bollinger midline at $20.05. In short, sellers have stopped pressing, but buyers have not yet taken control.
Meanwhile, the hourly pivot cluster is unusually tight. Support sits at $20.07. The pivot is at $20.26. Resistance stands at $20.41. With 1H ATR at 0.77, that compression is likely to resolve quickly. Consolidation this narrow after a 4-point daily range usually precedes an expansion move, not a drift.
15m: Execution Context for Riot Platforms Stock
The 15-minute chart provides short-term execution context for Riot Platforms Stock. It shows the most constructive tone across all three timeframes.
On the 15-minute chart, short-term tone is the most constructive of the three. RSI at 57.23 is above the midline. The MACD line has crossed positive at 0.04 against -0.03. Price sits above both the 20-period EMA at $19.92 and the 50-period at $20.02. The 200-period EMA at $20.73 is the immediate ceiling, and it aligns closely with hourly resistance.
However, this is timing information, not thesis information. Intraday ATR of 0.28 and Bollinger bands between $19.27 and $20.49 define a narrow operating box. The 15m upper band at $20.49 and the 1H R1 at $20.41 form the same barrier from two angles.
Bullish Scenario for Riot Platforms Stock
Riot Platforms Stock turns constructive if price defends $20.07 on pullbacks and reclaims $20.73. This would open a path toward the 20-day EMA at $21.22.
Therefore, the constructive path starts with defending $20.07 and $19.88 on pullbacks. Acceptance above $20.73 would neutralise the hourly downtrend. It would also put the daily pivot at $21.08 back in play. A close above $21.22 — the 20-day EMA — would be the first real evidence that the Anthropic lease is being repriced upward rather than sold.
From there, $22.06 and the $22.82 pivot resistance become the measured objectives. The $23.90 upper daily band caps the extension. A rising daily MACD histogram and RSI pushing back above 50 would support that sequence.
Bearish Scenario for Riot Platforms Stock
Riot Platforms Stock turns bearish if price fails at the $20.41–$20.73 resistance zone. This would confirm Tuesday’s rejection as genuine distribution.
In contrast, failure at $20.41–$20.73 would confirm Tuesday’s rejection as genuine distribution. A loss of the 1H midline at $20.05 followed by a break of $19.88 would expose $19.34 quickly. Below that, the 200-day EMA at $19.18 becomes the decisive test.
A daily close beneath it would flip the regime from neutral to outright bearish. It would open the S1 pivot at $18.50, with the lower daily band at $17.89 as the extension target. The bullish case is invalidated on any sustained trade below $19.18, regardless of headlines.
Overall, this is a mixed-signal chart and it should be treated as one. The daily trend is neutral, the hourly averages remain bearish, and the 15-minute picture is mildly positive. This is a classic sign of a market still digesting new information. Macro adds another layer, with elevated oil prices tied to the Strait of Hormuz and upcoming US inflation data shaping rate expectations. With daily ATR near 2.40, position sizing matters more than direction here. The zone between $19.18 and $21.22 defines the argument. Whoever wins it sets the next trend in Riot Platforms Stock.
FAQ
What caused Riot Platforms Stock to drop despite the Anthropic deal announcement?
Riot Platforms Stock opened at $23.57 after announcing a $9.1 billion, 20-year data center lease with Anthropic for 191 megawatts at its Rockdale, Texas site. Despite the transformative headline, price unwound the entire move to close at $20.24 on 76.06 million shares. The market appears to be discounting execution and dilution risk ahead of future cash flows from the AI infrastructure pivot.
What is the most important technical level for Riot Platforms Stock right now?
The 200-day EMA at $19.18 is the line separating a violent shakeout from a genuine trend change. A daily close below it would flip the regime from neutral to outright bearish. It would then open support at $18.50, with the lower daily Bollinger band at $17.89 as the extension target.
What needs to happen for Riot Platforms Stock to turn bullish?
Price must first defend $20.07 and $19.88 on pullbacks. Acceptance above $20.73 would neutralise the hourly downtrend. A close above the 20-day EMA at $21.22 would be the first real evidence the Anthropic lease is being repriced upward. From there, $22.06 and $22.82 become the measured objectives.
What is the daily ATR and why does it matter for Riot Platforms Stock?
Daily ATR sits at 2.40, roughly 12% of the closing price. This elevated volatility means a single session can travel from the pivot to either Bollinger band without changing the underlying structure. Position sizing matters more than direction in this environment.
Disclaimer: This article is for informational purposes only and does not constitute financial advice, an investment recommendation, or a solicitation to buy or sell any financial instrument or cryptocurrency. The analysis provided is not indicative of future results. Investing in crypto assets and financial markets carries a high risk of capital loss. Always do your own research (DYOR) and consult a qualified financial advisor before making any decision.
Article produced with the assistance of artificial intelligence and reviewed by the editorial team.