
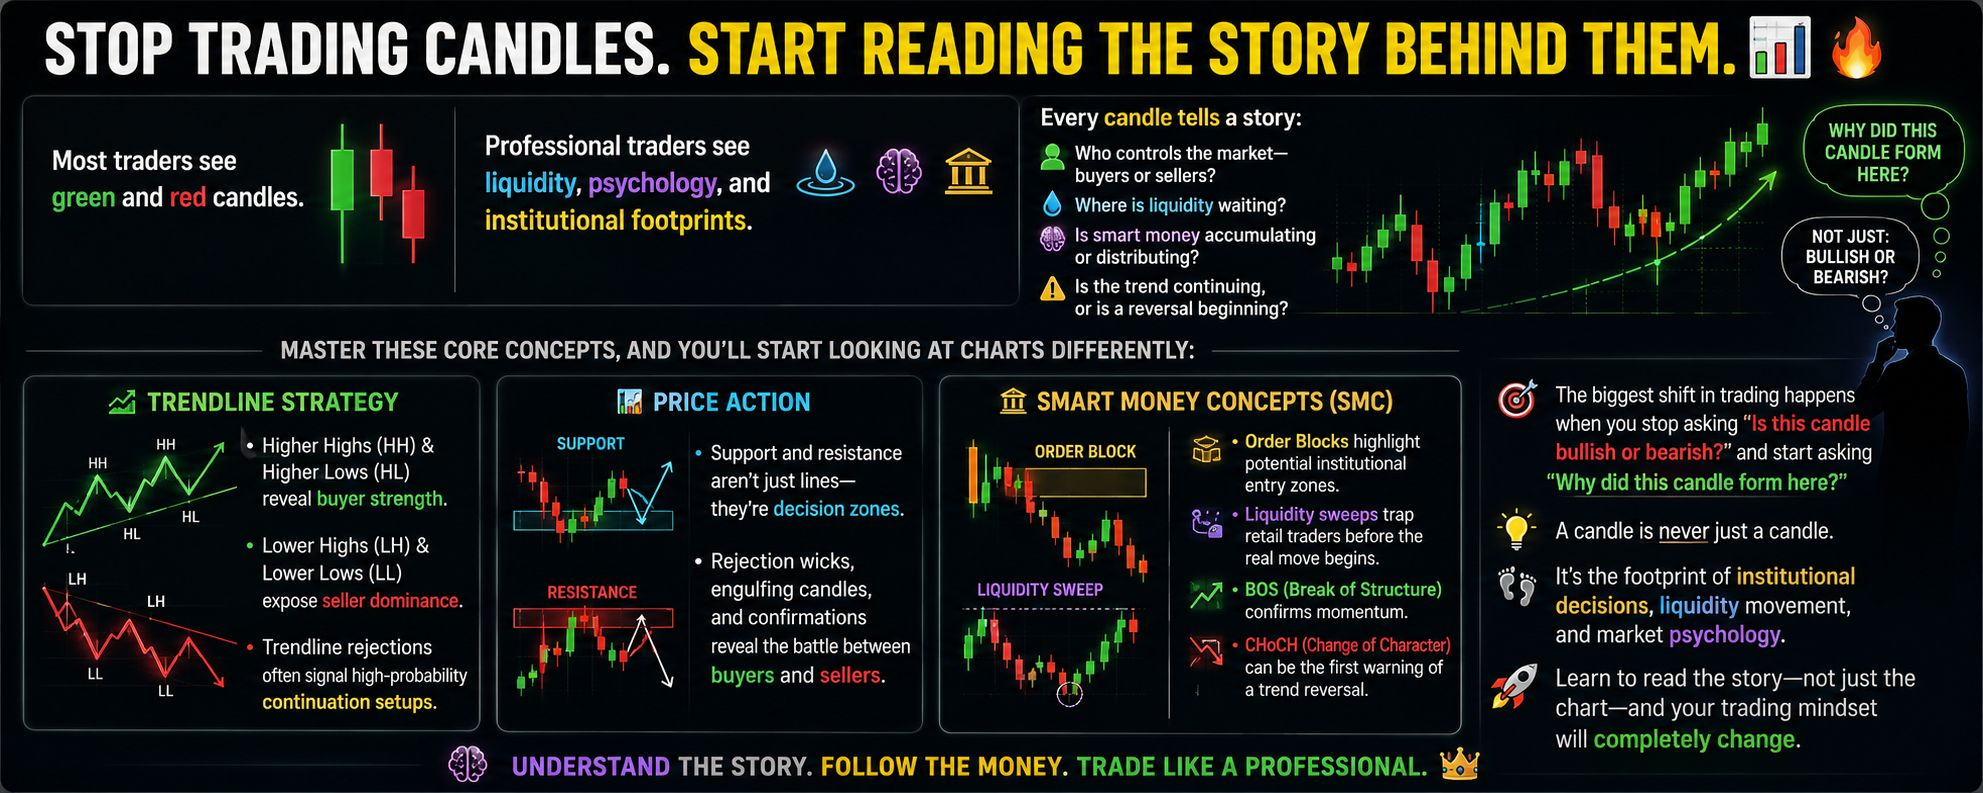

La mayoría de los traders ve velas verdes y rojas.
Los traders profesionales ven liquidez, psicología y huellas institucionales. 💡
Cada vela cuenta una historia:
🔹 ¿Quién controla el mercado: los compradores o los vendedores?
🔹 ¿Dónde espera la liquidez?
🔹 ¿El dinero inteligente se está acumulando o distribuyendo?
🔹 ¿La tendencia continúa o está empezando una reversión?
Domina estos conceptos fundamentales y empezarás a mirar los gráficos de otra manera:
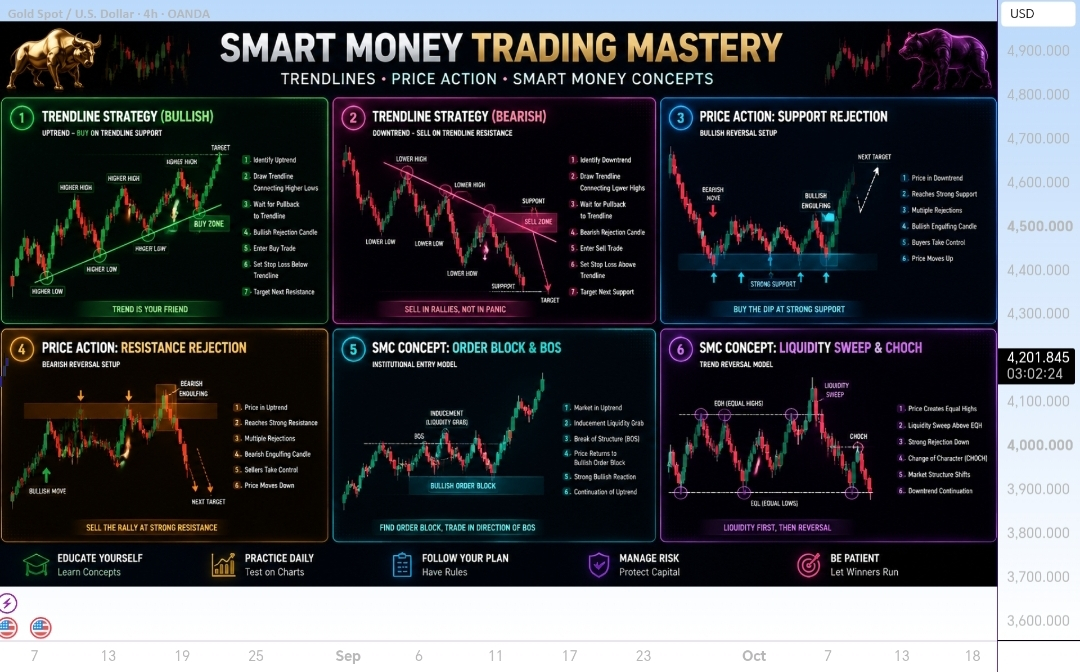
📈 Estrategia de Línea de Tendencia
• Máximos Más Altos (HH) & Mínimos Más Altos (HL) revelan la fuerza de los compradores.
• Máximos Más Bajos (LH) & Mínimos Más Bajos (LL) exponen el dominio de los vendedores.
• Los rechazos de trendline a menudo señalan configuraciones de continuación con alta probabilidad.
📊 Price Action
• El soporte y la resistencia no son solo líneas: son zonas de decisión.
• Las mechas de rechazo, las velas envolventes (engulfing) y las confirmaciones revelan la batalla entre compradores y vendedores.
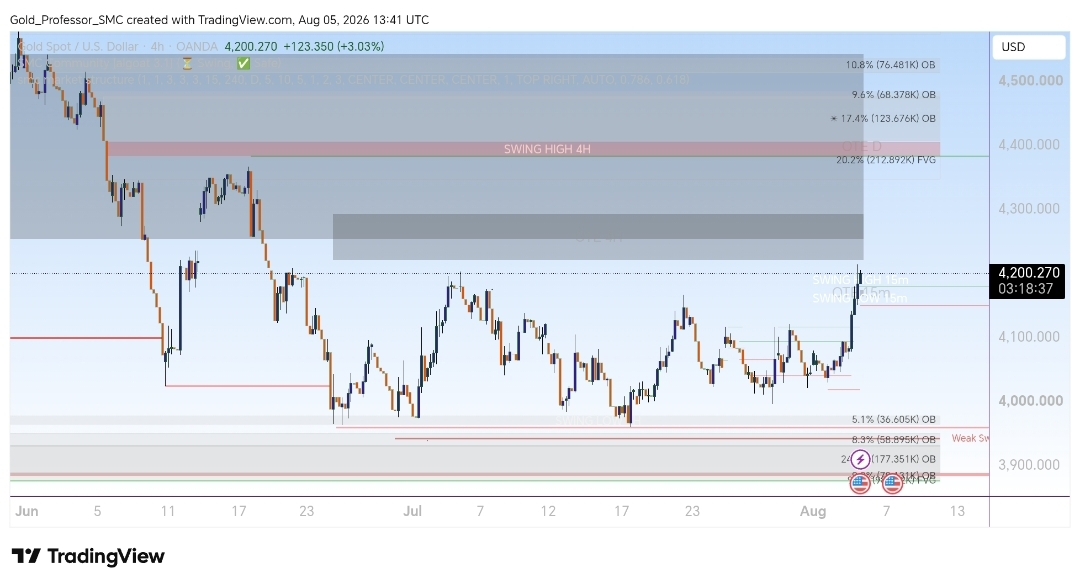
🏦 Smart Money Concepts (SMC)
• Los Order Blocks señalan posibles zonas de entrada institucional.
• Los barridos de liquidez atrapan a los traders minoristas antes de que comience el movimiento real.
• BOS (Break of Structure) confirma el impulso.
• CHoCH (Change of Character) puede ser la primera señal de una posible reversión de tendencia.
El cambio más grande en el trading ocurre cuando dejas de preguntar "¿Esta vela es alcista o bajista?" y empiezas a preguntar "¿Por qué se formó esta vela aquí?"
Una vela nunca es solo una vela.
Es la huella de las decisiones institucionales, el movimiento de la liquidez y la psicología del mercado. Aprende a leer la historia—no solo el gráfico—y tu mentalidad de trading cambiará por completo. 🚀
💬 ¿Qué concepto ha mejorado más tu trading: Price Action, Trendlines o Smart Money Concepts (SMC)? ¡Comparte tu respuesta abajo!
Si encontraste este alpha valioso, haz clic en el botón Like ❤️ y sigue 🚀 para obtener información diaria de cripto élite.


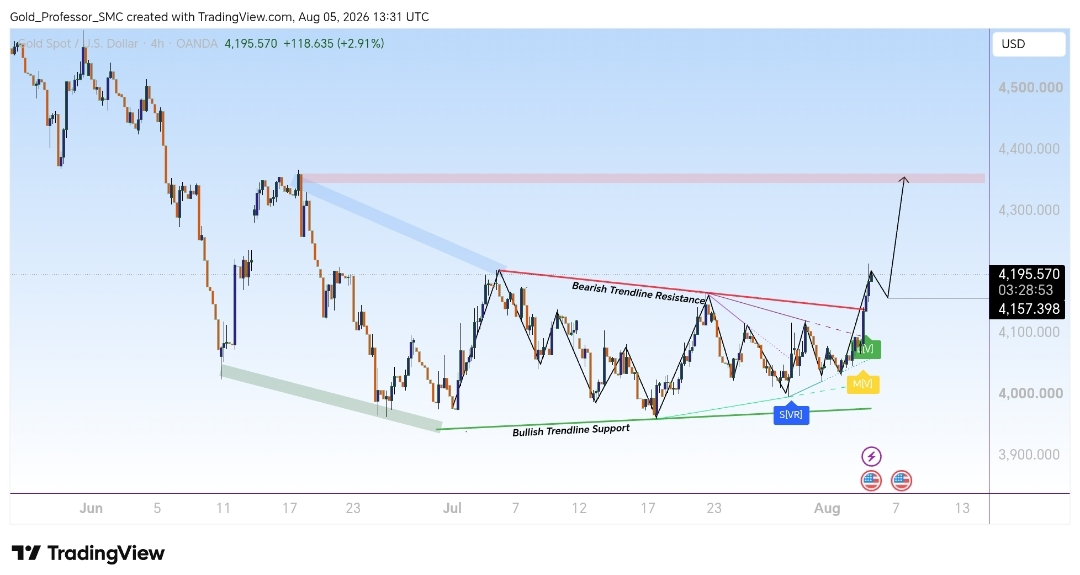
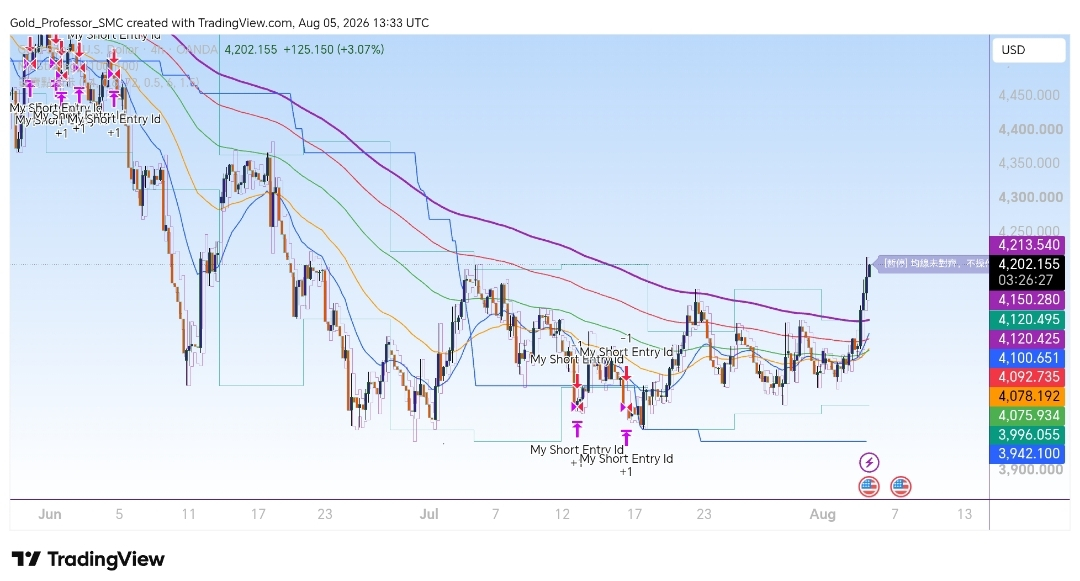
#GOLD #XAU #xaut #educational_post $HFT $ACE #GoldBreaksOutFromJanuaryDowntrend