
# El Próximo Movimiento de Bitcoin: ¿Es $70K una Trampa Alcista Antes de una Caída a $50K?
## Introducción
Bitcoin (BTC) está una vez más en un punto de inflexión crítico. Después de pasar semanas operando en un rango estrecho entre aproximadamente $62.500 y $67.000, un número creciente de observadores de gráficos advierte que cualquier rally hacia el nivel de $70.000 podría resultar una trampa en lugar de una ruptura: una que, en última instancia, haga que el precio vuelva a deslizarse hacia $50.000. Este artículo desglosa ese escenario, el razonamiento detrás de él y cómo los traders que usan plataformas como Binance pueden pensar en el riesgo si este camino se materializa.
---
## El escenario actual
A principios de agosto de 2026, BTC ha estado operando en la zona de $64,000–$64,500, manteniéndose por encima de un nivel de soporte clave cerca de $62,500 después de rebotar desde ahí múltiples veces. En el lado alcista, $67,000–$70,000 ha actuado repetidamente como resistencia: el precio se ha acercado varias veces a ese techo sin lograr una ruptura decisiva.
Este tipo de acción de precio lateral y en forma de "resorte comprimido" es exactamente el entorno donde suelen formarse las trampas alcistas: un movimiento brusco por encima de la resistencia atrae a compradores con impulso, solo para que el movimiento se revierta con fuerza cuando los participantes iniciales comienzan a tomar ganancias.
---
## El caso bajista: $64K → $70K → $57K → $50K
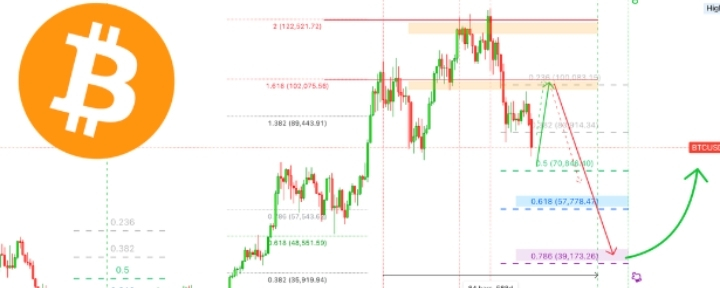
Una proyección ampliamente compartida traza una ruta específica para Bitcoin:
- **$64K** — zona actual de consolidación
- **$70K** — un empujón final más arriba que atrae a compradores tardíos (la "trampa alcista")
- **$57K** — una reversión brusca que rompe de vuelta por debajo del soporte previo
- **$50K** — el objetivo eventual a la baja
La lógica detrás de esta llamada se basa en varios patrones técnicos y psicológicos comunes:
1. **Búsqueda de liquidez** — Las bolsas y los creadores de mercado a menudo ven grandes cúmulos de liquidez del lado comprador (stop-losses y largos apalancados) situados justo por encima de niveles de resistencia como $70K. Un breve pico a través de ese nivel puede activar órdenes de compra en cascada, dándole a los grandes vendedores la oportunidad de salir con fuerza.
2. **Agotamiento después de una ruptura fallida** — Si $70K se alcanza con volumen o impulso a la baja, normalmente se interpreta como una señal de alerta más que como confirmación de fortaleza.
3. **Psicología de los números redondos** — $50,000 es un nivel psicológico importante, y los mercados a menudo se dirigen hacia números redondos así una vez que la tendencia bajista gana impulso.
4. **Advertencia de "liquidez de salida"** — El mensaje central detrás de este tipo de llamada es que los compradores minoristas que persiguen una ruptura por encima de $70K corren el riesgo de convertirse en la liquidez en la que los grandes tenedores venden, en lugar de ser participantes de una continuación de tendencia genuina.
---
## Contexto importante: esto es una predicción, no una certeza
Conviene estar con los ojos bien abiertos sobre lo que realmente es este tipo de llamada de gráfico: la interpretación de la estructura del precio de un trader o analista, no un resultado garantizado. Bitcoin ha desafiado muchas veces antes llamadas bajistas (y alcistas) hechas con mucha confianza. Algunas cosas que vale la pena sopesar:
- **Los impulsores macro importan tanto como los patrones del gráfico.** Los datos de empleo de EE. UU., las decisiones sobre tasas de la Reserva Federal y los desarrollos regulatorios (como una legislación cripto pendiente) han estado moviendo BTC en el corto plazo, y cualquiera de estos puede anular un planteamiento puramente técnico.
- **Una ruptura por encima de $70K podría ser igualmente genuina.** Un volumen sólido, el seguimiento sostenido y noticias macro favorables podrían convertir la narrativa de "trampa" en un cambio de tendencia real.
- **Las llamadas de trampa alcista son comunes en cada ciclo.** Vale la pena tomarlas en serio como uno de varios escenarios, no como el resultado por defecto.
---
## Cómo podrían abordarlo los traders en Binance
Si estás gestionando tu exposición a BTC en Binance mientras se desarrolla este escenario, se aplican algunas prácticas estándar de gestión de riesgos independientemente de en qué dirección se mueva el mercado:
- **Usa stop-losses** por debajo de niveles clave de soporte (por ejemplo, cerca de $62,500) para limitar la caída si el escenario bajista empieza a materializarse.
- **Observa el volumen en cualquier ruptura.** Un movimiento por encima de $70K con un volumen fuerte y sostenido se ve muy distinto a un pico con poco volumen que se desvanece rápidamente.
- **Evita sobreapalancarte ante una ruptura.** Las trampas alcistas castigan de manera desproporcionada a las posiciones largas apalancadas abiertas justo en la resistencia.
- **Sigue los catalizadores macro** — Nóminas no agrícolas, datos de IPC y comentarios de la Fed — ya que a menudo determinan si un nivel técnico se mantiene o se rompe.
- **Escala entradas/salidas en lugar de ir all-in en un solo precio**, lo que reduce el impacto de equivocarte sobre el máximo o el mínimo exactos.
---
## Conclusión
El escenario $64K → $70K → $57K → $50K es una narrativa técnica convincente, y la advertencia subyacente — "no te conviertas en la liquidez de salida" — es un recordatorio útil para cualquiera que persiga una ruptura sin plan. Pero sigue siendo un posible camino entre varios. Bitcoin podría igualmente romper con decisión por encima de $70K y continuar al alza si las condiciones macro se vuelven favorables. El enfoque más seguro no es apostar todo a una única ruta predicha, sino tener un plan de riesgo: niveles claros de invalidación, un dimensionamiento de posición sensato y stop-losses que funcionen tanto si la ruptura es real como si es una trampa.
####HYPEGains79%InQ2 #Bitcoin #BTC #Crypto #Cryptocurrency #BitcoinPriceUpdate #CryptoTrading #BTCUSDT #Binance #BullTrap #BitcoinAnalysis #TechnicalAnalysis #CryptoMarket #BitcoinCrash #CryptoTrader #DYOR #CryptoWarning #BitcoinPrediction #ExitLiquidity #CryptoUpdate