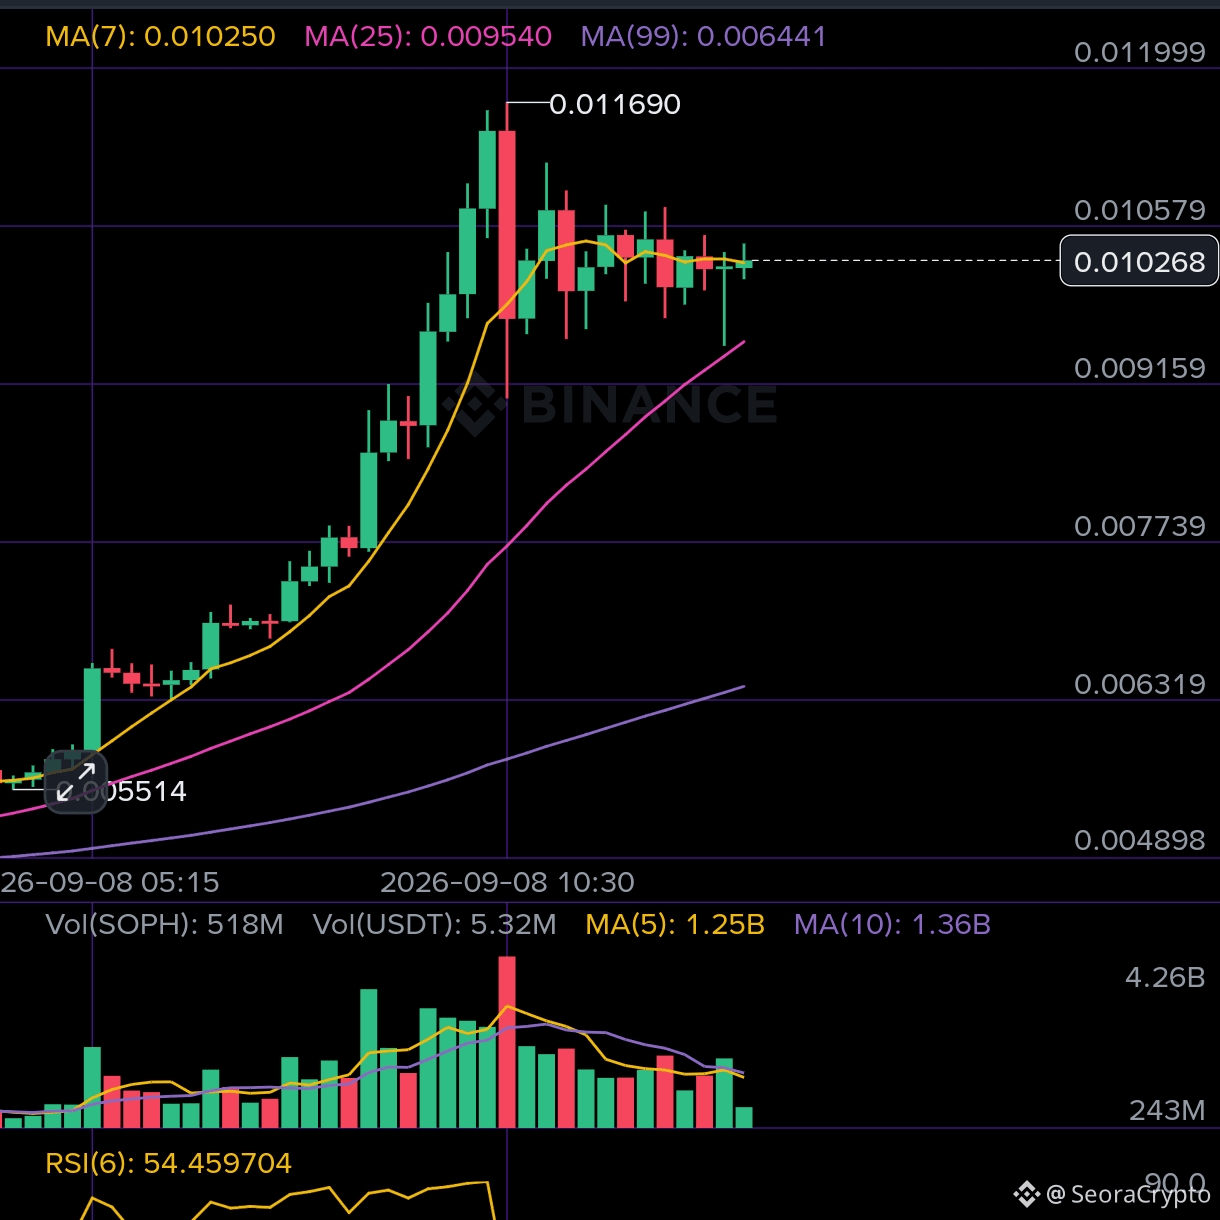
Título: 🚀 SNDKB Apretando cerca de máximos históricos: ¿Listo para la próxima expansión? 📈
La Configuración (LONG
$SNDKB ):
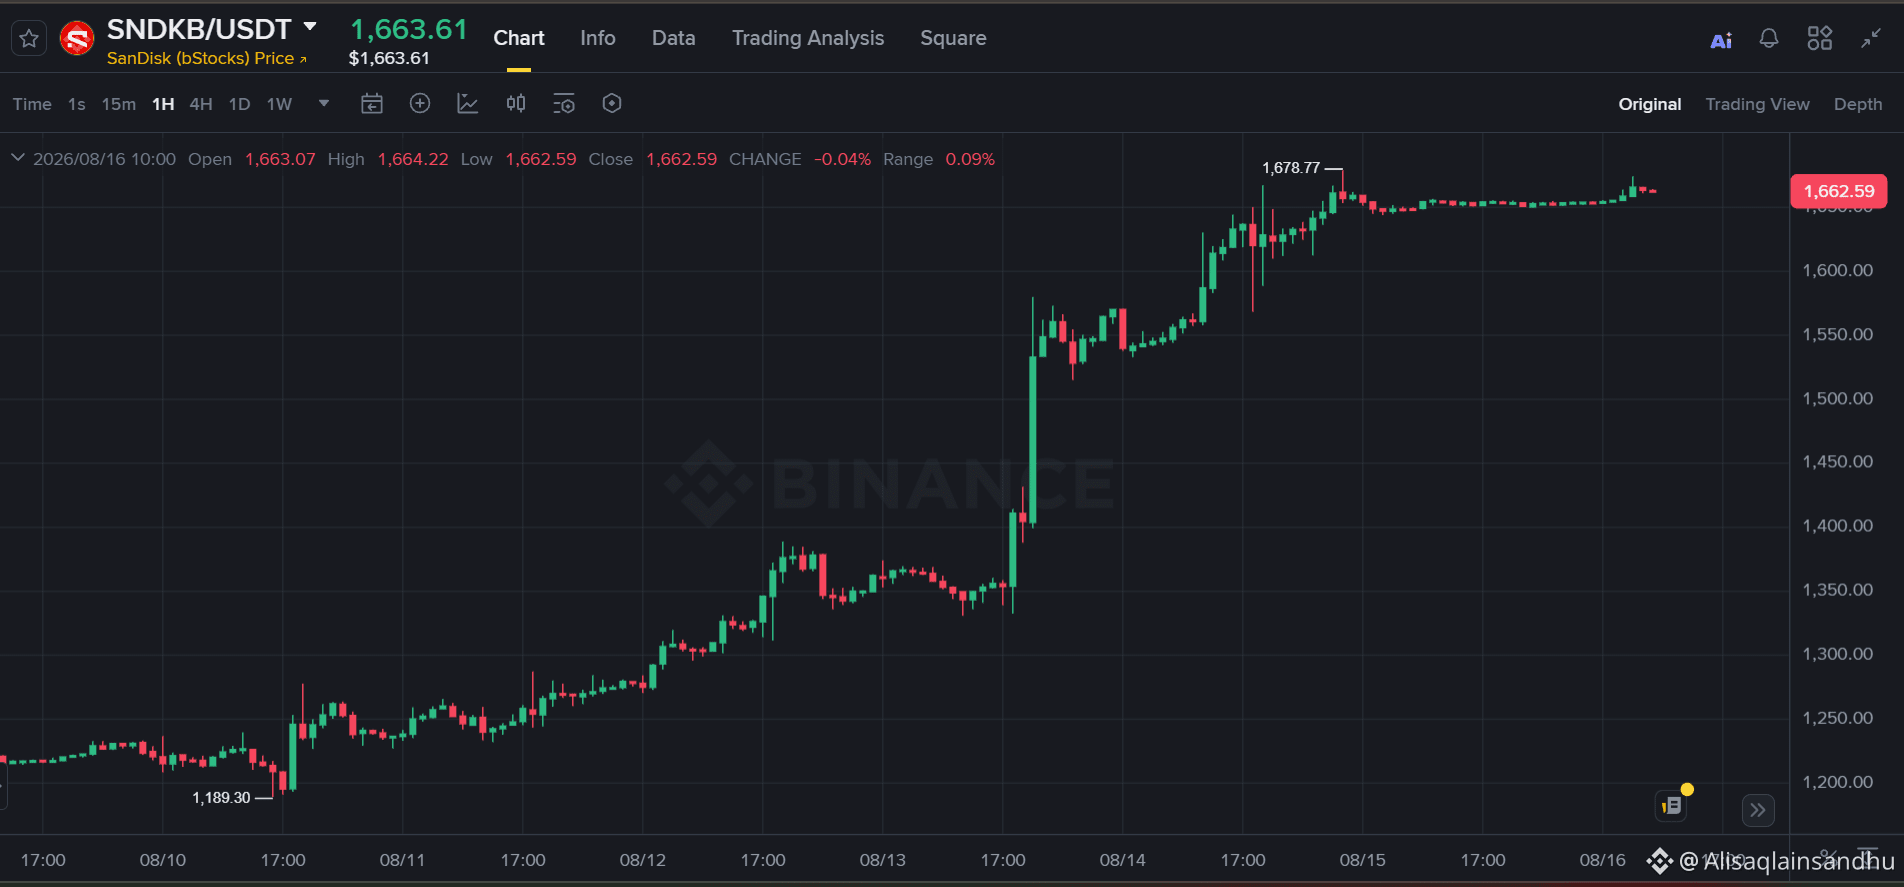
• Zona de entrada: $1,650.00 – $1,665.00
• Invalidación / Stop Loss: $1,615.00 (cierre horario limpio por debajo de la base de consolidación estructural)
• Objetivo 🎯 1: $1,678.77 (retest del máximo local)
• Objetivo 🎯 2: $1,720.00 (nivel de expansión de liquidez)
• Objetivo 🎯 3: $1,780.00 (objetivo de gran extensión)
El Relato del Mercado:
SNDKB sigue mostrando una fuerza relativa dominante, manteniendo una compresión ajustada cerca de máximos récord mientras los compradores absorben toda la oferta que llega. La falta de presión vendedora tras una enorme expansión de varios días indica que la acumulación institucional está manteniendo la tendencia firmemente al alza.
El Desglose Técnico:
En el marco de 1 hora,
$SNDKB permanece en una estructura de tendencia alcista “de manual”, caracterizada por impulsos agresivos y consolidaciones poco profundas a niveles altos desde la base de $1,189.30. Después de alcanzar un pico nuevo de $1,678.77, el precio no experimentó una corrección profunda; en su lugar, ha formado un rango ascendente ajustado justo debajo de la resistencia, avanzando de forma constante por el límite superior.
Esta compresión de varias sesiones justo debajo de la resistencia es un comportamiento clásico previo al rompimiento, señalando que los vendedores no logran empujar los precios hacia abajo mientras los compradores establecen un soporte estructural más alto alrededor de $1,650. Mientras el precio se mantenga por encima del piso de $1,615, la ruta de menor resistencia sigue siendo hacia arriba, con un rompimiento limpio por encima de $1,678.77 listo para activar un rápido descubrimiento de precio hacia la zona de $1,720+.
¿Ves a
$SNDKB rompiendo con limpieza por encima de $1,680 en este impulso, o nos dará un último retroceso para cargar? ¡Deja tus objetivos abajo! 👇
#cryptotrading #SNDKB #techicalanalysis #BinanceSquare #Alisaqlainsandhu Aviso legal: Esto es solo con fines educativos y no es asesoramiento de inversión. Haz siempre tu propia investigación y gestiona tu riesgo.