

#onchaindata
onchaindata
676,871 vistas
3,881 están debatiendo
Hot
Lo último

Al revisar las cifras de BTC de 2025, no diría que la situación sea unilateral
Los ETF spot de BTC de EE. UU. registraron entradas netas de más de 21.000 millones de dólares. Las tenencias corporativas superaron los 1,1 millones de BTC, alrededor del 5,5 % de la oferta. Al mismo tiempo, las direcciones activas cayeron cerca de un 16 % interanual
En mi opinión, esas cifras no se contradicen realmente. Los flujos de los ETF y las tenencias de las empresas muestran un tipo de demanda; las direcciones activas ofrecen otra perspectiva de la actividad de la red. Ninguna de estas cifras puede decirnos hacia dónde irá BTC después.
Si pudieras dejar solo un indicador en tu panel de BTC, ¿cuál elegirías: los flujos de ETF/tesorerías o la actividad on-chain? ¿Y qué te haría cambiar de opinión?
Fuente: revisión de 2025 de Binance Research, publicada el 15 de enero de 2026. Estas son cifras históricas, no datos de mercado en tiempo real. Solo con fines educativos; no constituye asesoramiento financiero
$BTC #Bitcoin #Crypto #OnChainData
{spot}(BTCUSDT)
{future}(USDCUSDT)
{future}(BTCUSDT)
#MarketStructure
Al revisar las cifras de BTC de 2025, no diría que la situación sea unilateral
Los ETF spot de BTC de EE. UU. registraron entradas netas de más de 21.000 millones de dólares. Las tenencias corporativas superaron los 1,1 millones de BTC, alrededor del 5,5 % de la oferta. Al mismo tiempo, las direcciones activas cayeron cerca de un 16 % interanual
En mi opinión, esas cifras no se contradicen realmente. Los flujos de los ETF y las tenencias de las empresas muestran un tipo de demanda; las direcciones activas ofrecen otra perspectiva de la actividad de la red. Ninguna de estas cifras puede decirnos hacia dónde irá BTC después.
Si pudieras dejar solo un indicador en tu panel de BTC, ¿cuál elegirías: los flujos de ETF/tesorerías o la actividad on-chain? ¿Y qué te haría cambiar de opinión?
Fuente: revisión de 2025 de Binance Research, publicada el 15 de enero de 2026. Estas son cifras históricas, no datos de mercado en tiempo real. Solo con fines educativos; no constituye asesoramiento financiero
$BTC #Bitcoin #Crypto #OnChainData
#MarketStructure
Los ETF spot de BTC de EE. UU. registraron entradas netas de más de 21.000 millones de dólares. Las tenencias corporativas superaron los 1,1 millones de BTC, alrededor del 5,5 % de la oferta. Al mismo tiempo, las direcciones activas cayeron cerca de un 16 % interanual
En mi opinión, esas cifras no se contradicen realmente. Los flujos de los ETF y las tenencias de las empresas muestran un tipo de demanda; las direcciones activas ofrecen otra perspectiva de la actividad de la red. Ninguna de estas cifras puede decirnos hacia dónde irá BTC después.
Si pudieras dejar solo un indicador en tu panel de BTC, ¿cuál elegirías: los flujos de ETF/tesorerías o la actividad on-chain? ¿Y qué te haría cambiar de opinión?
Fuente: revisión de 2025 de Binance Research, publicada el 15 de enero de 2026. Estas son cifras históricas, no datos de mercado en tiempo real. Solo con fines educativos; no constituye asesoramiento financiero
$BTC #Bitcoin #Crypto #OnChainData
#MarketStructure

77

·
--
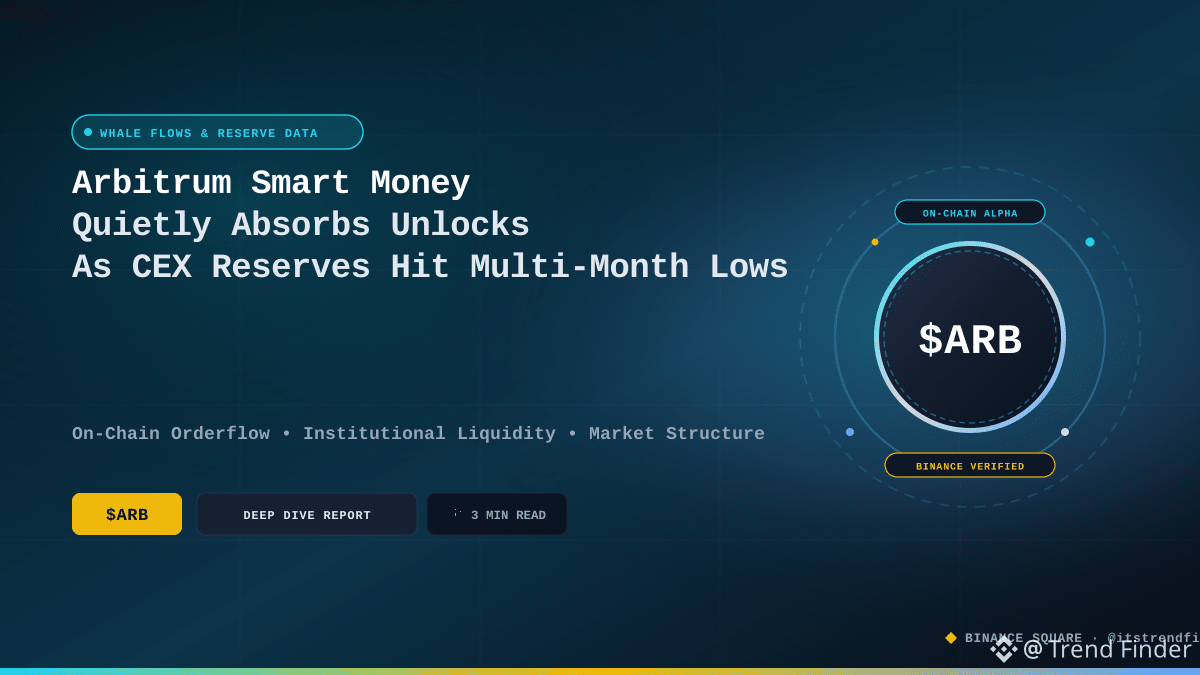
El dinero inteligente de Arbitrum absorbe discretamente los desbloqueos mientras las reservas de los CEX caen a mínimos de varios meses
Arbitrum está actualmente atrapado en una silenciosa pero intensa pugna entre los agresivos desbloqueos programados y la acumulación institucional de alta convicción. Mientras los operadores minoristas se centran sobre todo en la dilución de la oferta circulante que mantiene el precio reprimido en torno a 0.169, los datos de las billeteras de almacenamiento en frío muestran entre bastidores una realidad completamente distinta.
El seguimiento de la custodia institucional y de las billeteras de los primeros colaboradores revela un ritmo constante de retiros durante las últimas dos semanas, con aproximadamente 4.2 millones de tokens trasladados desde exchanges centralizados a almacenamiento privado en frío. En lugar de vender sus tokens consolidados en los libros de órdenes actuales, las mesas de dinero inteligente están bloqueando activamente la oferta. El puntaje Z de MVRV de $ARB se encuentra ahora en una zona de gran valor, un nivel que históricamente ha señalado una infravaloración considerable con respecto a su capitalización realizada.
Al observar los grupos de billeteras que tienen entre 1 millón y 10 millones de unidades, los saldos de las posiciones netas han aumentado de forma constante durante los últimos 30 días. Esta absorción sostenida demuestra que los participantes institucionales están absorbiendo cómodamente la presión vendedora generada por los calendarios de adquisición lineal. Mientras tanto, la proporción entre la oferta de tenedores a largo plazo y la de tenedores a corto plazo está evolucionando favorablemente, lo que indica que las monedas están migrando poco a poco de manos especulativas débiles a grupos con vencimientos más largos.
Con las reservas de los exchanges en descenso hasta niveles que no se veían desde la anterior gran fase de acumulación, la infraestructura interna de los ecosistemas de capa 2 apunta a un clásico shock de oferta cuando cambie el sentimiento macroeconómico.
¿Estás observando esta misma acumulación constante en tu propio seguimiento en cadena o crees que los próximos calendarios de desbloqueo seguirán superando la demanda de los compradores?
#OnChainData #WhaleAlert
El dinero inteligente de Arbitrum absorbe discretamente los desbloqueos mientras las reservas de los CEX caen a mínimos de varios meses
Arbitrum está actualmente atrapado en una silenciosa pero intensa pugna entre los agresivos desbloqueos programados y la acumulación institucional de alta convicción. Mientras los operadores minoristas se centran sobre todo en la dilución de la oferta circulante que mantiene el precio reprimido en torno a 0.169, los datos de las billeteras de almacenamiento en frío muestran entre bastidores una realidad completamente distinta.
El seguimiento de la custodia institucional y de las billeteras de los primeros colaboradores revela un ritmo constante de retiros durante las últimas dos semanas, con aproximadamente 4.2 millones de tokens trasladados desde exchanges centralizados a almacenamiento privado en frío. En lugar de vender sus tokens consolidados en los libros de órdenes actuales, las mesas de dinero inteligente están bloqueando activamente la oferta. El puntaje Z de MVRV de $ARB se encuentra ahora en una zona de gran valor, un nivel que históricamente ha señalado una infravaloración considerable con respecto a su capitalización realizada.
Al observar los grupos de billeteras que tienen entre 1 millón y 10 millones de unidades, los saldos de las posiciones netas han aumentado de forma constante durante los últimos 30 días. Esta absorción sostenida demuestra que los participantes institucionales están absorbiendo cómodamente la presión vendedora generada por los calendarios de adquisición lineal. Mientras tanto, la proporción entre la oferta de tenedores a largo plazo y la de tenedores a corto plazo está evolucionando favorablemente, lo que indica que las monedas están migrando poco a poco de manos especulativas débiles a grupos con vencimientos más largos.
Con las reservas de los exchanges en descenso hasta niveles que no se veían desde la anterior gran fase de acumulación, la infraestructura interna de los ecosistemas de capa 2 apunta a un clásico shock de oferta cuando cambie el sentimiento macroeconómico.
¿Estás observando esta misma acumulación constante en tu propio seguimiento en cadena o crees que los próximos calendarios de desbloqueo seguirán superando la demanda de los compradores?
#OnChainData #WhaleAlert
Arbitrum está actualmente atrapado en una silenciosa pero intensa pugna entre los agresivos desbloqueos programados y la acumulación institucional de alta convicción. Mientras los operadores minoristas se centran sobre todo en la dilución de la oferta circulante que mantiene el precio reprimido en torno a 0.169, los datos de las billeteras de almacenamiento en frío muestran entre bastidores una realidad completamente distinta.
El seguimiento de la custodia institucional y de las billeteras de los primeros colaboradores revela un ritmo constante de retiros durante las últimas dos semanas, con aproximadamente 4.2 millones de tokens trasladados desde exchanges centralizados a almacenamiento privado en frío. En lugar de vender sus tokens consolidados en los libros de órdenes actuales, las mesas de dinero inteligente están bloqueando activamente la oferta. El puntaje Z de MVRV de $ARB se encuentra ahora en una zona de gran valor, un nivel que históricamente ha señalado una infravaloración considerable con respecto a su capitalización realizada.
Al observar los grupos de billeteras que tienen entre 1 millón y 10 millones de unidades, los saldos de las posiciones netas han aumentado de forma constante durante los últimos 30 días. Esta absorción sostenida demuestra que los participantes institucionales están absorbiendo cómodamente la presión vendedora generada por los calendarios de adquisición lineal. Mientras tanto, la proporción entre la oferta de tenedores a largo plazo y la de tenedores a corto plazo está evolucionando favorablemente, lo que indica que las monedas están migrando poco a poco de manos especulativas débiles a grupos con vencimientos más largos.
Con las reservas de los exchanges en descenso hasta niveles que no se veían desde la anterior gran fase de acumulación, la infraestructura interna de los ecosistemas de capa 2 apunta a un clásico shock de oferta cuando cambie el sentimiento macroeconómico.
¿Estás observando esta misma acumulación constante en tu propio seguimiento en cadena o crees que los próximos calendarios de desbloqueo seguirán superando la demanda de los compradores?
#OnChainData #WhaleAlert
1
3
·
--
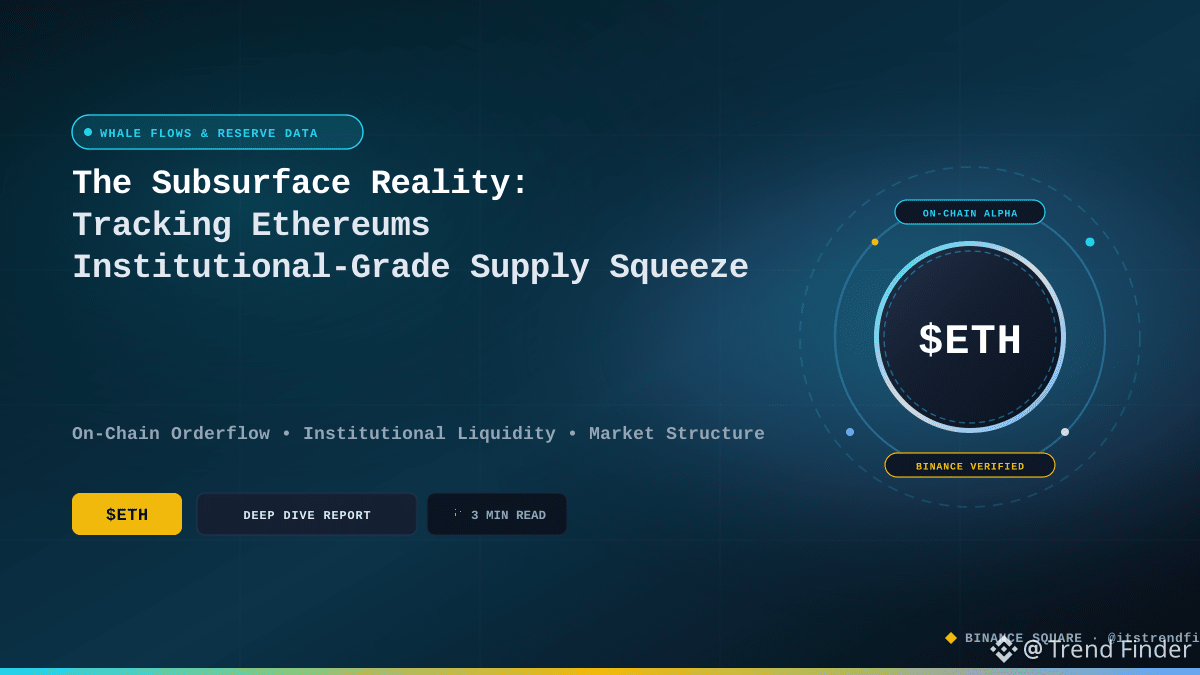
La realidad subyacente: seguimiento de la contracción de la oferta de Ethereum de nivel institucional
La mesa está tranquila a las 3 de la mañana, pero los datos on-chain no tienen nada de silenciosos. Mientras $ETH se mantiene cerca de 2340.2, los entresijos de la red cuentan una historia mucho más contundente que la línea plana que vemos en los gráficos de los exchanges. He estado siguiendo al grupo de direcciones que poseen entre 10 000 y 100 000 unidades, y su comportamiento está virando hacia un vacío estructural de oferta. Estamos viendo un claro cambio de tendencia en las reservas de los exchanges, con una salida constante de monedas de las plataformas centralizadas hacia el almacenamiento en frío durante las últimas 72 horas. No se trata simplemente de pequeños inversores moviendo sus activos: es capital institucional que se posiciona fuera de la custodia de los exchanges.
Las métricas de flujos netos de los exchanges muestran un déficit considerable en los últimos 30 días, lo que indica que la oferta disponible para obtener liquidez inmediata se está reduciendo rápidamente. Al contrastar esto con los datos actuales del SOPR, queda claro que quienes tienen ganancias están reacios a vender durante esta consolidación. La valoración de la capitalización realizada en comparación con la capitalización de mercado sugiere que ETH se encuentra actualmente en una fase de acumulación en una zona de valor, no de distribución. A diferencia de ciclos anteriores, en los que la relación entre los holders a largo y corto plazo (LTH y STH) apuntaba a una inminente capitulación, la oferta de los holders a largo plazo está alcanzando un máximo local en términos de inactividad. No están moviendo sus monedas.
El entorno macroeconómico sigue siendo el catalizador más evidente, pero el potencial de un shock de oferta se está convirtiendo en un factor real, ya que estas carteras de ballenas barren agresivamente los libros de órdenes. La actividad de la red está desacoplada de la volátil acción del precio, lo que es una señal clásica de acumulación por parte del dinero inteligente. Si observas la velocidad de los retiros, queda confirmado que los grandes holders apuestan por una expansión fundamental a largo plazo, en lugar de buscar ganancias rápidas a corto plazo. En esencia, estamos presenciando una contracción lenta de la oferta mientras el resto del mercado espera un catalizador macroeconómico. ¿Estás viendo estos mismos patrones de salida en tus herramientas de seguimiento, o crees que esto es simplemente un rebalanceo habitual de los exchanges?
_
#OnChainData #WhaleAlert
La realidad subyacente: seguimiento de la contracción de la oferta de Ethereum de nivel institucional
La mesa está tranquila a las 3 de la mañana, pero los datos on-chain no tienen nada de silenciosos. Mientras $ETH se mantiene cerca de 2340.2, los entresijos de la red cuentan una historia mucho más contundente que la línea plana que vemos en los gráficos de los exchanges. He estado siguiendo al grupo de direcciones que poseen entre 10 000 y 100 000 unidades, y su comportamiento está virando hacia un vacío estructural de oferta. Estamos viendo un claro cambio de tendencia en las reservas de los exchanges, con una salida constante de monedas de las plataformas centralizadas hacia el almacenamiento en frío durante las últimas 72 horas. No se trata simplemente de pequeños inversores moviendo sus activos: es capital institucional que se posiciona fuera de la custodia de los exchanges.
Las métricas de flujos netos de los exchanges muestran un déficit considerable en los últimos 30 días, lo que indica que la oferta disponible para obtener liquidez inmediata se está reduciendo rápidamente. Al contrastar esto con los datos actuales del SOPR, queda claro que quienes tienen ganancias están reacios a vender durante esta consolidación. La valoración de la capitalización realizada en comparación con la capitalización de mercado sugiere que ETH se encuentra actualmente en una fase de acumulación en una zona de valor, no de distribución. A diferencia de ciclos anteriores, en los que la relación entre los holders a largo y corto plazo (LTH y STH) apuntaba a una inminente capitulación, la oferta de los holders a largo plazo está alcanzando un máximo local en términos de inactividad. No están moviendo sus monedas.
El entorno macroeconómico sigue siendo el catalizador más evidente, pero el potencial de un shock de oferta se está convirtiendo en un factor real, ya que estas carteras de ballenas barren agresivamente los libros de órdenes. La actividad de la red está desacoplada de la volátil acción del precio, lo que es una señal clásica de acumulación por parte del dinero inteligente. Si observas la velocidad de los retiros, queda confirmado que los grandes holders apuestan por una expansión fundamental a largo plazo, en lugar de buscar ganancias rápidas a corto plazo. En esencia, estamos presenciando una contracción lenta de la oferta mientras el resto del mercado espera un catalizador macroeconómico. ¿Estás viendo estos mismos patrones de salida en tus herramientas de seguimiento, o crees que esto es simplemente un rebalanceo habitual de los exchanges?
_
#OnChainData #WhaleAlert
La mesa está tranquila a las 3 de la mañana, pero los datos on-chain no tienen nada de silenciosos. Mientras $ETH se mantiene cerca de 2340.2, los entresijos de la red cuentan una historia mucho más contundente que la línea plana que vemos en los gráficos de los exchanges. He estado siguiendo al grupo de direcciones que poseen entre 10 000 y 100 000 unidades, y su comportamiento está virando hacia un vacío estructural de oferta. Estamos viendo un claro cambio de tendencia en las reservas de los exchanges, con una salida constante de monedas de las plataformas centralizadas hacia el almacenamiento en frío durante las últimas 72 horas. No se trata simplemente de pequeños inversores moviendo sus activos: es capital institucional que se posiciona fuera de la custodia de los exchanges.
Las métricas de flujos netos de los exchanges muestran un déficit considerable en los últimos 30 días, lo que indica que la oferta disponible para obtener liquidez inmediata se está reduciendo rápidamente. Al contrastar esto con los datos actuales del SOPR, queda claro que quienes tienen ganancias están reacios a vender durante esta consolidación. La valoración de la capitalización realizada en comparación con la capitalización de mercado sugiere que ETH se encuentra actualmente en una fase de acumulación en una zona de valor, no de distribución. A diferencia de ciclos anteriores, en los que la relación entre los holders a largo y corto plazo (LTH y STH) apuntaba a una inminente capitulación, la oferta de los holders a largo plazo está alcanzando un máximo local en términos de inactividad. No están moviendo sus monedas.
El entorno macroeconómico sigue siendo el catalizador más evidente, pero el potencial de un shock de oferta se está convirtiendo en un factor real, ya que estas carteras de ballenas barren agresivamente los libros de órdenes. La actividad de la red está desacoplada de la volátil acción del precio, lo que es una señal clásica de acumulación por parte del dinero inteligente. Si observas la velocidad de los retiros, queda confirmado que los grandes holders apuestan por una expansión fundamental a largo plazo, en lugar de buscar ganancias rápidas a corto plazo. En esencia, estamos presenciando una contracción lenta de la oferta mientras el resto del mercado espera un catalizador macroeconómico. ¿Estás viendo estos mismos patrones de salida en tus herramientas de seguimiento, o crees que esto es simplemente un rebalanceo habitual de los exchanges?
_
#OnChainData #WhaleAlert
3
·
--
La salida de fondos de los exchanges se está acelerando esta noche. Estoy viendo cómo los grupos de ballenas trasladan grandes posiciones de $ETH a almacenamiento en frío profundo mientras el precio se mantiene en 2347.26. La oferta inactiva está despertando, pero el MVRV sigue neutral, manteniendo la volatilidad contenida por ahora. Esta es una estrategia clásica de posicionamiento del dinero inteligente antes de un cambio en la liquidez. Estoy siguiendo de cerca las salidas. $BTC _
#OnChainData #WhaleAlert #ETH
La salida de fondos de los exchanges se está acelerando esta noche. Estoy viendo cómo los grupos de ballenas trasladan grandes posiciones de $ETH a almacenamiento en frío profundo mientras el precio se mantiene en 2347.26. La oferta inactiva está despertando, pero el MVRV sigue neutral, manteniendo la volatilidad contenida por ahora. Esta es una estrategia clásica de posicionamiento del dinero inteligente antes de un cambio en la liquidez. Estoy siguiendo de cerca las salidas. $BTC _
#OnChainData #WhaleAlert #ETH
#OnChainData #WhaleAlert #ETH
1
11

·
--
Robinhood Chain es un caso de estudio útil sobre la brecha entre el entusiasmo inicial y el uso sostenido.
La L2 basada en Arbitrum se lanzó el 1 de julio y superó brevemente a Base en volumen de 30 días. Ahora las cifras han caído con fuerza. Según DefiLlama, el volumen de DEX en 24 horas rondaba los 577 millones de dólares al 24 de octubre, mientras que el volumen de 7 días era de 5.610 millones, un 14,6 % menos que la semana anterior. El rastreador de Blackroom Alpha basado en DefiLlama sitúa el volumen de DEX de 30 días en 31.600 millones de dólares, un 41,9 % menos que en los 30 días anteriores. Las comisiones diarias de la cadena rondan los 43.000 dólares, muy lejos de los aproximadamente 8 millones del día de mayor actividad a principios de septiembre.
Lo que me parece más interesante es lo que no se ha desplomado. El TVL sigue cerca de los 1.130 millones de dólares, la oferta de stablecoins ronda los 1.050 millones y el volumen de perpetuos es de unos 1.030 millones al día. Así que el dinero se queda, en su mayor parte, donde está; simplemente se negocia menos. Robinhood también sigue cubriendo las comisiones de red en los intercambios superiores a 0,50 dólares hasta el 31 de diciembre.
Mi opinión: los picos de actividad impulsados por las memecoins se desvanecen rápido en cada nueva cadena. La verdadera prueba para Robinhood Chain es si las acciones tokenizadas, los activos del mundo real (RWA) y los perpetuos pueden generar una demanda constante cuando pase la ola de las memecoins. Que los depósitos se mantengan es una buena señal. La caída de las comisiones es una advertencia.
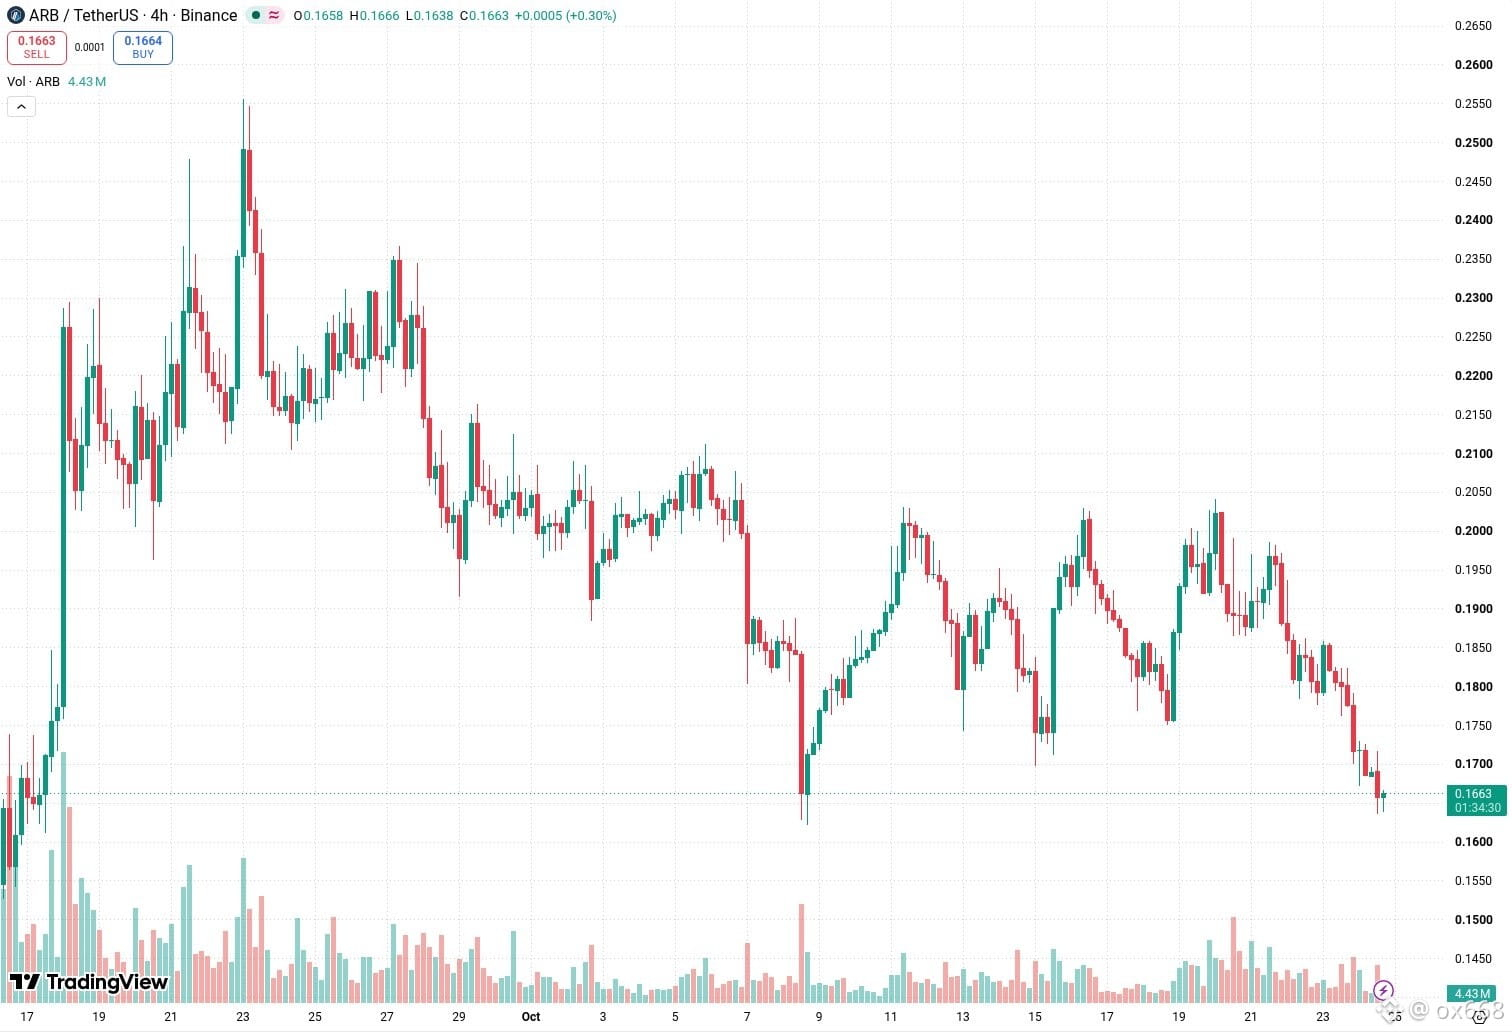
Sigo de cerca $ARB como capa base de la cadena y $ETH como capa de liquidación.
#RobinhoodChain #Layer2 #Arbitrum #DeFi #OnChainData
Esto no es asesoramiento financiero.
Robinhood Chain es un caso de estudio útil sobre la brecha entre el entusiasmo inicial y el uso sostenido.
La L2 basada en Arbitrum se lanzó el 1 de julio y superó brevemente a Base en volumen de 30 días. Ahora las cifras han caído con fuerza. Según DefiLlama, el volumen de DEX en 24 horas rondaba los 577 millones de dólares al 24 de octubre, mientras que el volumen de 7 días era de 5.610 millones, un 14,6 % menos que la semana anterior. El rastreador de Blackroom Alpha basado en DefiLlama sitúa el volumen de DEX de 30 días en 31.600 millones de dólares, un 41,9 % menos que en los 30 días anteriores. Las comisiones diarias de la cadena rondan los 43.000 dólares, muy lejos de los aproximadamente 8 millones del día de mayor actividad a principios de septiembre.
Lo que me parece más interesante es lo que no se ha desplomado. El TVL sigue cerca de los 1.130 millones de dólares, la oferta de stablecoins ronda los 1.050 millones y el volumen de perpetuos es de unos 1.030 millones al día. Así que el dinero se queda, en su mayor parte, donde está; simplemente se negocia menos. Robinhood también sigue cubriendo las comisiones de red en los intercambios superiores a 0,50 dólares hasta el 31 de diciembre.
Mi opinión: los picos de actividad impulsados por las memecoins se desvanecen rápido en cada nueva cadena. La verdadera prueba para Robinhood Chain es si las acciones tokenizadas, los activos del mundo real (RWA) y los perpetuos pueden generar una demanda constante cuando pase la ola de las memecoins. Que los depósitos se mantengan es una buena señal. La caída de las comisiones es una advertencia.
Sigo de cerca $ARB como capa base de la cadena y $ETH como capa de liquidación.
#RobinhoodChain #Layer2 #Arbitrum #DeFi #OnChainData
Esto no es asesoramiento financiero.
La L2 basada en Arbitrum se lanzó el 1 de julio y superó brevemente a Base en volumen de 30 días. Ahora las cifras han caído con fuerza. Según DefiLlama, el volumen de DEX en 24 horas rondaba los 577 millones de dólares al 24 de octubre, mientras que el volumen de 7 días era de 5.610 millones, un 14,6 % menos que la semana anterior. El rastreador de Blackroom Alpha basado en DefiLlama sitúa el volumen de DEX de 30 días en 31.600 millones de dólares, un 41,9 % menos que en los 30 días anteriores. Las comisiones diarias de la cadena rondan los 43.000 dólares, muy lejos de los aproximadamente 8 millones del día de mayor actividad a principios de septiembre.
Lo que me parece más interesante es lo que no se ha desplomado. El TVL sigue cerca de los 1.130 millones de dólares, la oferta de stablecoins ronda los 1.050 millones y el volumen de perpetuos es de unos 1.030 millones al día. Así que el dinero se queda, en su mayor parte, donde está; simplemente se negocia menos. Robinhood también sigue cubriendo las comisiones de red en los intercambios superiores a 0,50 dólares hasta el 31 de diciembre.
Mi opinión: los picos de actividad impulsados por las memecoins se desvanecen rápido en cada nueva cadena. La verdadera prueba para Robinhood Chain es si las acciones tokenizadas, los activos del mundo real (RWA) y los perpetuos pueden generar una demanda constante cuando pase la ola de las memecoins. Que los depósitos se mantengan es una buena señal. La caída de las comisiones es una advertencia.
Sigo de cerca $ARB como capa base de la cadena y $ETH como capa de liquidación.
#RobinhoodChain #Layer2 #Arbitrum #DeFi #OnChainData
Esto no es asesoramiento financiero.
1
216
Artículo
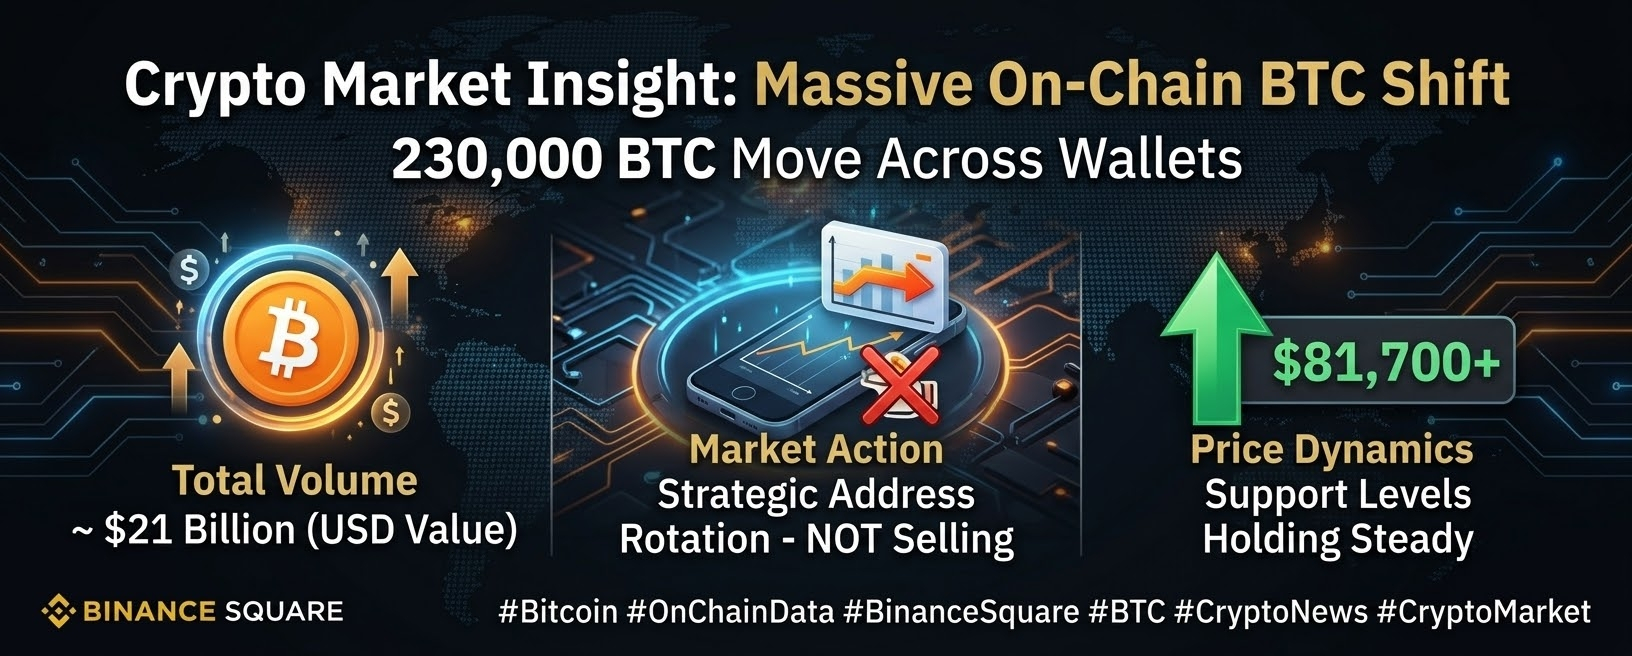
Movimiento masivo de 230.000 BTC en cadena: qué significa para el mercadoEl mercado de las criptomonedas fue testigo recientemente de uno de los mayores movimientos de Bitcoin en cadena del año: más de 230.000 BTC (~21.000 millones de dólares) se movieron entre billeteras. A pesar de este enorme volumen, el análisis del mercado no muestra un aumento significativo de las entradas a los exchanges, lo que sugiere una rotación interna de direcciones en lugar de presión vendedora.
Actividad de las ballenas: Las transacciones de gran escala como esta ponen de relieve la gestión estratégica de las billeteras por parte de grandes titulares institucionales o servicios de custodia.
Estabilidad del mercado: Como Bitcoin se mantiene cerca del nivel de los 81.700 $ tras poner a prueba zonas clave de soporte, los analistas prevén que el rango de precios de 80.000–85.000 $ seguirá vigente a corto plazo.
Movimiento masivo de 230.000 BTC en cadena: qué significa para el mercado
El mercado de las criptomonedas fue testigo recientemente de uno de los mayores movimientos de Bitcoin en cadena del año: más de 230.000 BTC (~21.000 millones de dólares) se movieron entre billeteras. A pesar de este enorme volumen, el análisis del mercado no muestra un aumento significativo de las entradas a los exchanges, lo que sugiere una rotación interna de direcciones en lugar de presión vendedora.
Actividad de las ballenas: Las transacciones de gran escala como esta ponen de relieve la gestión estratégica de las billeteras por parte de grandes titulares institucionales o servicios de custodia.
Estabilidad del mercado: Como Bitcoin se mantiene cerca del nivel de los 81.700 $ tras poner a prueba zonas clave de soporte, los analistas prevén que el rango de precios de 80.000–85.000 $ seguirá vigente a corto plazo.
Actividad de las ballenas: Las transacciones de gran escala como esta ponen de relieve la gestión estratégica de las billeteras por parte de grandes titulares institucionales o servicios de custodia.
Estabilidad del mercado: Como Bitcoin se mantiene cerca del nivel de los 81.700 $ tras poner a prueba zonas clave de soporte, los analistas prevén que el rango de precios de 80.000–85.000 $ seguirá vigente a corto plazo.
63
·
--
El dinero inteligente está retirando discretamente oferta de los exchanges ahora mismo. Mientras $LINK se mantiene cerca de 11.796, las reservas de los CEX están cayendo rápidamente, ya que los grupos de ballenas transfieren tokens directamente a almacenamiento en frío. La convicción de los holders a largo plazo parece extremadamente firme bajo esta tranquila acción del precio.
#OnChainData #WhaleAlert #LINK
El dinero inteligente está retirando discretamente oferta de los exchanges ahora mismo. Mientras $LINK se mantiene cerca de 11.796, las reservas de los CEX están cayendo rápidamente, ya que los grupos de ballenas transfieren tokens directamente a almacenamiento en frío. La convicción de los holders a largo plazo parece extremadamente firme bajo esta tranquila acción del precio.
#OnChainData #WhaleAlert #LINK
#OnChainData #WhaleAlert #LINK
1
3

·
--
SHIB recupera los $0.000005, pero las entradas apuntan a cautela ⚠️
Shiba Inu ($SHIB) rebotó desde su mínimo diario de $0.00000493 y cotiza en torno a los $0.00000510. Aunque recuperar el nivel psicológico de $0.000005 ofrece un alivio a corto plazo, las métricas on-chain apuntan a una posible presión vendedora.
Desglose de datos clave:
Aumento de las entradas netas: Los exchanges registraron entradas totales de 256.44B SHIB frente a salidas de 202.63B SHIB, lo que dio como resultado un aumento neto de ~53.80B SHIB (+3.69%) en solo 24 horas.
Reservas al alza: Las reservas totales en exchanges subieron a 87.236T SHIB (valoradas en aproximadamente $441.4M), lo que confirma depósitos constantes durante las últimas sesiones.
Obstáculo técnico: El rebote sigue siendo frágil sin una confirmación de volumen sólido. SHIB enfrenta una resistencia por encima, en la media móvil de 100 días, cerca de $0.00000525, y en la de 200 días, cerca de $0.00000558.
Los grandes depósitos netos en exchanges centralizados suelen indicar que los holders podrían estar preparándose para obtener ganancias o cubrirse frente a la volatilidad. Los alcistas necesitan un cierre diario por encima de la zona de $0.00000525 para validar una continuación genuina.
¿Estás comprando en esta caída o esperando una ruptura clara? ¡Deja tu opinión abajo! 👇
#SHIB #CryptoNews #BinanceSquare #Memecoins #OnChainData
$SHIB
{spot}(SHIBUSDT)
SHIB recupera los $0.000005, pero las entradas apuntan a cautela ⚠️
Shiba Inu ($SHIB ) rebotó desde su mínimo diario de $0.00000493 y cotiza en torno a los $0.00000510. Aunque recuperar el nivel psicológico de $0.000005 ofrece un alivio a corto plazo, las métricas on-chain apuntan a una posible presión vendedora.
Desglose de datos clave:
Aumento de las entradas netas: Los exchanges registraron entradas totales de 256.44B SHIB frente a salidas de 202.63B SHIB, lo que dio como resultado un aumento neto de ~53.80B SHIB (+3.69%) en solo 24 horas.
Reservas al alza: Las reservas totales en exchanges subieron a 87.236T SHIB (valoradas en aproximadamente $441.4M), lo que confirma depósitos constantes durante las últimas sesiones.
Obstáculo técnico: El rebote sigue siendo frágil sin una confirmación de volumen sólido. SHIB enfrenta una resistencia por encima, en la media móvil de 100 días, cerca de $0.00000525, y en la de 200 días, cerca de $0.00000558.
Los grandes depósitos netos en exchanges centralizados suelen indicar que los holders podrían estar preparándose para obtener ganancias o cubrirse frente a la volatilidad. Los alcistas necesitan un cierre diario por encima de la zona de $0.00000525 para validar una continuación genuina.
¿Estás comprando en esta caída o esperando una ruptura clara? ¡Deja tu opinión abajo! 👇
#SHIB #CryptoNews #BinanceSquare #Memecoins #OnChainData
$SHIB
Shiba Inu ($SHIB ) rebotó desde su mínimo diario de $0.00000493 y cotiza en torno a los $0.00000510. Aunque recuperar el nivel psicológico de $0.000005 ofrece un alivio a corto plazo, las métricas on-chain apuntan a una posible presión vendedora.
Desglose de datos clave:
Aumento de las entradas netas: Los exchanges registraron entradas totales de 256.44B SHIB frente a salidas de 202.63B SHIB, lo que dio como resultado un aumento neto de ~53.80B SHIB (+3.69%) en solo 24 horas.
Reservas al alza: Las reservas totales en exchanges subieron a 87.236T SHIB (valoradas en aproximadamente $441.4M), lo que confirma depósitos constantes durante las últimas sesiones.
Obstáculo técnico: El rebote sigue siendo frágil sin una confirmación de volumen sólido. SHIB enfrenta una resistencia por encima, en la media móvil de 100 días, cerca de $0.00000525, y en la de 200 días, cerca de $0.00000558.
Los grandes depósitos netos en exchanges centralizados suelen indicar que los holders podrían estar preparándose para obtener ganancias o cubrirse frente a la volatilidad. Los alcistas necesitan un cierre diario por encima de la zona de $0.00000525 para validar una continuación genuina.
¿Estás comprando en esta caída o esperando una ruptura clara? ¡Deja tu opinión abajo! 👇
#SHIB #CryptoNews #BinanceSquare #Memecoins #OnChainData
$SHIB
2
178
·
--
Aquí son casi las 22:30 y estoy sentado en mi escritorio analizando la presión del lado de la oferta de Avalanche. Mientras el público minorista está ocupado persiguiendo la última rotación de memes, los datos on-chain de $AVAX muestran un movimiento mucho más calculado que está ocurriendo entre bastidores. Estamos viendo una reducción constante de las reservas en los exchanges, con una salida neta de casi 1,2 millones de unidades en los últimos 30 días. No se trata simplemente de volatilidad aleatoria; es un cambio claro hacia el almacenamiento en frío y el staking de validadores.
El grupo de ballenas que posee entre 10.000 y 100.000 unidades ha aumentado su saldo en aproximadamente un 2,4 % este mes. Si a esto le sumamos un MVRV Z-Score situado en el nivel neutral de 1,2, queda claro que la red aún está lejos de estar sobrecalentada. Estamos ante un mercado fundamentalmente distinto al del pico de 2021, porque la oferta circulante se está bloqueando a un ritmo más rápido que aquel al que los desbloqueos lineales del equipo llegan al mercado secundario.
La participación actual en el staking ronda el 54 %, lo que reduce efectivamente a la mitad la oferta líquida. Esto crea un enorme desequilibrio entre la oferta y la demanda cuando regrese la presión compradora del lado institucional. La proporción de la oferta en manos de tenedores a largo plazo está en su máximo de varios meses, lo que suele indicar que el dinero inteligente se siente cómodo esperando al margen un despegue macroeconómico en lugar de especular con pequeños movimientos.
Lo que más me llama la atención es la velocidad de los retiros. Esta semana, el volumen de las transacciones grandes que superan los 100.000 dólares aumentó un 15 %, algo que a menudo precede a cambios más amplios en la tendencia. AVAX está ajustando discretamente el cinturón mientras todos los demás se distraen.
¿Ustedes están viendo los mismos patrones de acumulación o esperan tener más claridad sobre el panorama macroeconómico antes de comprometerse?
#OnChainData #WhaleAlert
Aquí son casi las 22:30 y estoy sentado en mi escritorio analizando la presión del lado de la oferta de Avalanche. Mientras el público minorista está ocupado persiguiendo la última rotación de memes, los datos on-chain de $AVAX muestran un movimiento mucho más calculado que está ocurriendo entre bastidores. Estamos viendo una reducción constante de las reservas en los exchanges, con una salida neta de casi 1,2 millones de unidades en los últimos 30 días. No se trata simplemente de volatilidad aleatoria; es un cambio claro hacia el almacenamiento en frío y el staking de validadores.
El grupo de ballenas que posee entre 10.000 y 100.000 unidades ha aumentado su saldo en aproximadamente un 2,4 % este mes. Si a esto le sumamos un MVRV Z-Score situado en el nivel neutral de 1,2, queda claro que la red aún está lejos de estar sobrecalentada. Estamos ante un mercado fundamentalmente distinto al del pico de 2021, porque la oferta circulante se está bloqueando a un ritmo más rápido que aquel al que los desbloqueos lineales del equipo llegan al mercado secundario.
La participación actual en el staking ronda el 54 %, lo que reduce efectivamente a la mitad la oferta líquida. Esto crea un enorme desequilibrio entre la oferta y la demanda cuando regrese la presión compradora del lado institucional. La proporción de la oferta en manos de tenedores a largo plazo está en su máximo de varios meses, lo que suele indicar que el dinero inteligente se siente cómodo esperando al margen un despegue macroeconómico en lugar de especular con pequeños movimientos.
Lo que más me llama la atención es la velocidad de los retiros. Esta semana, el volumen de las transacciones grandes que superan los 100.000 dólares aumentó un 15 %, algo que a menudo precede a cambios más amplios en la tendencia. AVAX está ajustando discretamente el cinturón mientras todos los demás se distraen.
¿Ustedes están viendo los mismos patrones de acumulación o esperan tener más claridad sobre el panorama macroeconómico antes de comprometerse?
#OnChainData #WhaleAlert
El grupo de ballenas que posee entre 10.000 y 100.000 unidades ha aumentado su saldo en aproximadamente un 2,4 % este mes. Si a esto le sumamos un MVRV Z-Score situado en el nivel neutral de 1,2, queda claro que la red aún está lejos de estar sobrecalentada. Estamos ante un mercado fundamentalmente distinto al del pico de 2021, porque la oferta circulante se está bloqueando a un ritmo más rápido que aquel al que los desbloqueos lineales del equipo llegan al mercado secundario.
La participación actual en el staking ronda el 54 %, lo que reduce efectivamente a la mitad la oferta líquida. Esto crea un enorme desequilibrio entre la oferta y la demanda cuando regrese la presión compradora del lado institucional. La proporción de la oferta en manos de tenedores a largo plazo está en su máximo de varios meses, lo que suele indicar que el dinero inteligente se siente cómodo esperando al margen un despegue macroeconómico en lugar de especular con pequeños movimientos.
Lo que más me llama la atención es la velocidad de los retiros. Esta semana, el volumen de las transacciones grandes que superan los 100.000 dólares aumentó un 15 %, algo que a menudo precede a cambios más amplios en la tendencia. AVAX está ajustando discretamente el cinturón mientras todos los demás se distraen.
¿Ustedes están viendo los mismos patrones de acumulación o esperan tener más claridad sobre el panorama macroeconómico antes de comprometerse?
#OnChainData #WhaleAlert
1
4
·
--
La verdadera historia se está desarrollando fuera de los exchanges. Mientras $AVAX se sitúa en 9.295, los datos on-chain muestran una enorme acumulación por parte de las ballenas. Las reservas de los CEX están cayendo en picado a medida que los inversores informados trasladan sus activos a almacenamiento en frío. Esta migración de especuladores a tenedores a largo plazo sugiere que se está construyendo una base muy sólida, independientemente de las fluctuaciones locales del precio. $BTC
#OnChainData #WhaleAlert #AVAX
La verdadera historia se está desarrollando fuera de los exchanges. Mientras $AVAX se sitúa en 9.295, los datos on-chain muestran una enorme acumulación por parte de las ballenas. Las reservas de los CEX están cayendo en picado a medida que los inversores informados trasladan sus activos a almacenamiento en frío. Esta migración de especuladores a tenedores a largo plazo sugiere que se está construyendo una base muy sólida, independientemente de las fluctuaciones locales del precio. $BTC
#OnChainData #WhaleAlert #AVAX
#OnChainData #WhaleAlert #AVAX
1
5

·
--
Dune lanzó datos de trading spot y perpetuo on-chain que llegan aproximadamente un segundo después del bloque, en un formato unificado que abarca más de 200 plataformas descentralizadas. Esto facilita comparar la ejecución entre mercados, pero la cobertura es selectiva y no incluye todas las operaciones. 📊⛓️⚡️ ¿Creen que estos datos cambiarán la forma de seguir la liquidez?
Lo más negociado en Binance al momento de la consulta (23 de octubre, 02:03, hora de Estambul): $USDC, $BTC, $ETH — según el volumen de trading de los pares USDT durante 24 horas en Binance Spot. Seguimiento general del mercado, sin relación con noticias de Dune.
#Dune #OnchainData
Dune lanzó datos de trading spot y perpetuo on-chain que llegan aproximadamente un segundo después del bloque, en un formato unificado que abarca más de 200 plataformas descentralizadas. Esto facilita comparar la ejecución entre mercados, pero la cobertura es selectiva y no incluye todas las operaciones. 📊⛓️⚡️ ¿Creen que estos datos cambiarán la forma de seguir la liquidez?
Lo más negociado en Binance al momento de la consulta (23 de octubre, 02:03, hora de Estambul): $USDC , $BTC , $ETH — según el volumen de trading de los pares USDT durante 24 horas en Binance Spot. Seguimiento general del mercado, sin relación con noticias de Dune.
#Dune #OnchainData
Lo más negociado en Binance al momento de la consulta (23 de octubre, 02:03, hora de Estambul): $USDC , $BTC , $ETH — según el volumen de trading de los pares USDT durante 24 horas en Binance Spot. Seguimiento general del mercado, sin relación con noticias de Dune.
#Dune #OnchainData

34

·
--
¡Dune acaba de lanzar feeds de datos en tiempo real que abarcan 200 plataformas de trading on-chain! Esta herramienta conecta los datos on-chain con los sistemas financieros tradicionales, algo ideal para las instituciones que se adentran en el mundo cripto. Con la expansión de los mercados de acciones tokenizadas, ¡la llegada de Dune no podría ser más oportuna! #DeFi #OnchainData $ETH
¡Dune acaba de lanzar feeds de datos en tiempo real que abarcan 200 plataformas de trading on-chain! Esta herramienta conecta los datos on-chain con los sistemas financieros tradicionales, algo ideal para las instituciones que se adentran en el mundo cripto. Con la expansión de los mercados de acciones tokenizadas, ¡la llegada de Dune no podría ser más oportuna! #DeFi #OnchainData $ETH
¡Dune acaba de lanzar feeds de datos en tiempo real que abarcan 200 plataformas de trading on-chain! Esta herramienta conecta los datos on-chain con los sistemas financieros tradicionales, algo ideal para las instituciones que se adentran en el mundo cripto. Con la expansión de los mercados de acciones tokenizadas, ¡la llegada de Dune no podría ser más oportuna! #DeFi #OnchainData $ETH
¡Dune acaba de lanzar feeds de datos en tiempo real que abarcan 200 plataformas de trading on-chain! Esta herramienta conecta los datos on-chain con los sistemas financieros tradicionales, algo ideal para las instituciones que se adentran en el mundo cripto. Con la expansión de los mercados de acciones tokenizadas, ¡la llegada de Dune no podría ser más oportuna! #DeFi #OnchainData $ETH
¡Dune acaba de lanzar feeds de datos en tiempo real que abarcan 200 plataformas de trading on-chain! Esta herramienta conecta los datos on-chain con los sistemas financieros tradicionales, algo ideal para las instituciones que se adentran en el mundo cripto. Con la expansión de los mercados de acciones tokenizadas, ¡la llegada de Dune no podría ser más oportuna! #DeFi #OnchainData $ETH
148

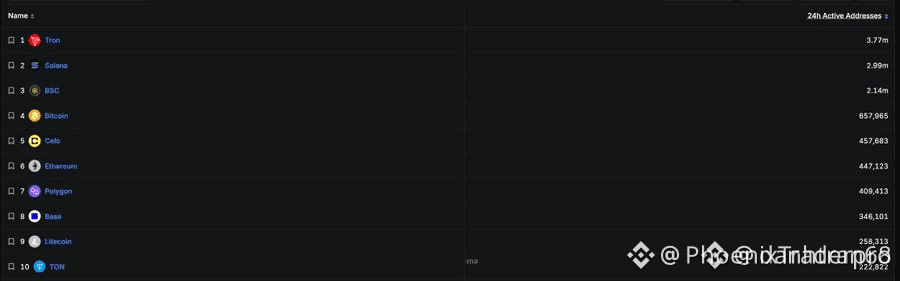
⚡ $TRX DOMINA LAS MÉTRICAS GLOBALES CON 3,77 MILLONES DE DIRECCIONES ACTIVAS EN 24 HORAS! 📈
📊 La velocidad pura en cadena está diferenciando la utilidad real de la red del ruido especulativo. $TRX se aseguró discretamente el primer puesto mundial con 3,77 millones de direcciones activas en un solo día, gestionando más de 30.200 millones de dólares en volumen diario de transferencias de USDT.
🌊 El capital fluye allí donde desaparecen las fricciones de liquidación. Mientras otras cadenas compiten por captar la atención especulativa, TRON ha establecido un dominio casi monopólico en la circulación de monedas estables en el mundo real. 💬 ¿Está a punto el uso de la red en cadena de reflejarse por fin con fuerza en el gráfico? 👇
⚠️ Esto no es asesoramiento financiero. Gestiona siempre tus riesgos. 🛡️
🏷️ #TRX #OnChainData #Stablecoins #CryptoTrading
🎯 🦈
⚡ $TRX DOMINA LAS MÉTRICAS GLOBALES CON 3,77 MILLONES DE DIRECCIONES ACTIVAS EN 24 HORAS! 📈
📊 La velocidad pura en cadena está diferenciando la utilidad real de la red del ruido especulativo. $TRX se aseguró discretamente el primer puesto mundial con 3,77 millones de direcciones activas en un solo día, gestionando más de 30.200 millones de dólares en volumen diario de transferencias de USDT.
🌊 El capital fluye allí donde desaparecen las fricciones de liquidación. Mientras otras cadenas compiten por captar la atención especulativa, TRON ha establecido un dominio casi monopólico en la circulación de monedas estables en el mundo real. 💬 ¿Está a punto el uso de la red en cadena de reflejarse por fin con fuerza en el gráfico? 👇
⚠️ Esto no es asesoramiento financiero. Gestiona siempre tus riesgos. 🛡️
🏷️ #TRX #OnChainData #Stablecoins #CryptoTrading
🎯 🦈
📊 La velocidad pura en cadena está diferenciando la utilidad real de la red del ruido especulativo. $TRX se aseguró discretamente el primer puesto mundial con 3,77 millones de direcciones activas en un solo día, gestionando más de 30.200 millones de dólares en volumen diario de transferencias de USDT.
🌊 El capital fluye allí donde desaparecen las fricciones de liquidación. Mientras otras cadenas compiten por captar la atención especulativa, TRON ha establecido un dominio casi monopólico en la circulación de monedas estables en el mundo real. 💬 ¿Está a punto el uso de la red en cadena de reflejarse por fin con fuerza en el gráfico? 👇
⚠️ Esto no es asesoramiento financiero. Gestiona siempre tus riesgos. 🛡️
🏷️ #TRX #OnChainData #Stablecoins #CryptoTrading
🎯 🦈
6
·
--
Muy bien, gente, aquí @itstrendfinder, listo para echar un vistazo nuevo más allá del ruido diario del mercado, con $ADA más allá de todo eso. Olvidémonos por un momento de los patrones fugaces de los gráficos. Vamos a profundizar en el verdadero pulso de la red para ver qué están haciendo realmente los grandes inversores con sus tenencias, mientras el precio al contado ronda los 0.2151.
Las últimas señales en cadena dibujan un panorama matizado. Lo que más me llama la atención es la constante disminución de las reservas en los exchanges. En los últimos treinta días, hemos observado una salida neta sutil pero persistente de ADA de las plataformas de intercambio centralizadas. No se trata de una salida masiva, pero sí cuenta una historia clara: la oferta se está trasladando poco a poco al almacenamiento en frío, lo que indica una menor presión vendedora inmediata y una marcada preferencia de los holders por la autocustodia.
Si nos centramos en el grupo de ballenas que posee entre mil y diez mil unidades, los cambios en sus saldos se han mantenido relativamente estables, con periodos de acumulación discreta durante las caídas del mercado. Este grupo de inversores sofisticados no está provocando grandes movimientos, pero mantiene sus posiciones de forma constante y las aumenta ligeramente, lo que apunta a una convicción a largo plazo por encima de la especulación a corto plazo.
Desde la perspectiva de la valoración, el MVRV Z-Score se mantiene en una zona saludable, lo que sugiere que el activo no está sobrecalentado y se encuentra cómodamente por debajo de los niveles de euforia. Esto indica que, pese a la volatilidad reciente del mercado, ADA no está sobrevalorado según su precio realizado. En cuanto a la oferta en manos de holders a largo plazo, sigue dominando la cantidad de tokens en circulación: 35.7 mil millones de un suministro máximo de 45 mil millones, lo que significa que la dilución por futuras liberaciones sigue siendo mínima.
Así que, aunque a algunos la evolución del precio les pueda parecer lenta, los datos subyacentes de la cadena apuntan a una sólida base de holders comprometidos y a una acumulación constante fuera de los exchanges. Este tipo de apoyo estructural suele preceder a movimientos macroeconómicos de mayor envergadura.
¿Qué opinan de la convicción actual de los holders de ADA a largo plazo?
#OnChainData #WhaleAlert
Muy bien, gente, aquí @itstrendfinder, listo para echar un vistazo nuevo más allá del ruido diario del mercado, con $ADA más allá de todo eso. Olvidémonos por un momento de los patrones fugaces de los gráficos. Vamos a profundizar en el verdadero pulso de la red para ver qué están haciendo realmente los grandes inversores con sus tenencias, mientras el precio al contado ronda los 0.2151.
Las últimas señales en cadena dibujan un panorama matizado. Lo que más me llama la atención es la constante disminución de las reservas en los exchanges. En los últimos treinta días, hemos observado una salida neta sutil pero persistente de ADA de las plataformas de intercambio centralizadas. No se trata de una salida masiva, pero sí cuenta una historia clara: la oferta se está trasladando poco a poco al almacenamiento en frío, lo que indica una menor presión vendedora inmediata y una marcada preferencia de los holders por la autocustodia.
Si nos centramos en el grupo de ballenas que posee entre mil y diez mil unidades, los cambios en sus saldos se han mantenido relativamente estables, con periodos de acumulación discreta durante las caídas del mercado. Este grupo de inversores sofisticados no está provocando grandes movimientos, pero mantiene sus posiciones de forma constante y las aumenta ligeramente, lo que apunta a una convicción a largo plazo por encima de la especulación a corto plazo.
Desde la perspectiva de la valoración, el MVRV Z-Score se mantiene en una zona saludable, lo que sugiere que el activo no está sobrecalentado y se encuentra cómodamente por debajo de los niveles de euforia. Esto indica que, pese a la volatilidad reciente del mercado, ADA no está sobrevalorado según su precio realizado. En cuanto a la oferta en manos de holders a largo plazo, sigue dominando la cantidad de tokens en circulación: 35.7 mil millones de un suministro máximo de 45 mil millones, lo que significa que la dilución por futuras liberaciones sigue siendo mínima.
Así que, aunque a algunos la evolución del precio les pueda parecer lenta, los datos subyacentes de la cadena apuntan a una sólida base de holders comprometidos y a una acumulación constante fuera de los exchanges. Este tipo de apoyo estructural suele preceder a movimientos macroeconómicos de mayor envergadura.
¿Qué opinan de la convicción actual de los holders de ADA a largo plazo?
#OnChainData #WhaleAlert
Las últimas señales en cadena dibujan un panorama matizado. Lo que más me llama la atención es la constante disminución de las reservas en los exchanges. En los últimos treinta días, hemos observado una salida neta sutil pero persistente de ADA de las plataformas de intercambio centralizadas. No se trata de una salida masiva, pero sí cuenta una historia clara: la oferta se está trasladando poco a poco al almacenamiento en frío, lo que indica una menor presión vendedora inmediata y una marcada preferencia de los holders por la autocustodia.
Si nos centramos en el grupo de ballenas que posee entre mil y diez mil unidades, los cambios en sus saldos se han mantenido relativamente estables, con periodos de acumulación discreta durante las caídas del mercado. Este grupo de inversores sofisticados no está provocando grandes movimientos, pero mantiene sus posiciones de forma constante y las aumenta ligeramente, lo que apunta a una convicción a largo plazo por encima de la especulación a corto plazo.
Desde la perspectiva de la valoración, el MVRV Z-Score se mantiene en una zona saludable, lo que sugiere que el activo no está sobrecalentado y se encuentra cómodamente por debajo de los niveles de euforia. Esto indica que, pese a la volatilidad reciente del mercado, ADA no está sobrevalorado según su precio realizado. En cuanto a la oferta en manos de holders a largo plazo, sigue dominando la cantidad de tokens en circulación: 35.7 mil millones de un suministro máximo de 45 mil millones, lo que significa que la dilución por futuras liberaciones sigue siendo mínima.
Así que, aunque a algunos la evolución del precio les pueda parecer lenta, los datos subyacentes de la cadena apuntan a una sólida base de holders comprometidos y a una acumulación constante fuera de los exchanges. Este tipo de apoyo estructural suele preceder a movimientos macroeconómicos de mayor envergadura.
¿Qué opinan de la convicción actual de los holders de ADA a largo plazo?
#OnChainData #WhaleAlert
1
8

🚨 $MORPHO VE UNA SALIDA DE $2,3 MILLONES MIENTRAS LA EXPOSICIÓN ON-CHAIN SACUDE LA CONFIANZA INSTITUCIONAL! 🔻
🔍 Los flujos forenses on-chain revelan que se desviaron 973.000 tokens $MORPHO de dos billeteras institucionales mediante exploits de delegación EIP-7702, antes de canalizarse directamente hacia protocolos de privacidad. Esto sigue a una salida relacionada de $3,5 millones el 9 de octubre, vinculada al mismo grupo institucional, lo que hace saltar importantes señales de alarma en la custodia de los grandes inversores.
🌊 Cuando los grandes operadores se ven comprometidos, las liquidaciones forzadas y el aumento de la presión vendedora suelen poner a prueba los fondos de liquidez spot hasta que se calme la situación. 💬 ¿Cómo crees que los libros de órdenes absorberán este repentino riesgo de sobreoferta? 👇
⚠️ Esto no es asesoramiento financiero. Gestiona siempre tu riesgo. 🛡️
🏷️ #MORPHO #CryptoSecurity #OnChainData #DeFi
🦈 📉
🚨 $MORPHO VE UNA SALIDA DE $2,3 MILLONES MIENTRAS LA EXPOSICIÓN ON-CHAIN SACUDE LA CONFIANZA INSTITUCIONAL! 🔻
🔍 Los flujos forenses on-chain revelan que se desviaron 973.000 tokens $MORPHO de dos billeteras institucionales mediante exploits de delegación EIP-7702, antes de canalizarse directamente hacia protocolos de privacidad. Esto sigue a una salida relacionada de $3,5 millones el 9 de octubre, vinculada al mismo grupo institucional, lo que hace saltar importantes señales de alarma en la custodia de los grandes inversores.
🌊 Cuando los grandes operadores se ven comprometidos, las liquidaciones forzadas y el aumento de la presión vendedora suelen poner a prueba los fondos de liquidez spot hasta que se calme la situación. 💬 ¿Cómo crees que los libros de órdenes absorberán este repentino riesgo de sobreoferta? 👇
⚠️ Esto no es asesoramiento financiero. Gestiona siempre tu riesgo. 🛡️
🏷️ #MORPHO #CryptoSecurity #OnChainData #DeFi
🦈 📉
🔍 Los flujos forenses on-chain revelan que se desviaron 973.000 tokens $MORPHO de dos billeteras institucionales mediante exploits de delegación EIP-7702, antes de canalizarse directamente hacia protocolos de privacidad. Esto sigue a una salida relacionada de $3,5 millones el 9 de octubre, vinculada al mismo grupo institucional, lo que hace saltar importantes señales de alarma en la custodia de los grandes inversores.
🌊 Cuando los grandes operadores se ven comprometidos, las liquidaciones forzadas y el aumento de la presión vendedora suelen poner a prueba los fondos de liquidez spot hasta que se calme la situación. 💬 ¿Cómo crees que los libros de órdenes absorberán este repentino riesgo de sobreoferta? 👇
⚠️ Esto no es asesoramiento financiero. Gestiona siempre tu riesgo. 🛡️
🏷️ #MORPHO #CryptoSecurity #OnChainData #DeFi
🦈 📉
9

¿Qué datos en cadena te parecen más interesantes?
Las métricas en cadena pueden aportar contexto que quizá no muestren por sí solos los gráficos de precios. Distintas métricas ayudan a los analistas a explorar diferentes preguntas.
📊 Elige tu favorita:
> Direcciones — participación y actividad de la red
> Transacciones — cómo cambia la actividad con el tiempo
> Flujos de exchanges — movimientos entre exchanges y otras carteras
> Ballenas — grandes transferencias y comportamiento de las carteras
💬 Vota y explica tu elección en los comentarios. ¿Qué métrica crees que es más fácil de malinterpretar y por qué?
Recuerda: los datos en cadena aportan contexto, no certeza. Ninguna métrica por sí sola puede revelar de forma fiable las intenciones de todos los participantes.
#onchaindata #blockchain #cryptoeducation #MarketAnalysis
Solo con fines educativos. No es asesoramiento financiero.
¿Qué datos en cadena te parecen más interesantes?
Las métricas en cadena pueden aportar contexto que quizá no muestren por sí solos los gráficos de precios. Distintas métricas ayudan a los analistas a explorar diferentes preguntas.
📊 Elige tu favorita:
> Direcciones — participación y actividad de la red
> Transacciones — cómo cambia la actividad con el tiempo
> Flujos de exchanges — movimientos entre exchanges y otras carteras
> Ballenas — grandes transferencias y comportamiento de las carteras
💬 Vota y explica tu elección en los comentarios. ¿Qué métrica crees que es más fácil de malinterpretar y por qué?
Recuerda: los datos en cadena aportan contexto, no certeza. Ninguna métrica por sí sola puede revelar de forma fiable las intenciones de todos los participantes.
#onchaindata #blockchain #cryptoeducation #MarketAnalysis
Solo con fines educativos. No es asesoramiento financiero.
Las métricas en cadena pueden aportar contexto que quizá no muestren por sí solos los gráficos de precios. Distintas métricas ayudan a los analistas a explorar diferentes preguntas.
📊 Elige tu favorita:
> Direcciones — participación y actividad de la red
> Transacciones — cómo cambia la actividad con el tiempo
> Flujos de exchanges — movimientos entre exchanges y otras carteras
> Ballenas — grandes transferencias y comportamiento de las carteras
💬 Vota y explica tu elección en los comentarios. ¿Qué métrica crees que es más fácil de malinterpretar y por qué?
Recuerda: los datos en cadena aportan contexto, no certeza. Ninguna métrica por sí sola puede revelar de forma fiable las intenciones de todos los participantes.
#onchaindata #blockchain #cryptoeducation #MarketAnalysis
Solo con fines educativos. No es asesoramiento financiero.

35

todo el mundo piensa que bitcoin es el activo más transparente del mundo cripto porque la cadena es pública, pero en realidad más del 50 % de todos los $btc está en billeteras que nadie puede identificar.
¿Alguna vez te quedaste mirando los datos on-chain, pensando que sabes exactamente quién tiene qué, y de repente te llevaste un golpe cuando una billetera fantasma movió una cantidad enorme? La mayoría de los traders no tiene ni idea de que está operando a ciegas en cuanto a quién posee realmente qué.
Más de la mitad de todo el suministro de bitcoin está en direcciones que nunca se han vinculado con una persona o institución real. Puedes rastrear cada transacción y cada satoshi, pero vincular esas direcciones con nombres es otro asunto completamente distinto.
Algunas de estas billeteras contienen monedas perdidas desde 2009. Otras son mesas OTC silenciosas. Algunas podrían pertenecer a estados acumulando bitcoin. La verdad, el panorama es mucho más complicado de lo que te hacen creer.
Por eso, a veces seguir las etiquetas de las ballenas de $eth o incluso los flujos de $usdt te da más ventaja que quedarte mirando grupos de direcciones de $btc sin etiquetar. Los datos están ahí. Las identidades, no.
¿Alguien más ve esto como un riesgo mayor de lo que la gente admite?
#Bitcoin #OnChainData #Crypto
todo el mundo piensa que bitcoin es el activo más transparente del mundo cripto porque la cadena es pública, pero en realidad más del 50 % de todos los $btc está en billeteras que nadie puede identificar.
¿Alguna vez te quedaste mirando los datos on-chain, pensando que sabes exactamente quién tiene qué, y de repente te llevaste un golpe cuando una billetera fantasma movió una cantidad enorme? La mayoría de los traders no tiene ni idea de que está operando a ciegas en cuanto a quién posee realmente qué.
Más de la mitad de todo el suministro de bitcoin está en direcciones que nunca se han vinculado con una persona o institución real. Puedes rastrear cada transacción y cada satoshi, pero vincular esas direcciones con nombres es otro asunto completamente distinto.
Algunas de estas billeteras contienen monedas perdidas desde 2009. Otras son mesas OTC silenciosas. Algunas podrían pertenecer a estados acumulando bitcoin. La verdad, el panorama es mucho más complicado de lo que te hacen creer.
Por eso, a veces seguir las etiquetas de las ballenas de $eth o incluso los flujos de $usdt te da más ventaja que quedarte mirando grupos de direcciones de $btc sin etiquetar. Los datos están ahí. Las identidades, no.
¿Alguien más ve esto como un riesgo mayor de lo que la gente admite?
#Bitcoin #OnChainData #Crypto
¿Alguna vez te quedaste mirando los datos on-chain, pensando que sabes exactamente quién tiene qué, y de repente te llevaste un golpe cuando una billetera fantasma movió una cantidad enorme? La mayoría de los traders no tiene ni idea de que está operando a ciegas en cuanto a quién posee realmente qué.
Más de la mitad de todo el suministro de bitcoin está en direcciones que nunca se han vinculado con una persona o institución real. Puedes rastrear cada transacción y cada satoshi, pero vincular esas direcciones con nombres es otro asunto completamente distinto.
Algunas de estas billeteras contienen monedas perdidas desde 2009. Otras son mesas OTC silenciosas. Algunas podrían pertenecer a estados acumulando bitcoin. La verdad, el panorama es mucho más complicado de lo que te hacen creer.
Por eso, a veces seguir las etiquetas de las ballenas de $eth o incluso los flujos de $usdt te da más ventaja que quedarte mirando grupos de direcciones de $btc sin etiquetar. Los datos están ahí. Las identidades, no.
¿Alguien más ve esto como un riesgo mayor de lo que la gente admite?
#Bitcoin #OnChainData #Crypto

1
En cadena: qué nos puede decir la actividad de la cadena de bloques más allá del precio
Los gráficos de precios muestran cómo se mueve el mercado. Los datos en cadena pueden ayudarnos a investigar qué ocurre en la propia cadena de bloques.
En lugar de fijarse únicamente en el precio, los analistas pueden estudiar la actividad de la red, el comportamiento de las transacciones y el movimiento de los activos digitales.
🔹 1. Direcciones activas
Las direcciones activas son aquellas que participan en transacciones durante un período determinado. Los cambios pueden dar pistas sobre la participación en la red, pero una persona puede controlar varias direcciones, y la actividad no siempre representa a nuevos usuarios.
🔹 2. Actividad de las transacciones
La cantidad y el volumen de las transacciones pueden ayudar a describir cómo se utiliza una red. Sin embargo, la actividad automatizada, las transferencias internas y las diferencias entre redes pueden afectar a la interpretación.
🔹 3. Flujos de los exchanges
Los depósitos en exchanges y los retiros de estos pueden ayudar a los analistas a entender cómo se mueven los activos entre plataformas y otras billeteras. Estos movimientos no revelan automáticamente si alguien tiene la intención de comprar o vender.
🔹 4. Actividad de las ballenas
Las transferencias grandes pueden llamar la atención porque implican cantidades considerables de criptomonedas. Pero una transacción grande podría ser una transferencia a un exchange, un movimiento de custodia o una reorganización interna de billeteras; no necesariamente una señal del mercado.
¿Cómo deberías usar los datos en cadena?
✅ Compara los cambios a lo largo del tiempo en vez de basarte en una sola lectura.
✅ Consulta la definición de la métrica y la fuente de los datos.
✅ Compara la actividad con el precio, el volumen, la liquidez y las condiciones generales del mercado.
✅ Recuerda que la transparencia de la cadena de bloques no revela la identidad ni las intenciones de todos los propietarios de billeteras.
Conclusión clave: Los datos en cadena aportan otra capa de contexto al análisis del mercado. Son más útiles cuando se combinan con otras pruebas, no cuando se tratan como una herramienta de predicción.
💬 Pregunta: ¿Qué métrica en cadena te parece más interesante:
direcciones activas, transacciones, flujos de exchanges o actividad de las ballenas?
Sigue a Crypto With Ali para aprender sobre criptomonedas de forma clara y práctica.
Contenido educativo únicamente. No es asesoramiento financiero.
#onchaindata #blockchaineconomy #cryptoeducation
En cadena: qué nos puede decir la actividad de la cadena de bloques más allá del precio
Los gráficos de precios muestran cómo se mueve el mercado. Los datos en cadena pueden ayudarnos a investigar qué ocurre en la propia cadena de bloques.
En lugar de fijarse únicamente en el precio, los analistas pueden estudiar la actividad de la red, el comportamiento de las transacciones y el movimiento de los activos digitales.
🔹 1. Direcciones activas
Las direcciones activas son aquellas que participan en transacciones durante un período determinado. Los cambios pueden dar pistas sobre la participación en la red, pero una persona puede controlar varias direcciones, y la actividad no siempre representa a nuevos usuarios.
🔹 2. Actividad de las transacciones
La cantidad y el volumen de las transacciones pueden ayudar a describir cómo se utiliza una red. Sin embargo, la actividad automatizada, las transferencias internas y las diferencias entre redes pueden afectar a la interpretación.
🔹 3. Flujos de los exchanges
Los depósitos en exchanges y los retiros de estos pueden ayudar a los analistas a entender cómo se mueven los activos entre plataformas y otras billeteras. Estos movimientos no revelan automáticamente si alguien tiene la intención de comprar o vender.
🔹 4. Actividad de las ballenas
Las transferencias grandes pueden llamar la atención porque implican cantidades considerables de criptomonedas. Pero una transacción grande podría ser una transferencia a un exchange, un movimiento de custodia o una reorganización interna de billeteras; no necesariamente una señal del mercado.
¿Cómo deberías usar los datos en cadena?
✅ Compara los cambios a lo largo del tiempo en vez de basarte en una sola lectura.
✅ Consulta la definición de la métrica y la fuente de los datos.
✅ Compara la actividad con el precio, el volumen, la liquidez y las condiciones generales del mercado.
✅ Recuerda que la transparencia de la cadena de bloques no revela la identidad ni las intenciones de todos los propietarios de billeteras.
Conclusión clave: Los datos en cadena aportan otra capa de contexto al análisis del mercado. Son más útiles cuando se combinan con otras pruebas, no cuando se tratan como una herramienta de predicción.
💬 Pregunta: ¿Qué métrica en cadena te parece más interesante:
direcciones activas, transacciones, flujos de exchanges o actividad de las ballenas?
Sigue a Crypto With Ali para aprender sobre criptomonedas de forma clara y práctica.
Contenido educativo únicamente. No es asesoramiento financiero.
#onchaindata #blockchaineconomy #cryptoeducation
Los gráficos de precios muestran cómo se mueve el mercado. Los datos en cadena pueden ayudarnos a investigar qué ocurre en la propia cadena de bloques.
En lugar de fijarse únicamente en el precio, los analistas pueden estudiar la actividad de la red, el comportamiento de las transacciones y el movimiento de los activos digitales.
🔹 1. Direcciones activas
Las direcciones activas son aquellas que participan en transacciones durante un período determinado. Los cambios pueden dar pistas sobre la participación en la red, pero una persona puede controlar varias direcciones, y la actividad no siempre representa a nuevos usuarios.
🔹 2. Actividad de las transacciones
La cantidad y el volumen de las transacciones pueden ayudar a describir cómo se utiliza una red. Sin embargo, la actividad automatizada, las transferencias internas y las diferencias entre redes pueden afectar a la interpretación.
🔹 3. Flujos de los exchanges
Los depósitos en exchanges y los retiros de estos pueden ayudar a los analistas a entender cómo se mueven los activos entre plataformas y otras billeteras. Estos movimientos no revelan automáticamente si alguien tiene la intención de comprar o vender.
🔹 4. Actividad de las ballenas
Las transferencias grandes pueden llamar la atención porque implican cantidades considerables de criptomonedas. Pero una transacción grande podría ser una transferencia a un exchange, un movimiento de custodia o una reorganización interna de billeteras; no necesariamente una señal del mercado.
¿Cómo deberías usar los datos en cadena?
✅ Compara los cambios a lo largo del tiempo en vez de basarte en una sola lectura.
✅ Consulta la definición de la métrica y la fuente de los datos.
✅ Compara la actividad con el precio, el volumen, la liquidez y las condiciones generales del mercado.
✅ Recuerda que la transparencia de la cadena de bloques no revela la identidad ni las intenciones de todos los propietarios de billeteras.
Conclusión clave: Los datos en cadena aportan otra capa de contexto al análisis del mercado. Son más útiles cuando se combinan con otras pruebas, no cuando se tratan como una herramienta de predicción.
💬 Pregunta: ¿Qué métrica en cadena te parece más interesante:
direcciones activas, transacciones, flujos de exchanges o actividad de las ballenas?
Sigue a Crypto With Ali para aprender sobre criptomonedas de forma clara y práctica.
Contenido educativo únicamente. No es asesoramiento financiero.
#onchaindata #blockchaineconomy #cryptoeducation

60
·
--
Las métricas on-chain de Sui revelan una acumulación institucional significativa
Mientras muchos traders se quedan mirando el ruido de cada hora, el verdadero movimiento de $SUI está ocurriendo bajo la superficie, en los datos de retiros de almacenamiento en frío. Durante los últimos 14 días, se ha registrado una salida neta constante de los principales exchanges. Esto suele apuntar a una sola cosa: el dinero inteligente está trasladando activos a custodia privada, reduciendo así la oferta líquida disponible en el mercado abierto.
Al observar los grupos de billeteras, el que tiene saldos de entre 1.000 y 10.000 unidades muestra patrones de absorción agresivos. A diferencia de los repuntes impulsados por el público minorista que solemos ver, esto es una acumulación calculada. La proporción de oferta en manos de holders a largo plazo está aumentando actualmente, lo que significa que los tokens están pasando a manos con un costo base mucho más alto y menos disposición a vender ante pequeñas fluctuaciones de precio. Este cambio estructural para SUI está respaldado por el MVRV Z-Score, que confirma que el activo está lejos de una valoración sobrecalentada, pese a su reciente resiliencia.
Lo que me parece más interesante es cómo ha reaccionado el mercado al calendario reciente de emisión de tokens. Por lo general, los grandes desbloqueos ejercen una enorme presión sobre el precio, pero la profundidad de la demanda en la cadena está absorbiendo estos tokens con facilidad. Esto sugiere que las entidades institucionales están estabilizando activamente el soporte en torno a la marca de 1,038, posicionándose para un cambio de ciclo mucho mayor en lugar de buscar solo una ganancia rápida. La falta de nuevos depósitos de SUI en los exchanges es la señal más clara hasta ahora de que la presión vendedora está disminuyendo.
¿Estás siguiendo estos movimientos de las ballenas en tiempo real o solo reaccionas a las velas diarias de precios?
_
#OnChainData #WhaleAlert
Las métricas on-chain de Sui revelan una acumulación institucional significativa
Mientras muchos traders se quedan mirando el ruido de cada hora, el verdadero movimiento de $SUI está ocurriendo bajo la superficie, en los datos de retiros de almacenamiento en frío. Durante los últimos 14 días, se ha registrado una salida neta constante de los principales exchanges. Esto suele apuntar a una sola cosa: el dinero inteligente está trasladando activos a custodia privada, reduciendo así la oferta líquida disponible en el mercado abierto.
Al observar los grupos de billeteras, el que tiene saldos de entre 1.000 y 10.000 unidades muestra patrones de absorción agresivos. A diferencia de los repuntes impulsados por el público minorista que solemos ver, esto es una acumulación calculada. La proporción de oferta en manos de holders a largo plazo está aumentando actualmente, lo que significa que los tokens están pasando a manos con un costo base mucho más alto y menos disposición a vender ante pequeñas fluctuaciones de precio. Este cambio estructural para SUI está respaldado por el MVRV Z-Score, que confirma que el activo está lejos de una valoración sobrecalentada, pese a su reciente resiliencia.
Lo que me parece más interesante es cómo ha reaccionado el mercado al calendario reciente de emisión de tokens. Por lo general, los grandes desbloqueos ejercen una enorme presión sobre el precio, pero la profundidad de la demanda en la cadena está absorbiendo estos tokens con facilidad. Esto sugiere que las entidades institucionales están estabilizando activamente el soporte en torno a la marca de 1,038, posicionándose para un cambio de ciclo mucho mayor en lugar de buscar solo una ganancia rápida. La falta de nuevos depósitos de SUI en los exchanges es la señal más clara hasta ahora de que la presión vendedora está disminuyendo.
¿Estás siguiendo estos movimientos de las ballenas en tiempo real o solo reaccionas a las velas diarias de precios?
_
#OnChainData #WhaleAlert
Mientras muchos traders se quedan mirando el ruido de cada hora, el verdadero movimiento de $SUI está ocurriendo bajo la superficie, en los datos de retiros de almacenamiento en frío. Durante los últimos 14 días, se ha registrado una salida neta constante de los principales exchanges. Esto suele apuntar a una sola cosa: el dinero inteligente está trasladando activos a custodia privada, reduciendo así la oferta líquida disponible en el mercado abierto.
Al observar los grupos de billeteras, el que tiene saldos de entre 1.000 y 10.000 unidades muestra patrones de absorción agresivos. A diferencia de los repuntes impulsados por el público minorista que solemos ver, esto es una acumulación calculada. La proporción de oferta en manos de holders a largo plazo está aumentando actualmente, lo que significa que los tokens están pasando a manos con un costo base mucho más alto y menos disposición a vender ante pequeñas fluctuaciones de precio. Este cambio estructural para SUI está respaldado por el MVRV Z-Score, que confirma que el activo está lejos de una valoración sobrecalentada, pese a su reciente resiliencia.
Lo que me parece más interesante es cómo ha reaccionado el mercado al calendario reciente de emisión de tokens. Por lo general, los grandes desbloqueos ejercen una enorme presión sobre el precio, pero la profundidad de la demanda en la cadena está absorbiendo estos tokens con facilidad. Esto sugiere que las entidades institucionales están estabilizando activamente el soporte en torno a la marca de 1,038, posicionándose para un cambio de ciclo mucho mayor en lugar de buscar solo una ganancia rápida. La falta de nuevos depósitos de SUI en los exchanges es la señal más clara hasta ahora de que la presión vendedora está disminuyendo.
¿Estás siguiendo estos movimientos de las ballenas en tiempo real o solo reaccionas a las velas diarias de precios?
_
#OnChainData #WhaleAlert

5

·
--
🚨 $BTC VIGILANCIA DE LIQUIDEZ ON-CHAIN: DESMANTELAN EN EUROPA UNA RED DE FLUJOS ILÍCITOS POR VALOR DE 68 M€ 🔍
Las agencias europeas encargadas de hacer cumplir la ley han interceptado un circuito coordinado de banca en la sombra que movía 68 millones de euros a través de canales transfronterizos ilícitos, utilizando activos digitales y grandes plataformas de intercambio para ocultar flujos de capital fuera de la cadena. 🏦 La operación se extendió por Italia, España y Suiza, y puso de relieve la mayor precisión en el rastreo de las rutas de liquidez opaca.
Desde una perspectiva institucional, el aumento de la supervisión forense seca sistemáticamente los fondos de liquidez extrabursátiles y refuerza los canales de acceso que cumplen la normativa. 📊 A medida que se intensifican las auditorías on-chain en las jurisdicciones europeas, el flujo estructural de órdenes termina consolidándose inevitablemente en vías plenamente reguladas. 💬 ¿Cómo afectará una supervisión global más estricta a la velocidad general de la liquidez en el mercado? 👇
⚠️ Esto no es asesoramiento financiero. Gestione siempre sus riesgos. 🛡️
🏷️ #BTC #CryptoRegulation #MarketStructure #OnChainData
🎯 🦈
🚨 $BTC VIGILANCIA DE LIQUIDEZ ON-CHAIN: DESMANTELAN EN EUROPA UNA RED DE FLUJOS ILÍCITOS POR VALOR DE 68 M€ 🔍
Las agencias europeas encargadas de hacer cumplir la ley han interceptado un circuito coordinado de banca en la sombra que movía 68 millones de euros a través de canales transfronterizos ilícitos, utilizando activos digitales y grandes plataformas de intercambio para ocultar flujos de capital fuera de la cadena. 🏦 La operación se extendió por Italia, España y Suiza, y puso de relieve la mayor precisión en el rastreo de las rutas de liquidez opaca.
Desde una perspectiva institucional, el aumento de la supervisión forense seca sistemáticamente los fondos de liquidez extrabursátiles y refuerza los canales de acceso que cumplen la normativa. 📊 A medida que se intensifican las auditorías on-chain en las jurisdicciones europeas, el flujo estructural de órdenes termina consolidándose inevitablemente en vías plenamente reguladas. 💬 ¿Cómo afectará una supervisión global más estricta a la velocidad general de la liquidez en el mercado? 👇
⚠️ Esto no es asesoramiento financiero. Gestione siempre sus riesgos. 🛡️
🏷️ #BTC #CryptoRegulation #MarketStructure #OnChainData
🎯 🦈
Las agencias europeas encargadas de hacer cumplir la ley han interceptado un circuito coordinado de banca en la sombra que movía 68 millones de euros a través de canales transfronterizos ilícitos, utilizando activos digitales y grandes plataformas de intercambio para ocultar flujos de capital fuera de la cadena. 🏦 La operación se extendió por Italia, España y Suiza, y puso de relieve la mayor precisión en el rastreo de las rutas de liquidez opaca.
Desde una perspectiva institucional, el aumento de la supervisión forense seca sistemáticamente los fondos de liquidez extrabursátiles y refuerza los canales de acceso que cumplen la normativa. 📊 A medida que se intensifican las auditorías on-chain en las jurisdicciones europeas, el flujo estructural de órdenes termina consolidándose inevitablemente en vías plenamente reguladas. 💬 ¿Cómo afectará una supervisión global más estricta a la velocidad general de la liquidez en el mercado? 👇
⚠️ Esto no es asesoramiento financiero. Gestione siempre sus riesgos. 🛡️
🏷️ #BTC #CryptoRegulation #MarketStructure #OnChainData
🎯 🦈
14
Inicia sesión para explorar más contenidos
Únete a usuarios globales de criptomonedas en Binance Square
⚡️ Obtén información útil y actualizada sobre criptos.
💬 Avalado por el mayor exchange de criptomonedas en el mundo.
👍 Descubre perspectivas reales de creadores verificados.
Email/número de teléfono
Temas populares
1
#BinancePick
3M vistas
151,729 están debatiendo
2
#EarningsSeason
5.2M vistas
25,792 están debatiendo
3
#AnthropicTTMRevenueGrewAbout1200%
18,994 vistas
333 están debatiendo
4
#AnthropicS1ExpectedToday
20,461 vistas
296 están debatiendo
5
#SouthKoreaReportedlyWeighsFourthCryptoTaxDelay
25,433 vistas
416 están debatiendo
6
#FranklinTempletonFilesForTwoDividendToBitcoinETFs
33,564 vistas
511 están debatiendo
7
#StrategyMSTRSurpassesNasdaqInMarketCap
25,820 vistas
371 están debatiendo
8
#CanadaProposesStablecoinRedemptionWithin3BusinessDays
1,177 vistas
34 están debatiendo
9
#ElectrumWalletBugLetRogueServersStealFunds
27,339 vistas
448 están debatiendo
10
#ArgentineCourtDismissesLIBRACaseAgainstMilei
41,564 vistas
553 están debatiendo