

Huutruong
10.3k Publicaciones

Huutruong
Denunciar
Bloquear usuario
💰 Theo dõi Crypto | Tìm kiếm cơ hội mỗi ngày ( KITE-277880 )
Abrir trade
Trader frecuente
5.5 año(s)
3.6K+ Siguiendo
2.4K+ Seguidores
846 Me gusta
Publicaciones
Cartera
Todo
Citas
Videos
Live
·
--
Bajista
Ver traducción
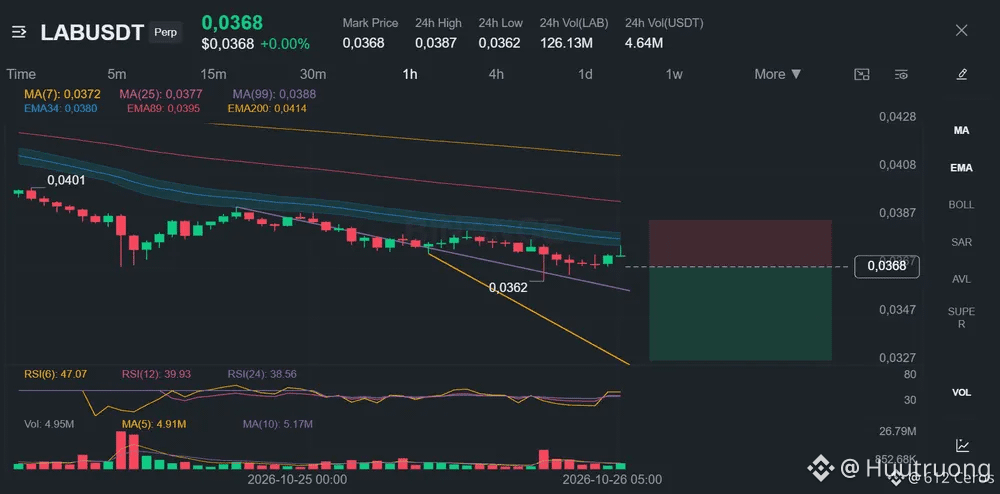
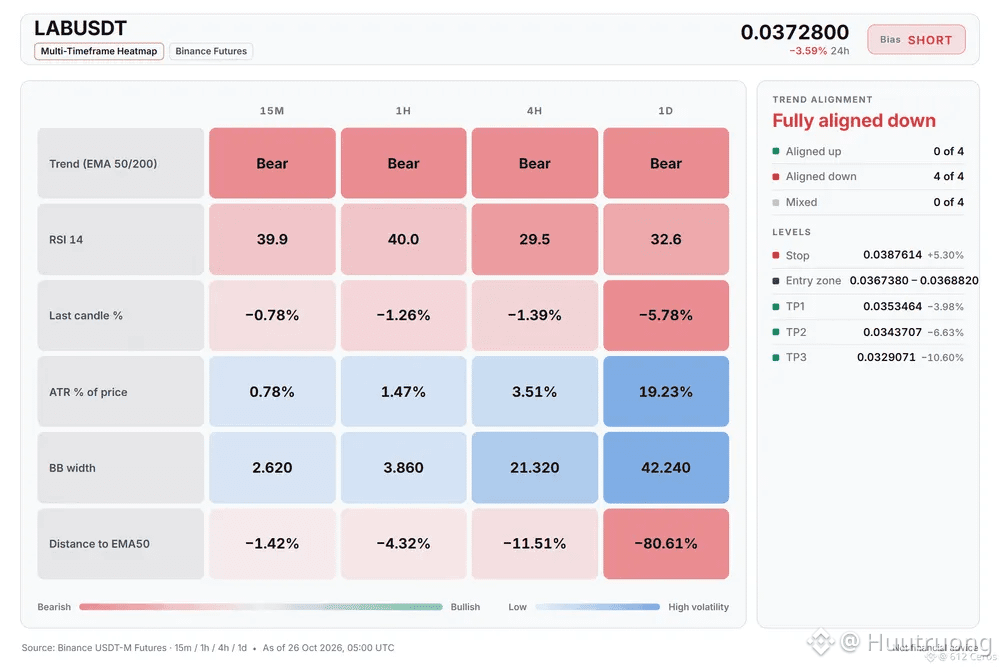
LAB is deep in a bearish stack across every trend
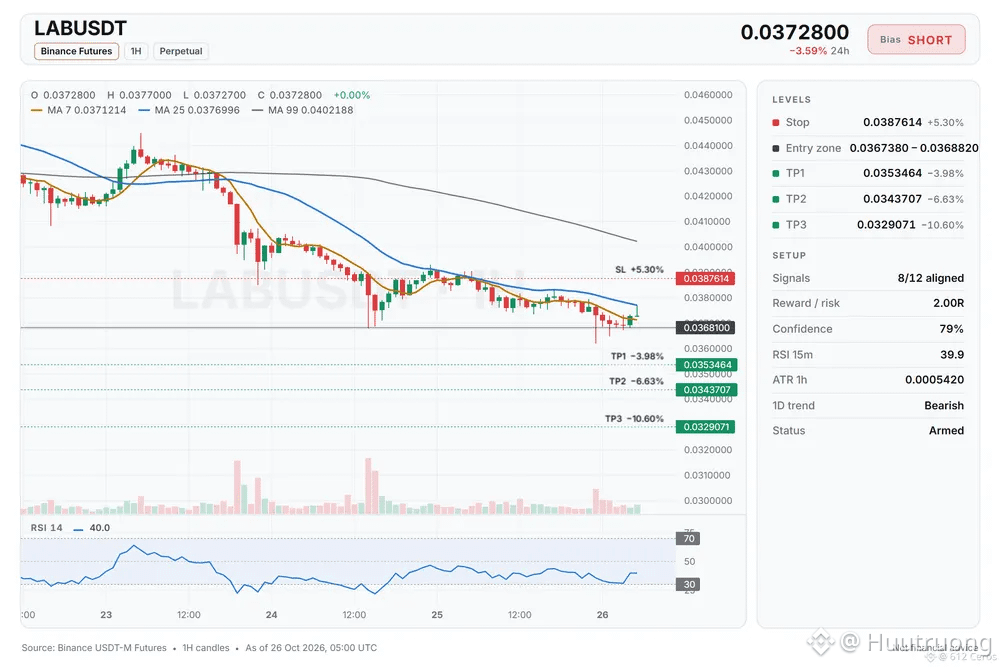
🔴 SHORT $LAB /USDT: expecting price to go DOWN
Bias: SHORT · Strong
Entry: 0.0367380 – 0.0368820
TP1: 0.0353464 (-4.0%)
TP2: 0.0343707 (-6.6%)
TP3: 0.0329071 (-10.6%)
SL: 0.0387614 (+5.3%)
Plan: enter only inside the zone, close 50% at TP1, 25% at TP2, 25% at TP3, and move the stop to entry after TP1.
Why SHORT? LAB checklist: 8/12 agree, 1 against.
• Daily trend down (below EMA50 & EMA200)
• 4h trend down (below EMA50 & EMA200)
• 1h trend down (below EMA50 & EMA200)
Watch: Far below its average, bounce likely (−3.1 ATR from 1h EMA50)
Watch: The idea is wrong if price reaches the stop at 0.0387614
Bottom line: The daily bearish stack (price below both EMAs) is the strongest sign, but price is 3.1 ATR below the 1h EMA50, which means a bounce is likely
Where is your invalidation level if this short fails?
4
·
--
Bajista
Ver traducción
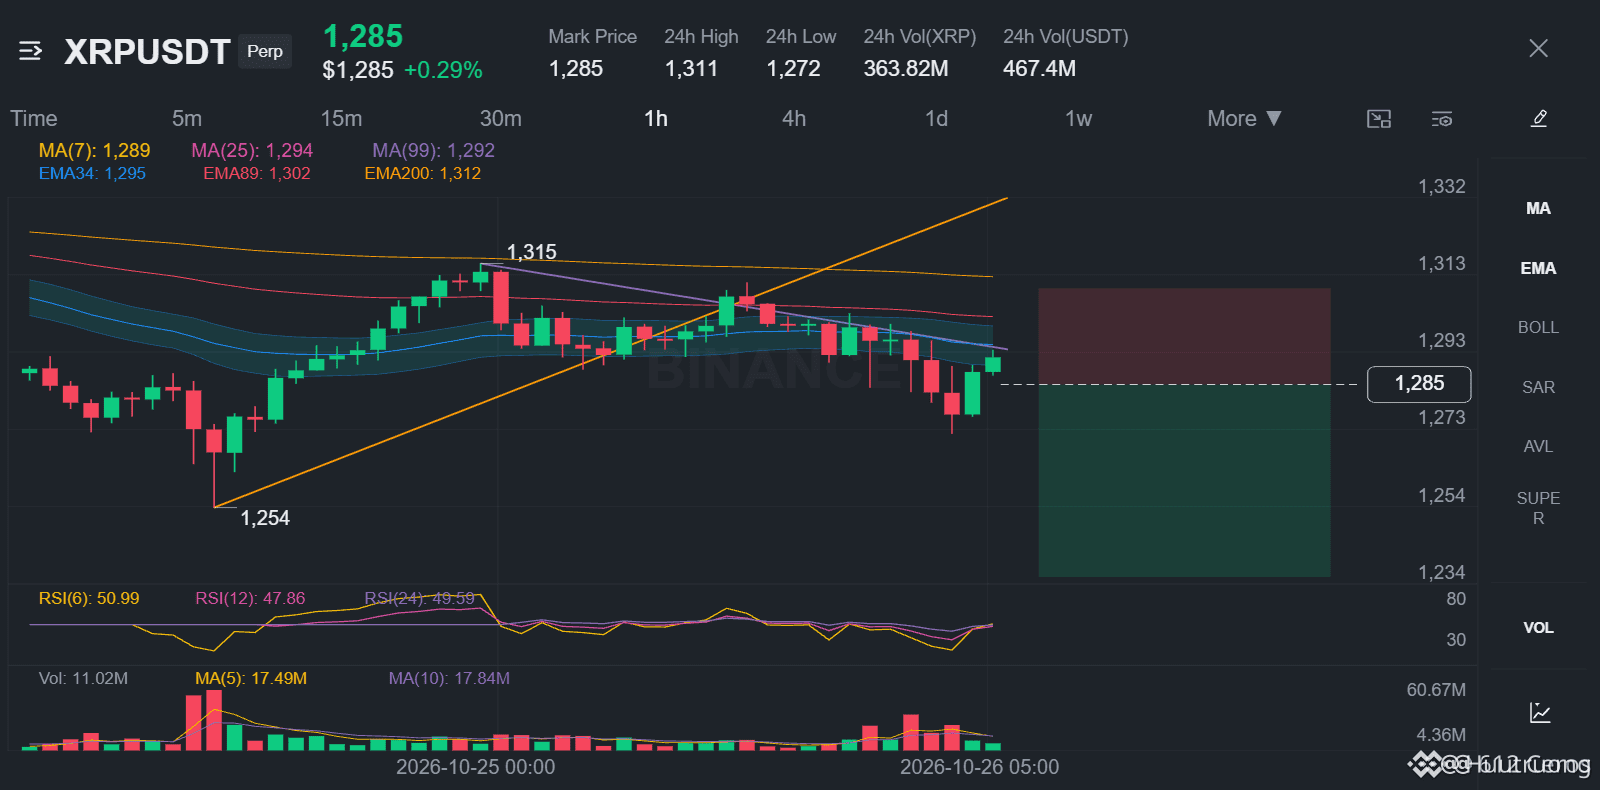
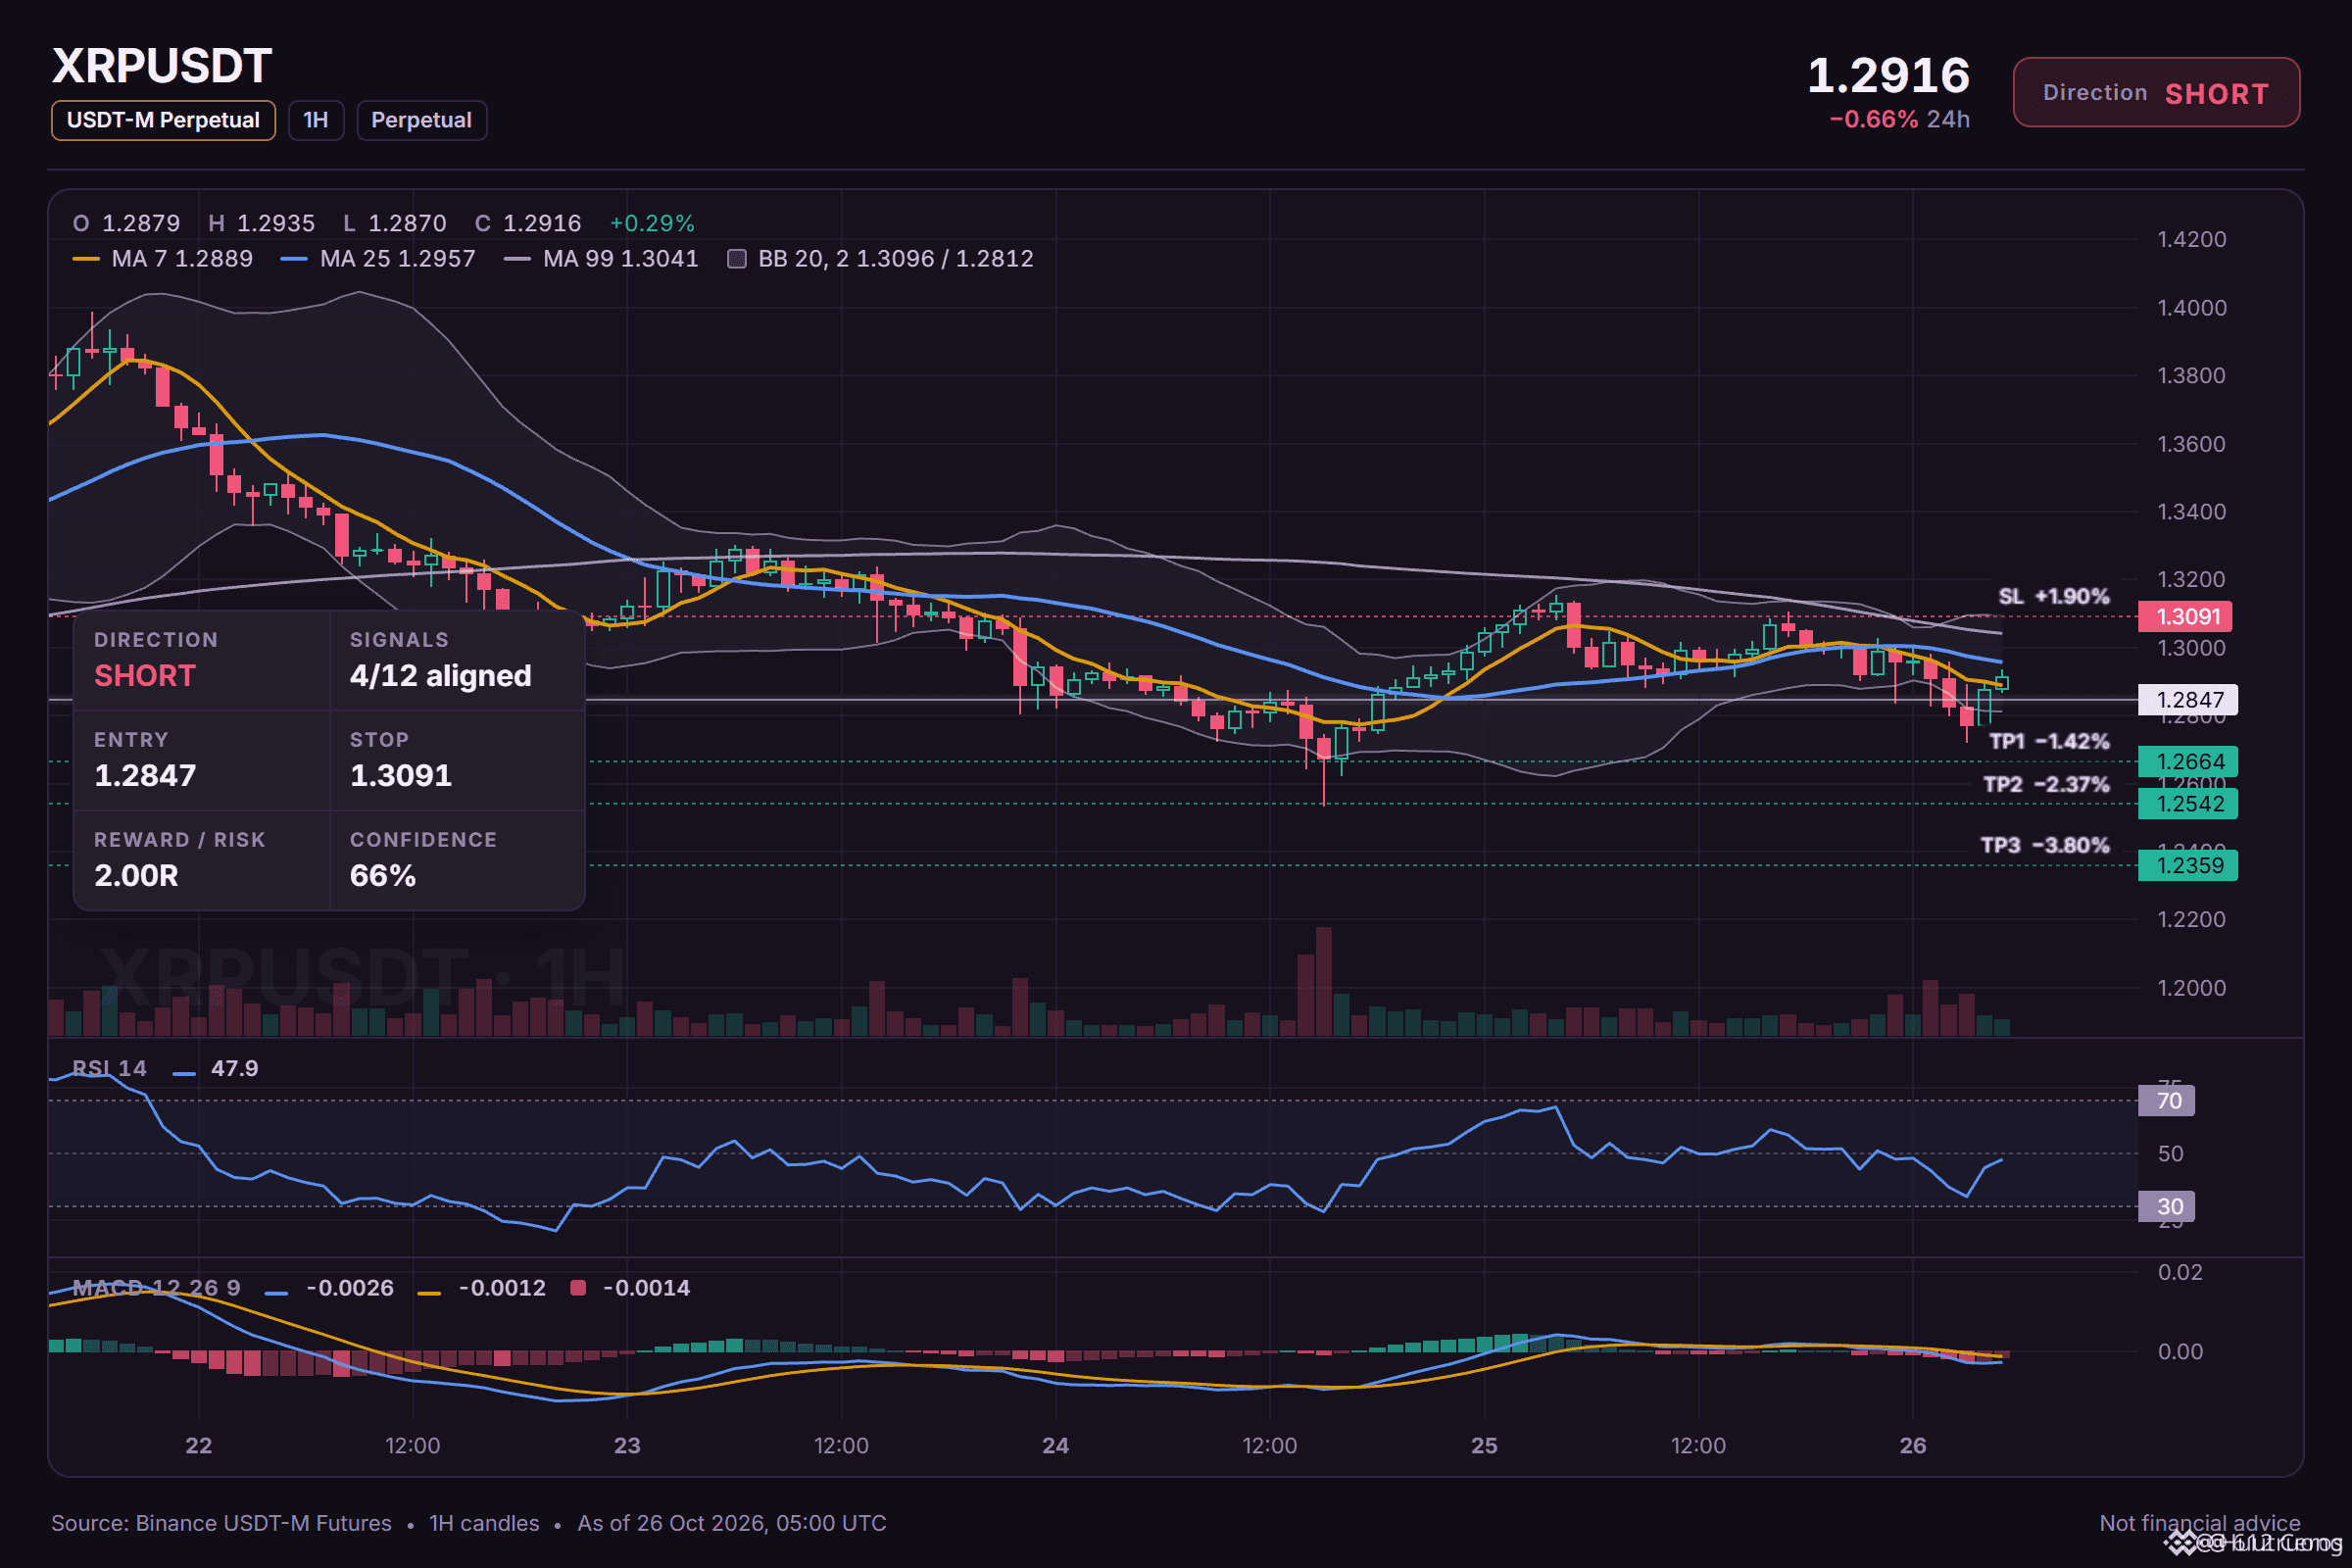
XRP stays below a stacked EMA ribbon on the 4h
🔴 SHORT $XRP /USDT: expecting price to go DOWN
Bias: SHORT · Leaning
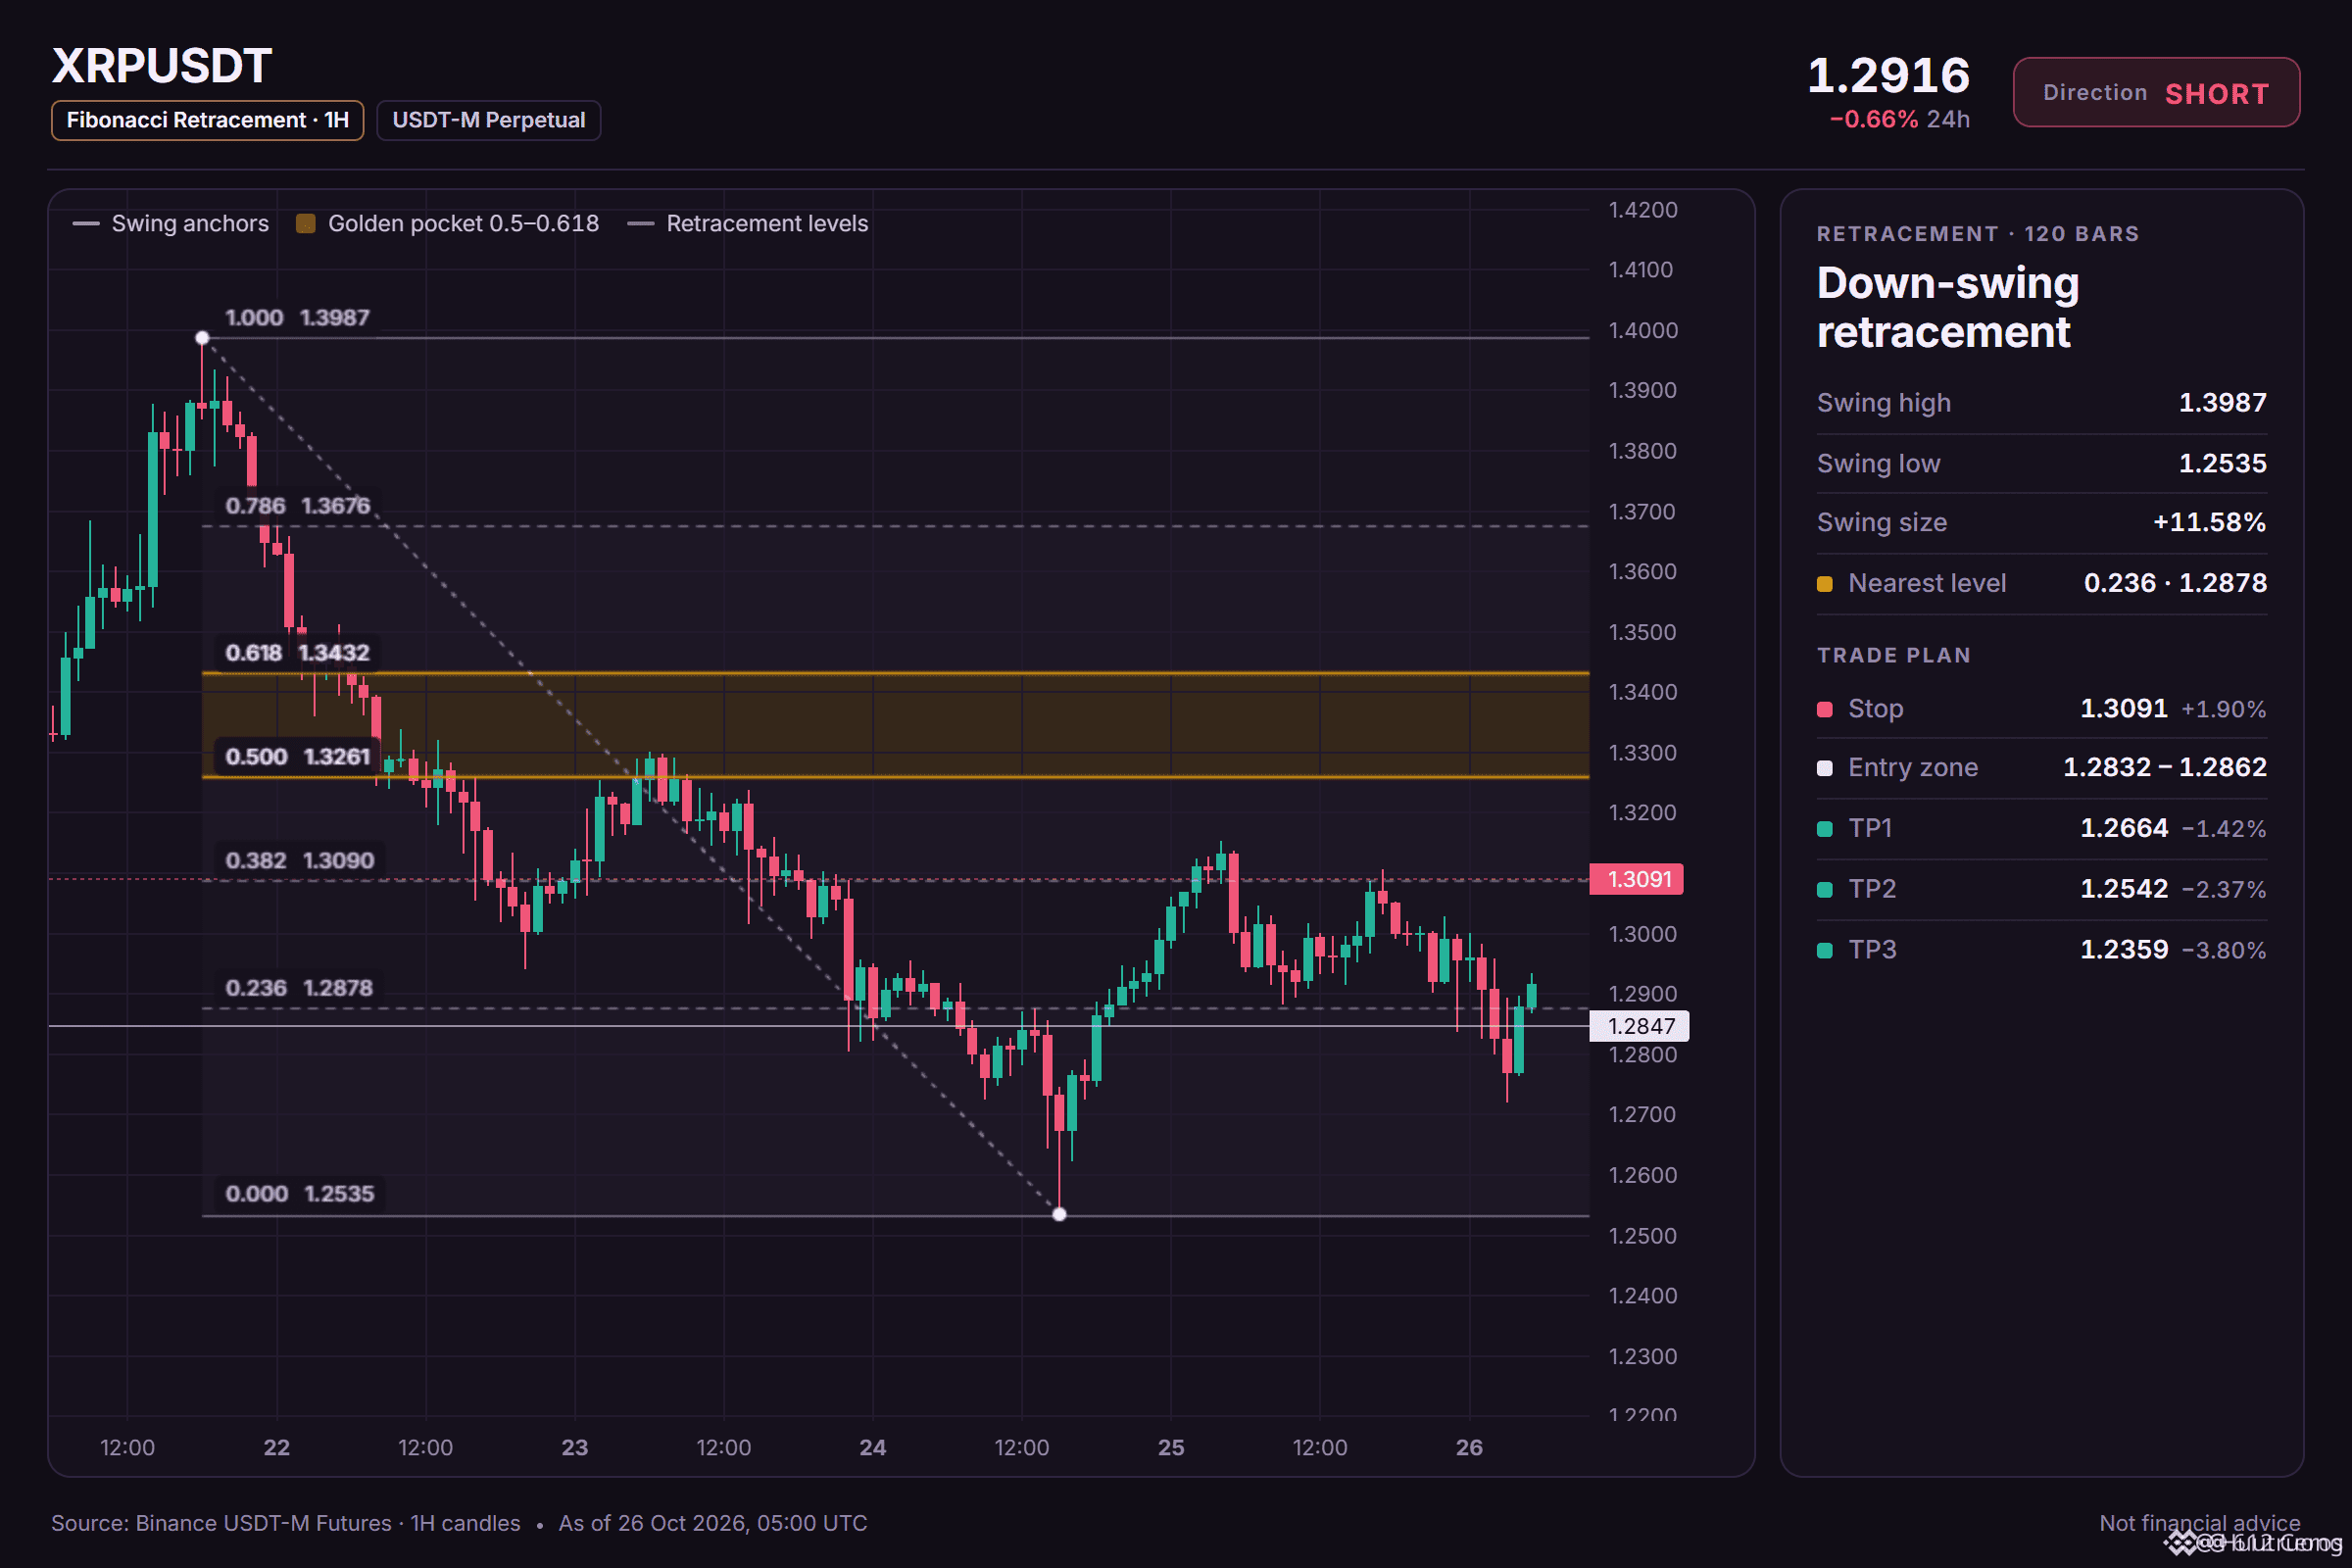
Entry: 1.2832 – 1.2862
TP1: 1.2664 (-1.4%)
TP2: 1.2542 (-2.4%)
TP3: 1.2359 (-3.8%)
SL: 1.3091 (+1.9%)
Plan: enter only inside the zone, close 50% at TP1, 25% at TP2, 25% at TP3, and move the stop to entry after TP1.
Note: moderate conviction only, keep size light.
Why SHORT? 4/12 signals agree, 0 against.
• 4h trend down (below EMA50 & EMA200)
• 1h trend down (below EMA50 & EMA200)
• Sellers are driving the move (15m ADX 25.8)
The short version:
1. the 4h trend shows price below EMA50 and EMA200, a bearish stack suggesting the swing is down.
2. the 1h trend also has price below EMA50 and EMA200, so the short-term trend is down too.
3. the 4h RSI sits at 38.1, bearish momentum below 45, but the daily range makes the move less decisive.
Where would you set your level if you disagreed?
4
·
--
Bajista
Ver traducción
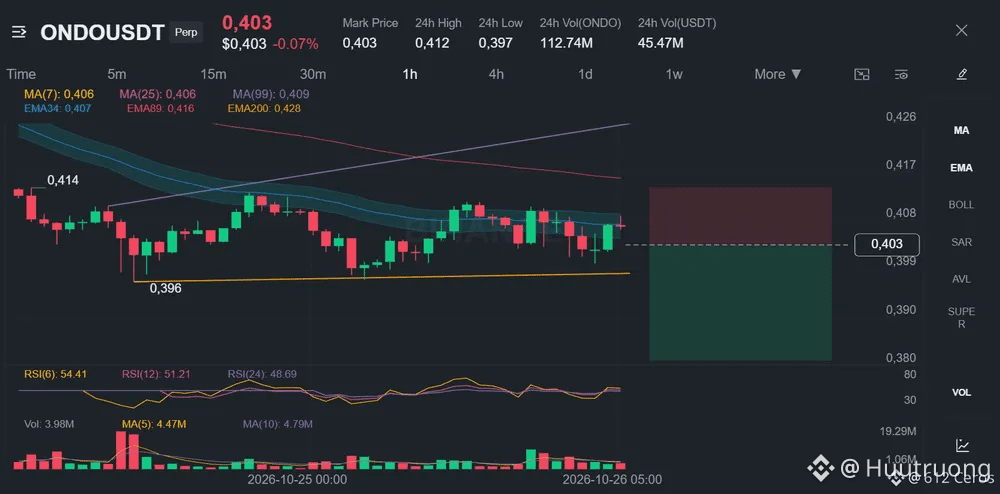
Range-bound coins often trap longs into fading moves.
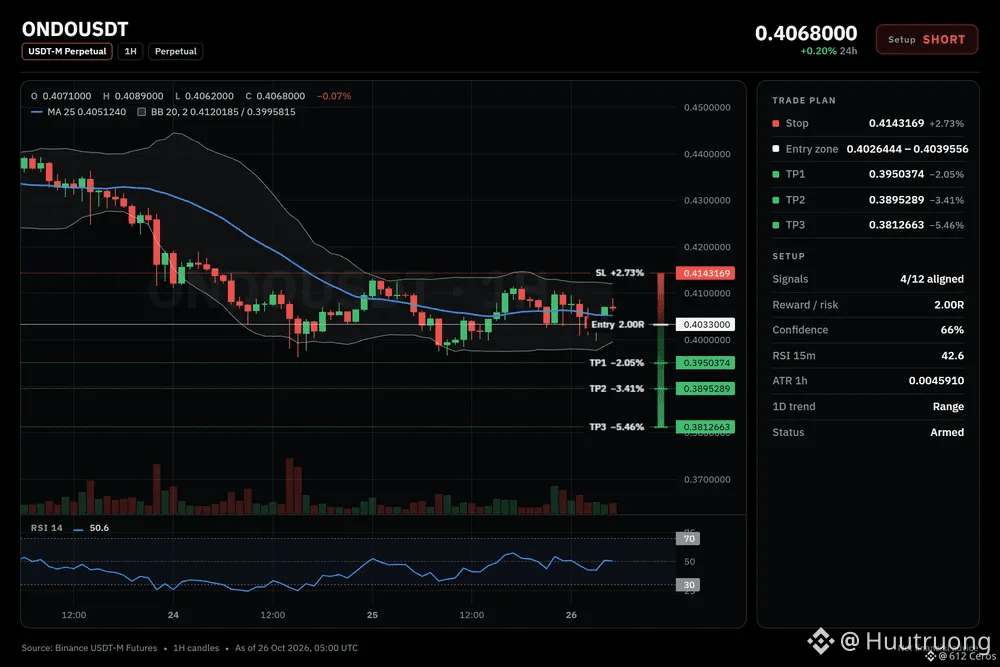
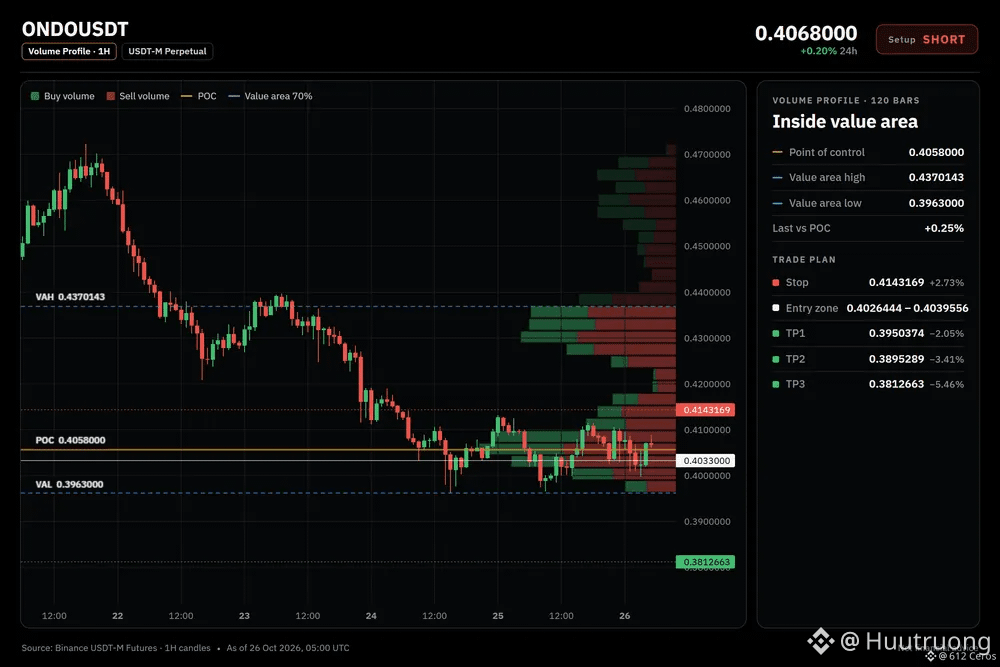
🔴 SHORT $ONDO /USDT: expecting price to go DOWN
Bias: SHORT · Leaning
Entry: 0.4026444 – 0.4039556
TP1: 0.3950374 (-2.0%)
TP2: 0.3895289 (-3.4%)
TP3: 0.3812663 (-5.5%)
SL: 0.4143169 (+2.7%)
Plan: enter only inside the zone, close 50% at TP1, 25% at TP2, 25% at TP3, and move the stop to entry after TP1.
Note: moderate conviction only, keep size light.
Why SHORT? 4/12 signals agree, 0 against.
• 4h trend down (below EMA50 & EMA200)
• 1h trend down (below EMA50 & EMA200)
• Sellers are driving the move (15m ADX 20.9)
Bear path:
If the 4h trend holds with price below the EMA stack, the 1h price may continue sliding toward the first target. The daily trend being range means the move could stay contained.
What kills it:
If the 1h price reclaims the entry level at 0.4039556, the bearish structure breaks and I would exit the short.
Where do you want to see price before shorting?
4
·
--
Bajista
Ver traducción
The 4h stack is bearish across every timeframe.
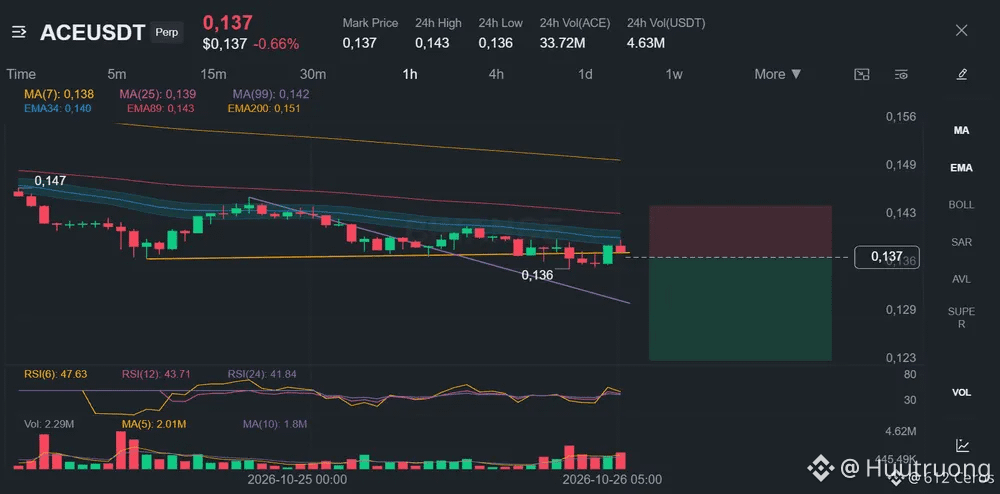
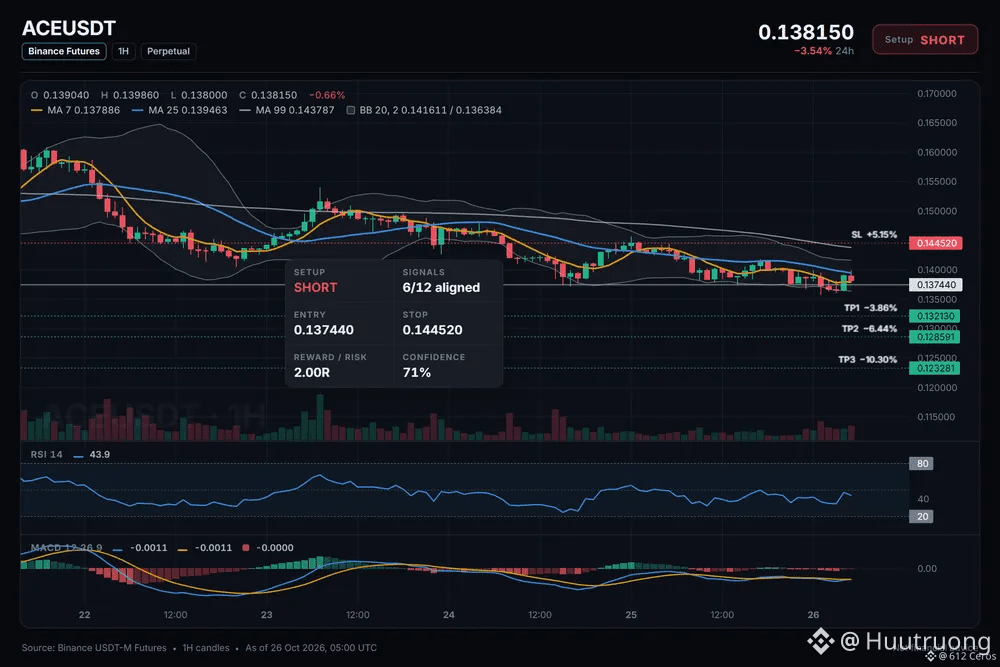
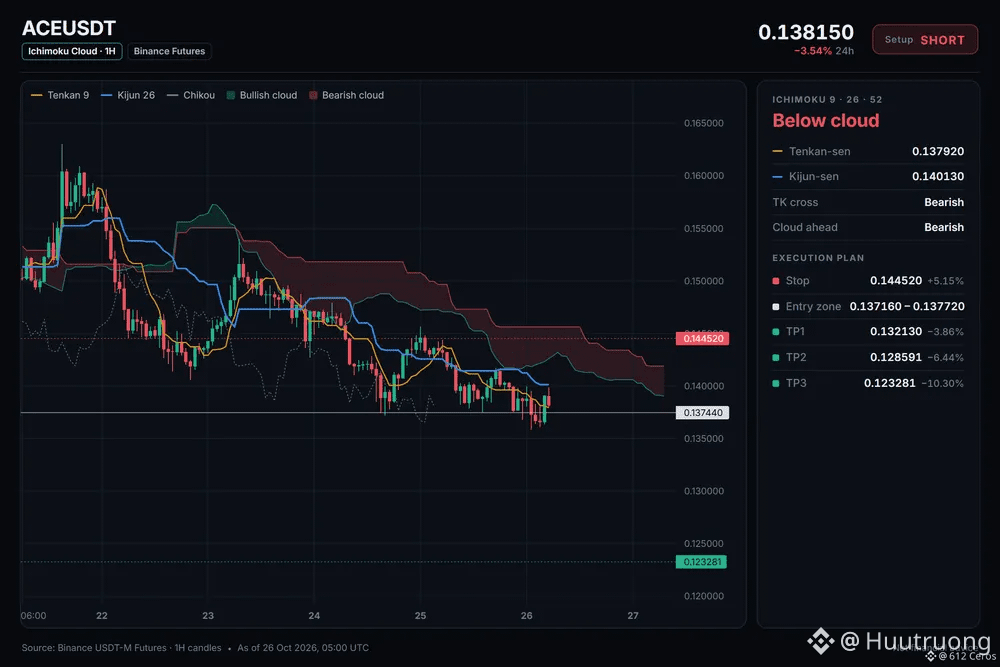
🔴 SHORT $ACE /USDT: expecting price to go DOWN
Bias: SHORT · Strong
Entry: 0.137160 – 0.137720
TP1: 0.132130 (-3.9%)
TP2: 0.128591 (-6.4%)
TP3: 0.123281 (-10.3%)
SL: 0.144520 (+5.2%)
Plan: enter only inside the zone, close 50% at TP1, 25% at TP2, 25% at TP3, and move the stop to entry after TP1.
Why SHORT? 6/12 signals agree, 0 against.
• 4h trend down (below EMA50 & EMA200)
• 1h trend down (below EMA50 & EMA200)
• Sellers have the momentum (4h RSI 33.9)
My read on ACE today
I'm watching a short setup on ACE. The 1h price is 0.137440, and the daily trend is a range, so the move is driven by the 4h bearish stack. I want to see the daily trend stay in range while the 4h stack holds.
Where is your invalidation level for this trade?
5
·
--
Bajista
Ver traducción
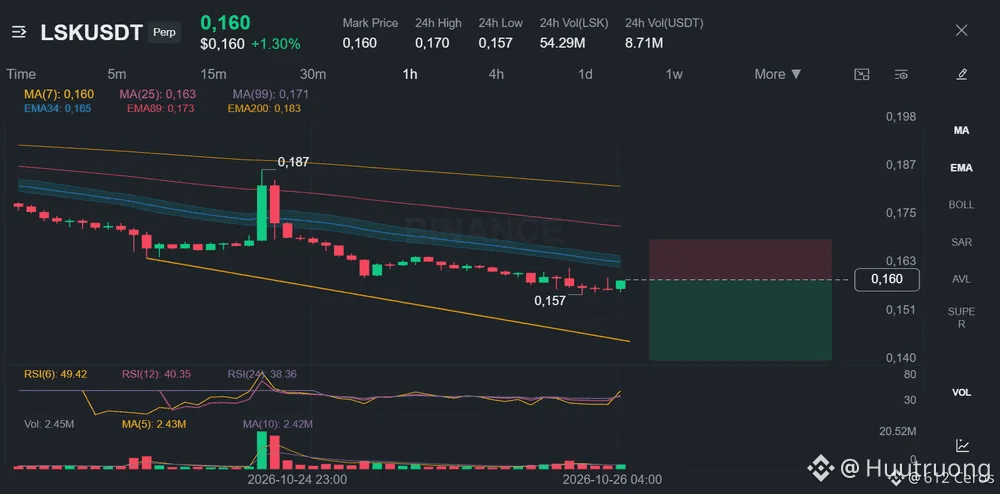
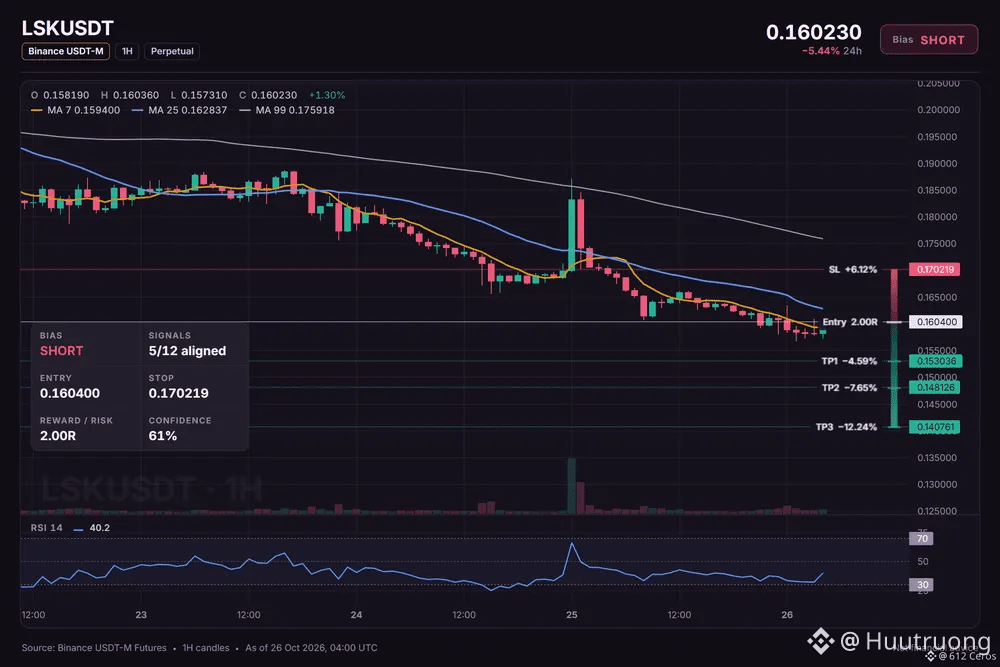
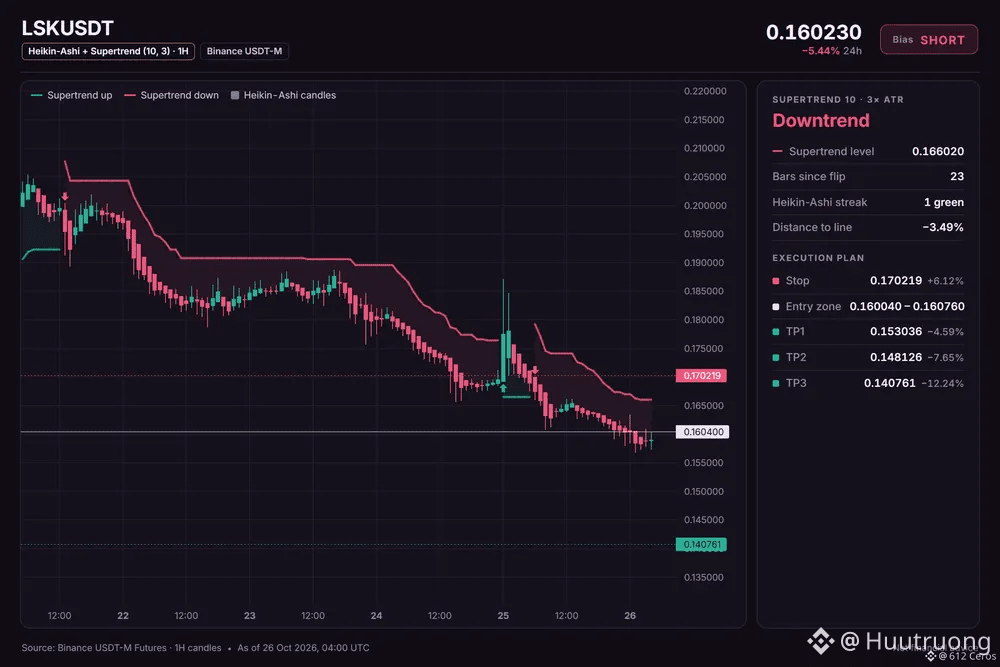
🔴 SHORT $LSK /USDT: expecting price to go DOWN
Bias: SHORT · Leaning
Entry: 0.160040 – 0.160760
TP1: 0.153036 (-4.6%)
TP2: 0.148126 (-7.7%)
TP3: 0.140761 (-12.2%)
SL: 0.170219 (+6.1%)
Plan: enter only inside the zone, close 50% at TP1, 25% at TP2, 25% at TP3, and move the stop to entry after TP1.
Note: moderate conviction only, keep size light.
LSK looks weak but buyers are fighting back now
Why SHORT? 5/12 signals agree, 2 against.
• 4h trend down (below EMA50 & EMA200)
• 1h trend down (below EMA50 & EMA200)
• Sellers have the momentum (1h RSI 40.2)
Risk: Price is washed out, bounces are common from here (4h RSI 24.4, oversold)
The 4h trend is bearish and the 1h RSI is below 45, but the 15m RSI shows buyers in control, so conviction is moderate.
What is your invalidation level if you are in this trade?
2
·
--
Bajista
Ver traducción
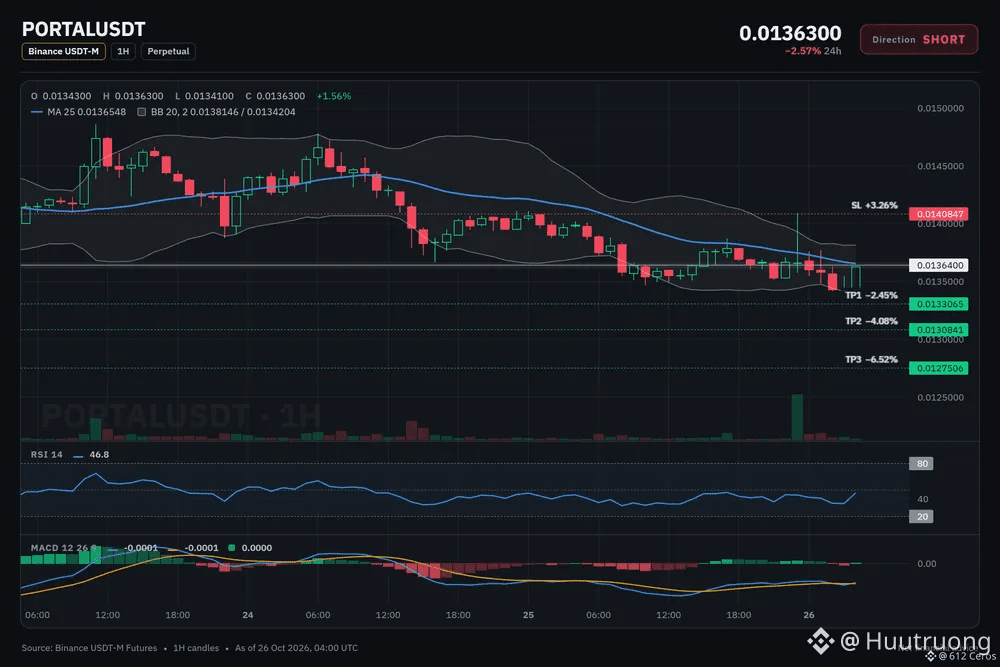
PORTAL short setup: the levels I'm watching
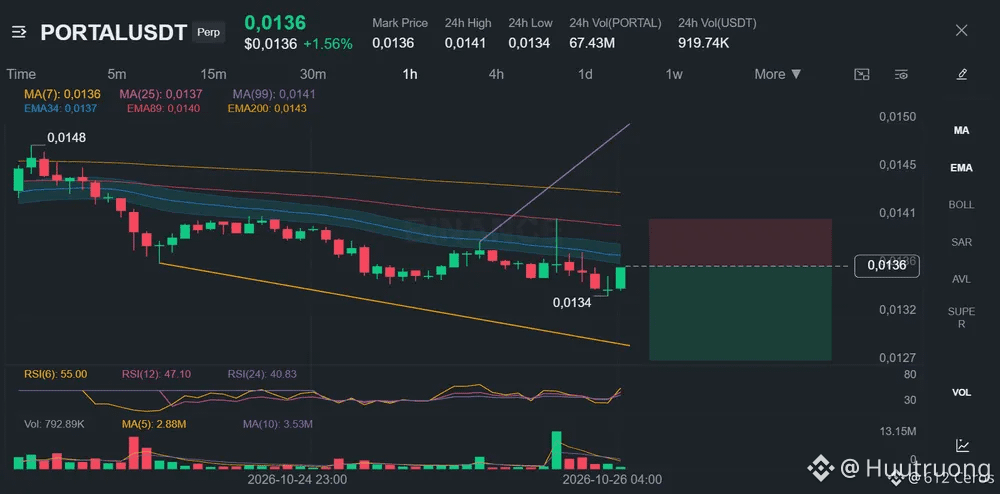
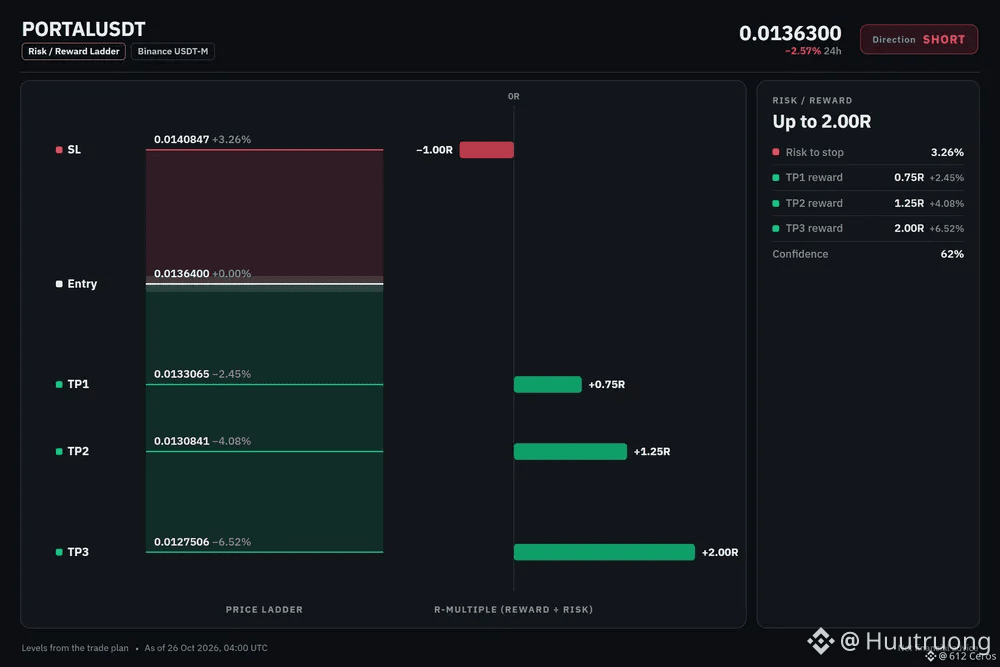
🔴 SHORT $PORTAL /USDT: expecting price to go DOWN
Bias: SHORT · Leaning
Entry: 0.0136135 – 0.0136665
TP1: 0.0133065 (-2.4%)
TP2: 0.0130841 (-4.1%)
TP3: 0.0127506 (-6.5%)
SL: 0.0140847 (+3.3%)
Plan: enter only inside the zone, close 50% at TP1, 25% at TP2, 25% at TP3, and move the stop to entry after TP1.
Note: moderate conviction only, keep size light.
Why SHORT? 4/12 signals agree, 1 against.
• 4h trend down (below EMA50 & EMA200)
• 1h trend down (below EMA50 & EMA200)
• Sellers have the momentum (4h RSI 34.9)
Risk: Buyers are pushing right now (+0.74% 15m candle)
In plain words:
The daily trend reads range, and 4/12 signals aligned favour the short side. The plan is to work the 0.0136135 – 0.0136665 zone, scale out at 0.0133065 and 0.0130841, and stay patient for 0.0127506. A move through 0.0140847 means the idea is wrong and the stop does its job.
Does PORTAL tag 0.0133065 first, or the stop?
7
·
--
Alcista
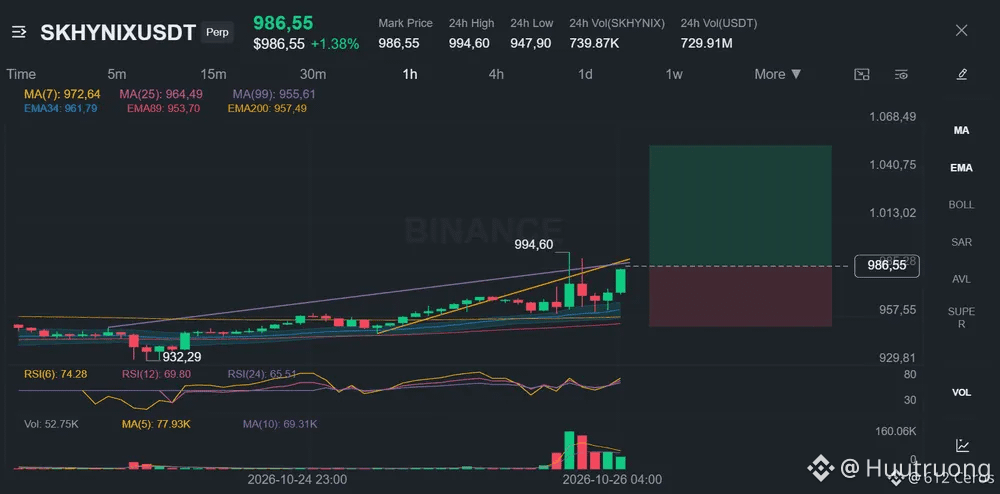
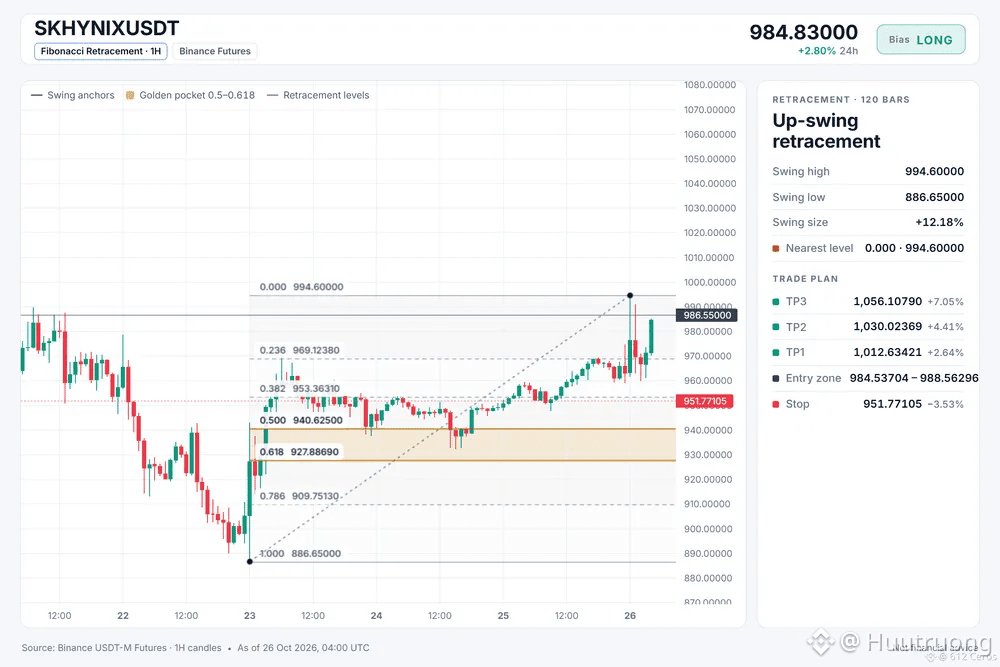
SKHYNIX parece sobreextendido por encima de su conjunto de EMA de 1 h
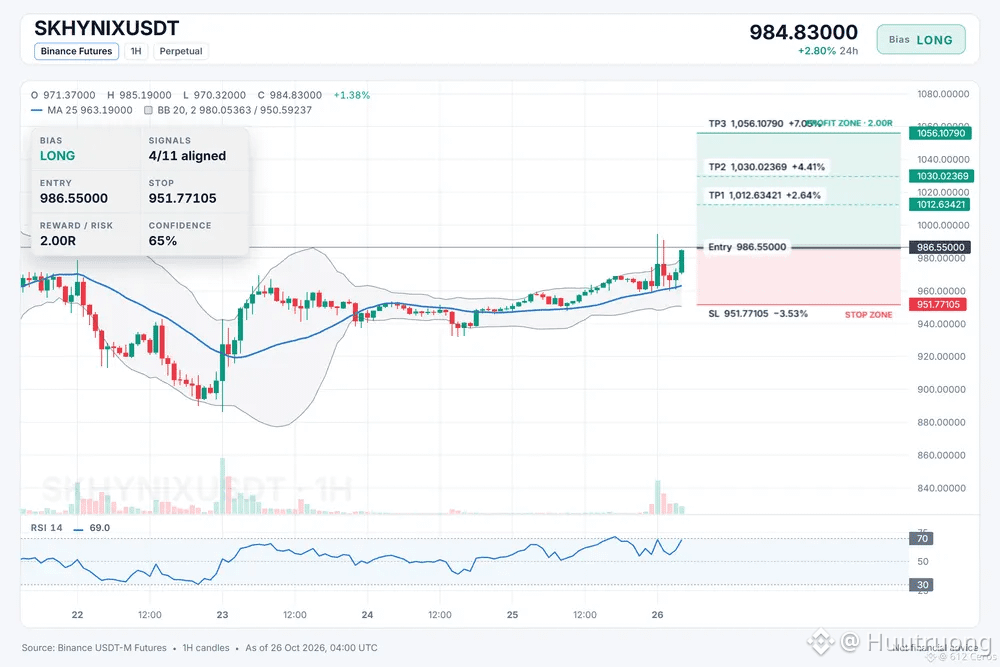
🟢 LARGO $SKHYNIX /USDT: se espera que el precio SUBA
Sesgo: LARGO · Inclinado
Entrada: 984.53704 – 988.56296
TP1: 1012.63421 (+2.6%)
TP2: 1030.02369 (+4.4%)
TP3: 1056.10790 (+7.1%)
SL: 951.77105 (-3.5%)
Plan: entrar solo dentro de la zona, cerrar el 50% en TP1, el 25% en TP2, el 25% en TP3 y mover el stop al precio de entrada después de TP1.
Nota: convicción moderada; mantén un tamaño de posición pequeño.
¿Por qué LARGO? 4/11 señales coinciden y 0 están en contra.
• Tendencia alcista en 1 h (por encima de EMA50 y EMA200)
• Los compradores tienen el impulso (RSI de 4 h: 59.1)
• Los compradores tienen el impulso (RSI de 1 h: 69.0)
Escenario alcista:
Si la tendencia de 1 h se mantiene por encima de EMA200, el precio podría alcanzar el primer objetivo, donde el RSI de 1 h indica que los compradores aún tienen impulso.
Qué lo invalida:
Si el precio rompe el stop loss en el mínimo de entrada, es probable que el régimen de rango diario indique que esta operación era incorrecta, así que saldría.
¿Dónde establecerías tu nivel de invalidación para esta operación?
1
·
--
Bajista
Ver traducción
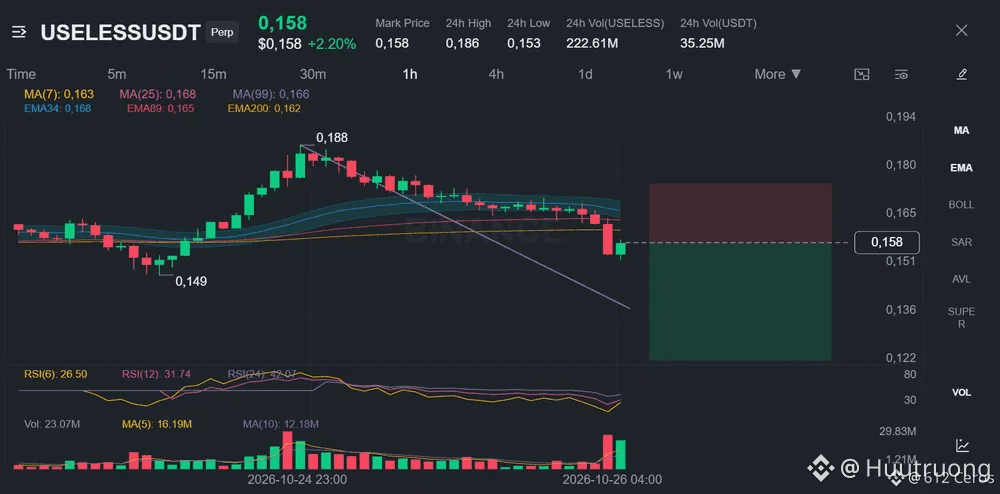
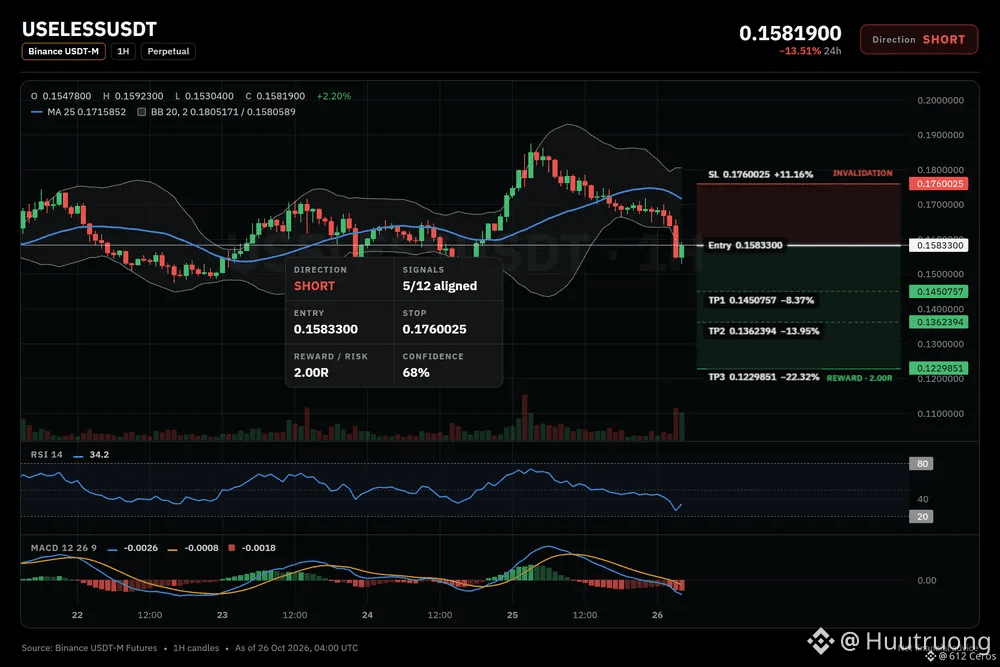
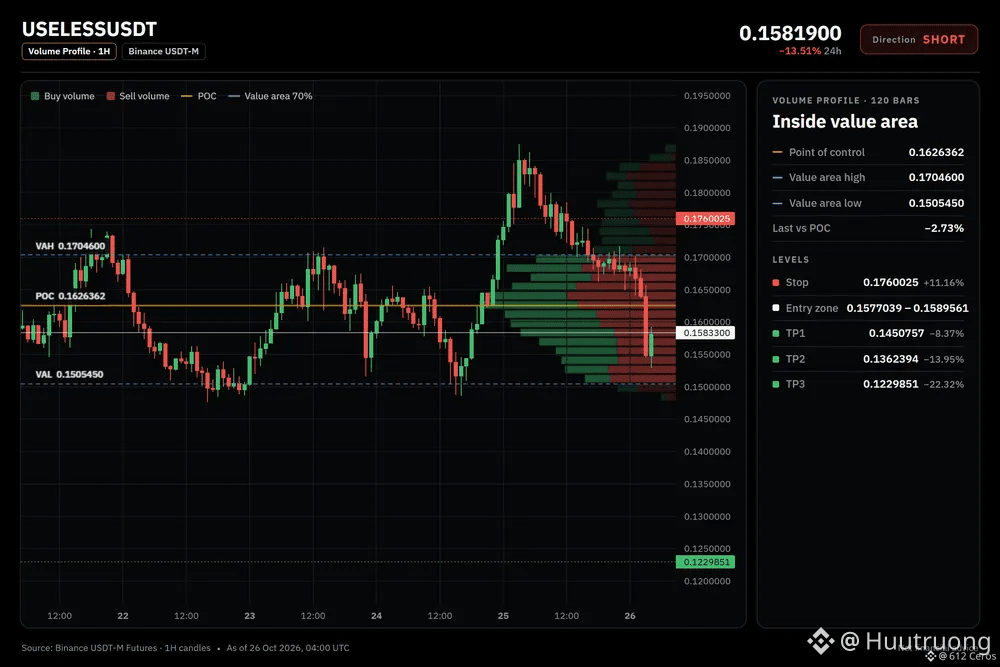
USELESS is grinding below its moving averages
🔴 SHORT $USELESS /USDT: expecting price to go DOWN
Bias: SHORT · Leaning
Entry: 0.1577039 – 0.1589561
TP1: 0.1450757 (-8.4%)
TP2: 0.1362394 (-14.0%)
TP3: 0.1229851 (-22.3%)
SL: 0.1760025 (+11.2%)
Plan: enter only inside the zone, close 50% at TP1, 25% at TP2, 25% at TP3, and move the stop to entry after TP1.
Note: moderate conviction only, keep size light.
Why SHORT? 5/12 signals agree, 0 against.
• 4h trend down (below EMA50 & EMA200)
• Sellers are driving the move (15m ADX 37.1)
• Sellers have the momentum (4h RSI 43.4)
Q: Why short when the daily trend is range?
A: The 4h chart shows a bearish stack with price below both EMAs.
Q: When is this setup wrong?
A: If price holds above 0.1760025 the short thesis fails.
What is your invalidation level for this trade?
9
·
--
Bajista
Ver traducción
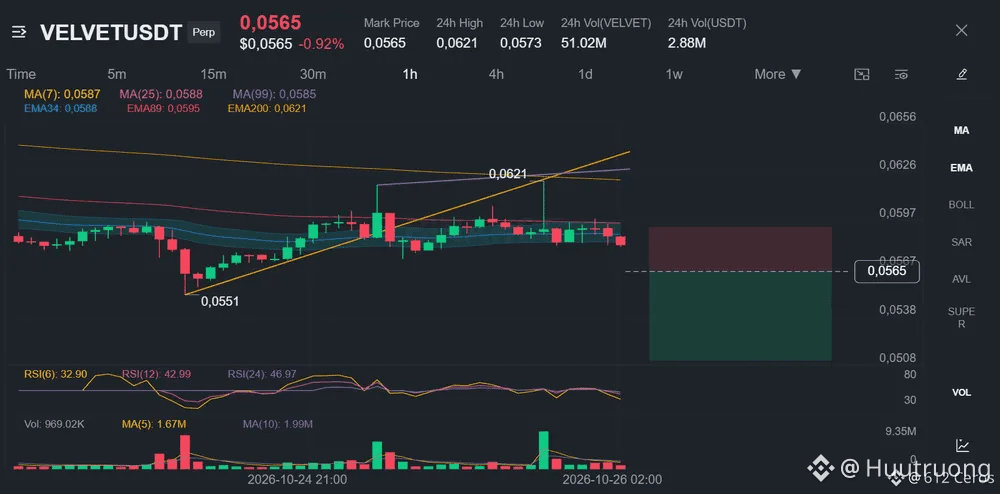
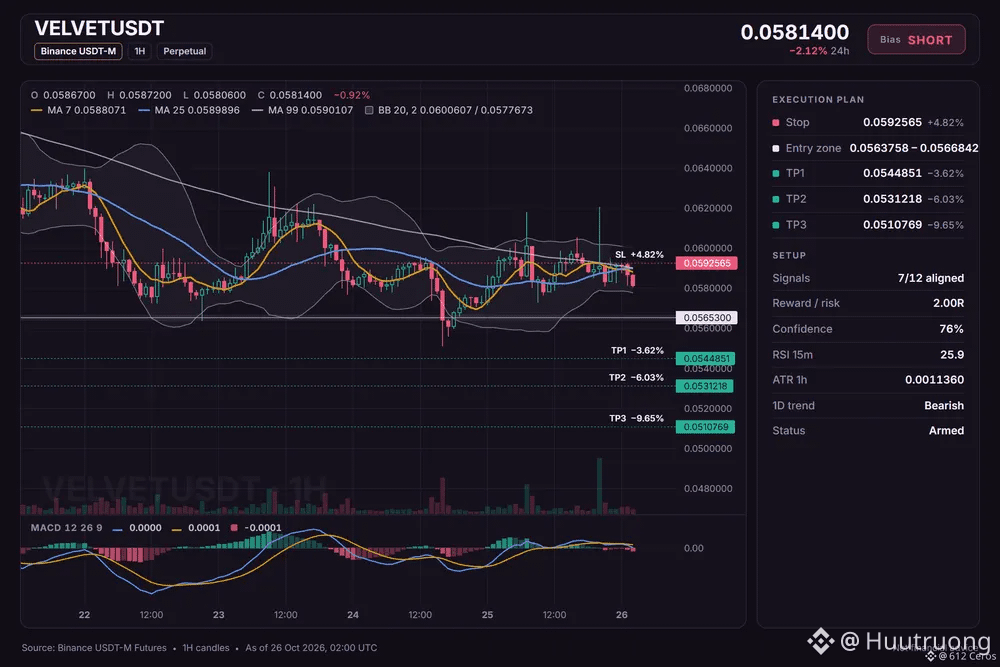
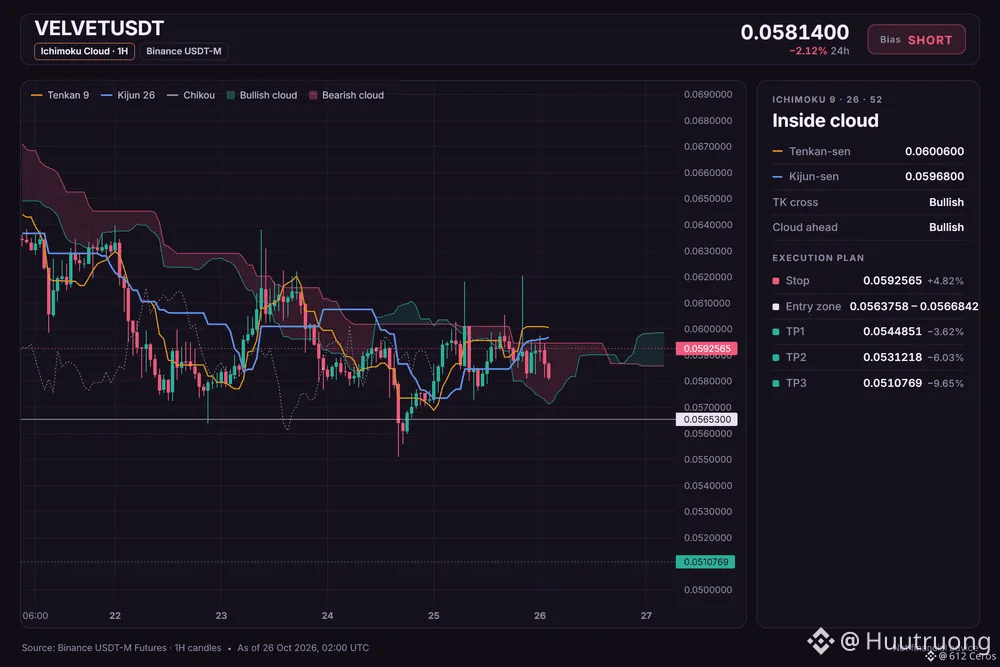
VELVET short setup: the levels I'm watching
🔴 SHORT $VELVET /USDT: expecting price to go DOWN
Bias: SHORT · Strong
Entry: 0.0563758 – 0.0566842
TP1: 0.0544851 (-3.6%)
TP2: 0.0531218 (-6.0%)
TP3: 0.0510769 (-9.6%)
SL: 0.0592565 (+4.8%)
Plan: enter only inside the zone, close 50% at TP1, 25% at TP2, 25% at TP3, and move the stop to entry after TP1.
Why SHORT? 7/12 signals agree, 1 against.
• Daily trend down (below EMA50 & EMA200)
• 4h trend down (below EMA50 & EMA200)
• 1h trend down (below EMA50 & EMA200)
Risk: Range bottom, buyers often step in (RSI z −2.72)
In plain words:
The daily trend reads bearish, and 7/12 signals aligned favour the short side. The plan is to work the 0.0563758 – 0.0566842 zone, scale out at 0.0544851 and 0.0531218, and stay patient for 0.0510769. A move through 0.0592565 means the idea is wrong and the stop does its job.
Does VELVET tag 0.0544851 first, or the stop?
6
·
--
Bajista
Ver traducción
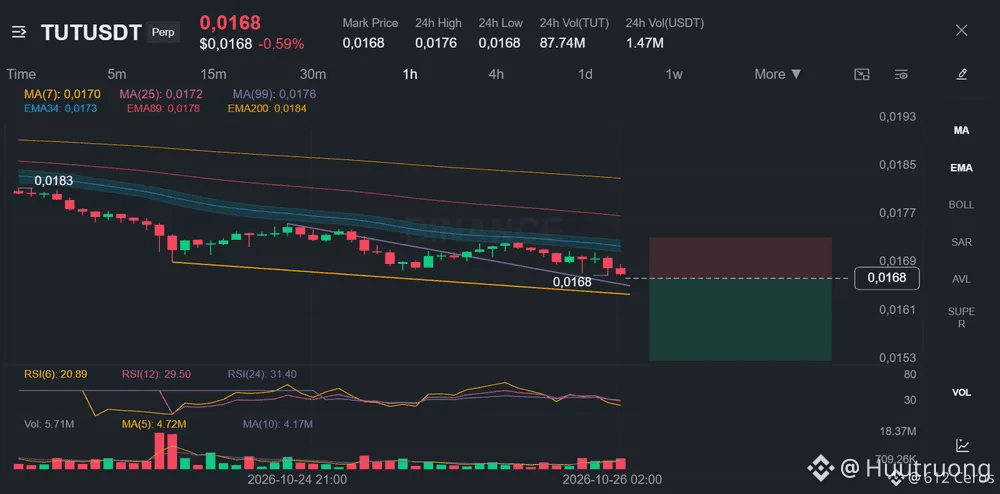
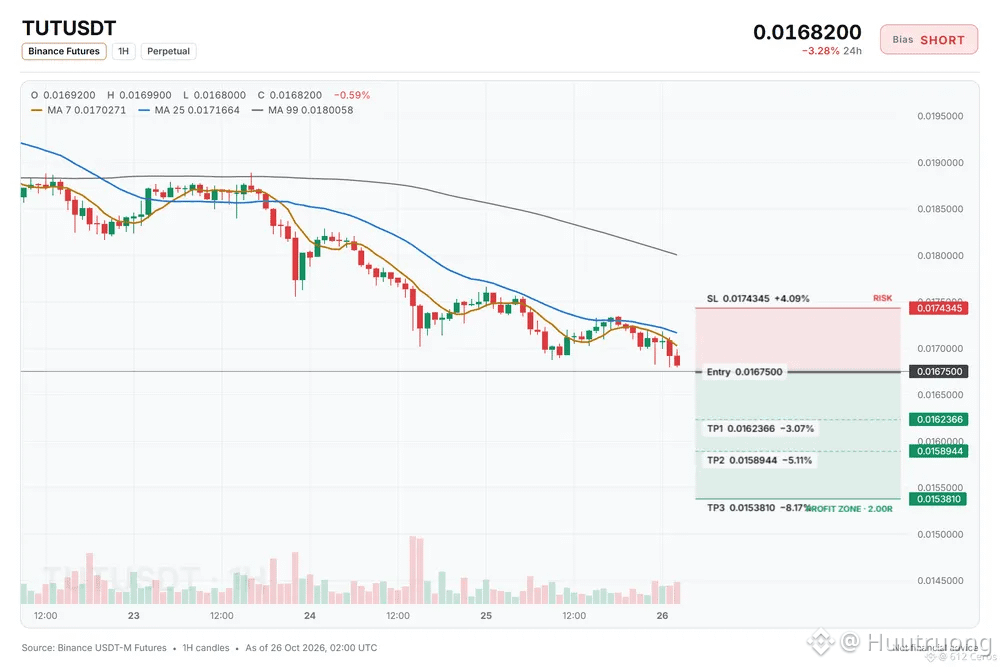
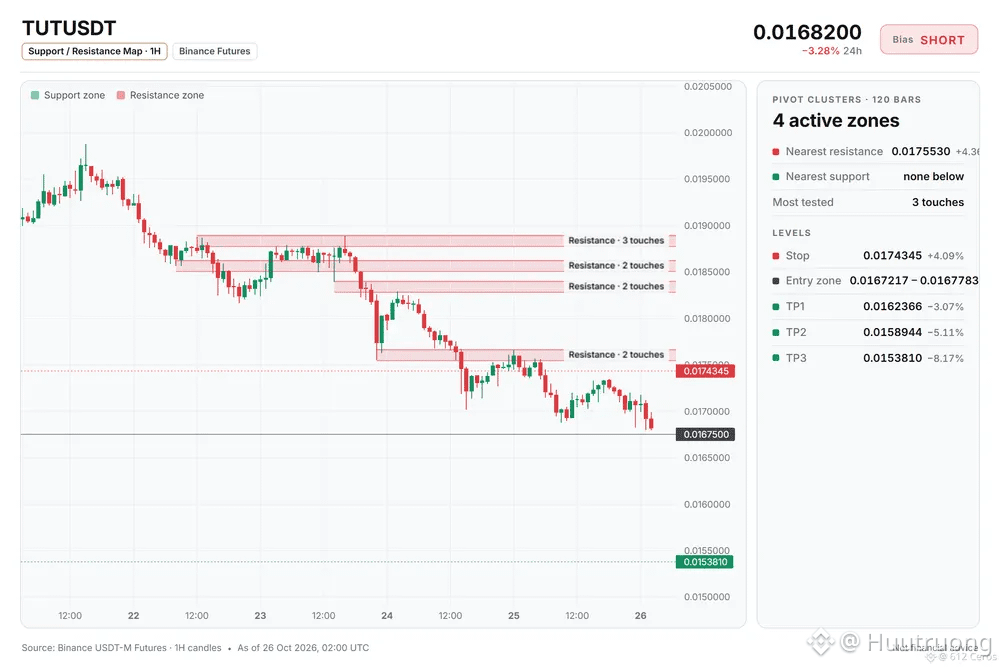
TUT is grinding below both EMAs across two timeframes.
🔴 SHORT $TUT /USDT: expecting price to go DOWN
Bias: SHORT · Strong
Entry: 0.0167217 – 0.0167783
TP1: 0.0162366 (-3.1%)
TP2: 0.0158944 (-5.1%)
TP3: 0.0153810 (-8.2%)
SL: 0.0174345 (+4.1%)
Plan: enter only inside the zone, close 50% at TP1, 25% at TP2, 25% at TP3, and move the stop to entry after TP1.
Why SHORT? checklist: 8/12 agree, 1 against.
• 4h trend down (below EMA50 & EMA200)
• 1h trend down (below EMA50 & EMA200)
• Sellers are driving the move (15m ADX 34.4)
Watch: Far below its average, bounce likely (−3.7 ATR from 1h EMA50)
Watch: The idea is wrong if price reaches the stop at 0.0174345
Bottom line: The 4h bearish stack and strong seller momentum support the short, but price is 3.7 ATR below the 1h EMA50, so a bounce is possible.
Where would you set your short entry on ?
4
·
--
Bajista
Ver traducción
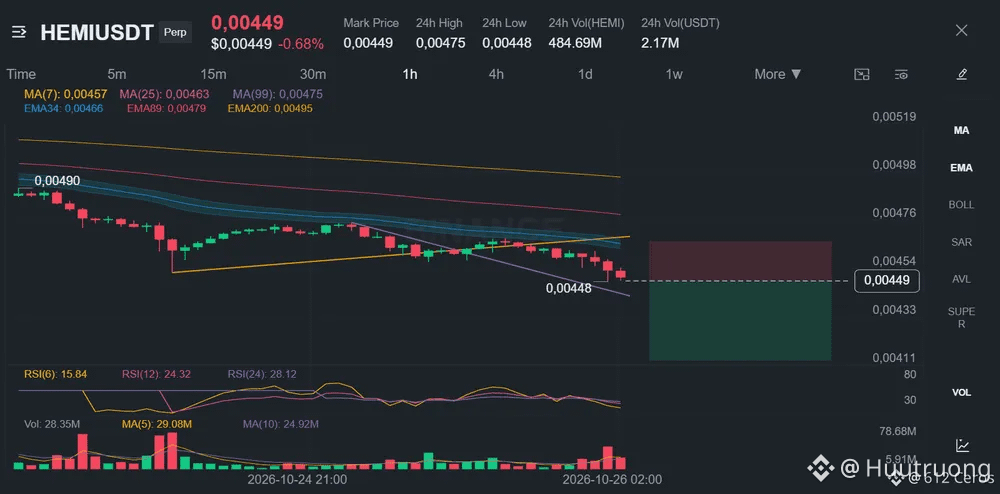
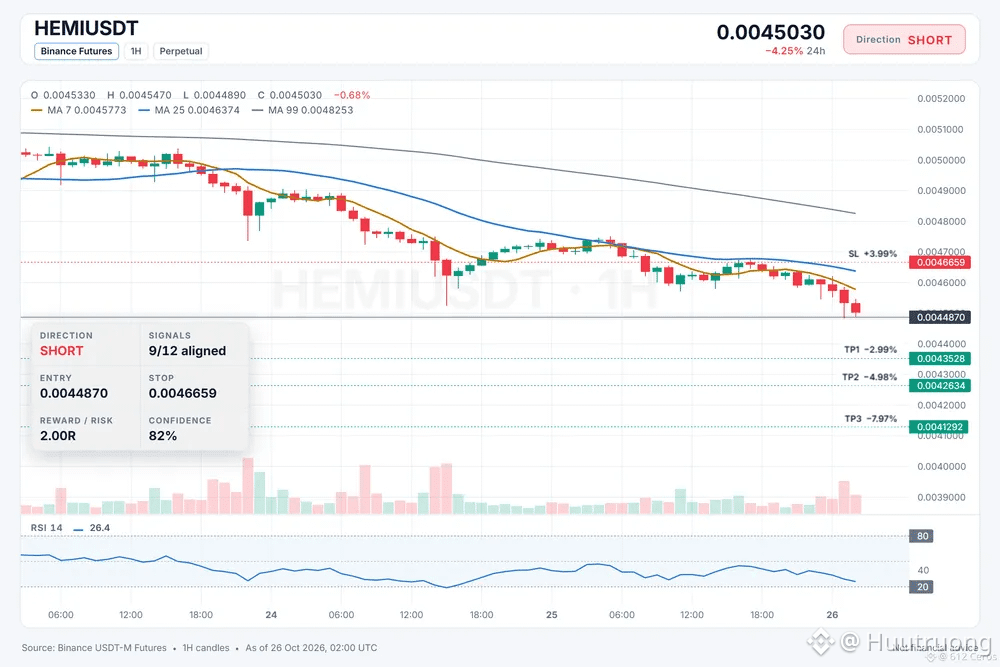
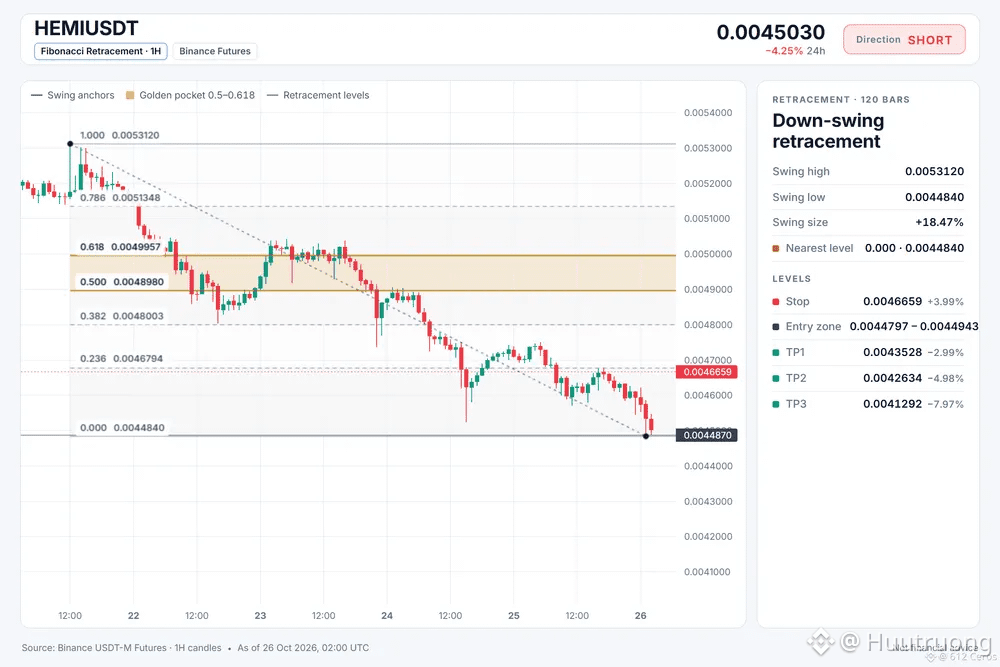
HEMI is grinding lower through a bearish stack across timeframes.
🔴 SHORT $HEMI /USDT: expecting price to go DOWN
Bias: SHORT · Strong
Entry: 0.0044797 – 0.0044943
TP1: 0.0043528 (-3.0%)
TP2: 0.0042634 (-5.0%)
TP3: 0.0041292 (-8.0%)
SL: 0.0046659 (+4.0%)
Plan: enter only inside the zone, close 50% at TP1, 25% at TP2, 25% at TP3, and move the stop to entry after TP1.
Why SHORT? 9/12 signals agree, 1 against.
• Daily trend down (below EMA50 & EMA200)
• 4h trend down (below EMA50 & EMA200)
• 1h trend down (below EMA50 & EMA200)
Risk: Far below its average, bounce likely (−4.2 ATR from 1h EMA50)
Bear path:
If the idea works, price should keep sliding toward the 1h EMA50, confirming the bearish momentum.
What kills it:
A bounce back above the entry invalidates the short and proves the sellers are exhausted.
Where do you see HEMI finding resistance first?
4
·
--
Bajista
Ver traducción
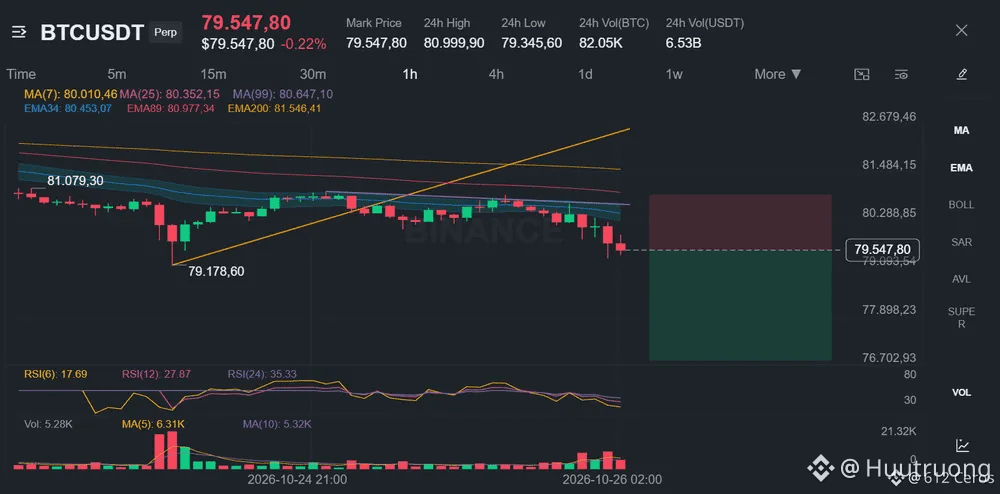
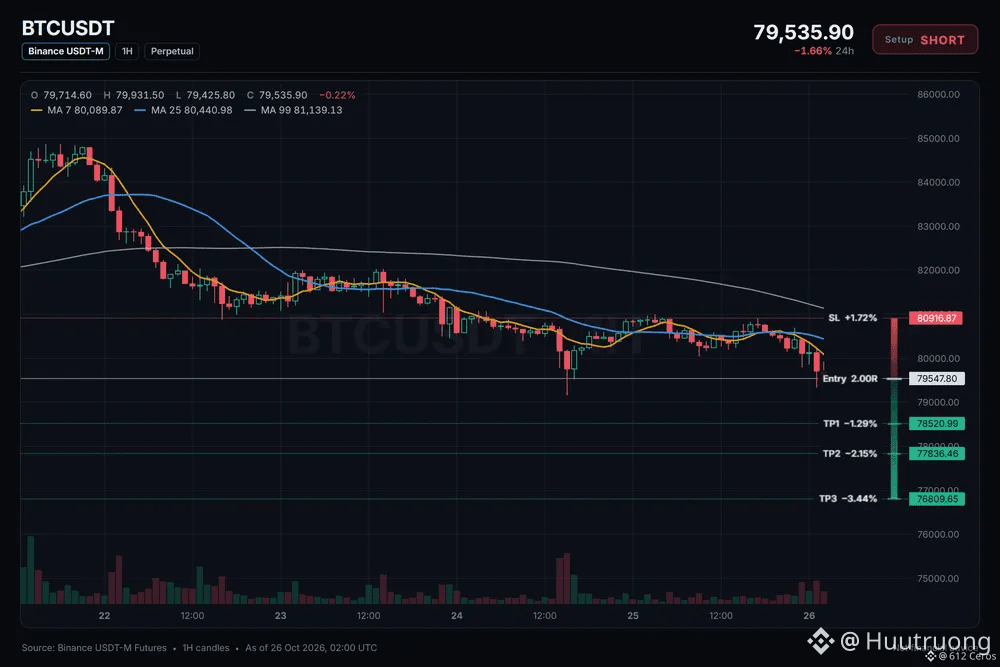
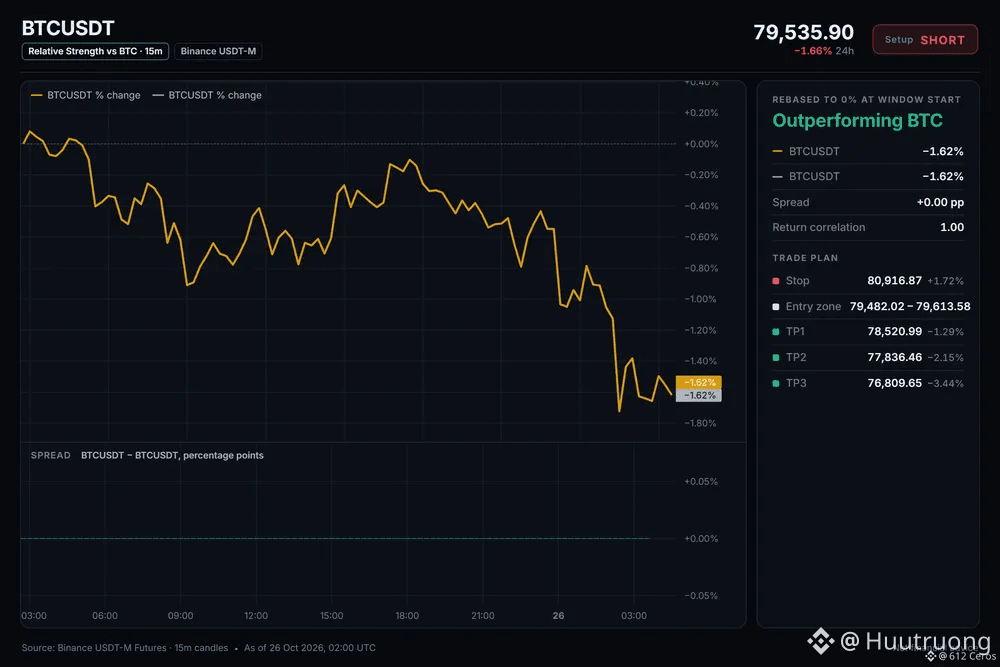
Liệu BTC có thể tiếp tục giảm xuống trong vùng giảm giá 4 giờ không?
🔴 BÁN KHỐNG $BTC /USDT: dự đoán giá sẽ GIẢM.
Xu hướng: BÁN KHỐNG · Điểm vào lệnh mạnh
: 79482.02 – 79613.58
TP1: 78520.99 (-1.3%)
TP2: 77836.46 (-2.2%)
TP3: 76809.65 (-3.4%)
SL: 80916.87 (+1.7%)
Kế hoạch: chỉ vào lệnh trong vùng này, chốt lời 50% tại TP1, 25% tại TP2, 25% tại TP3, và di chuyển điểm dừng lỗ về điểm vào lệnh sau TP1.
Tại sao BÁN KHỐNG? 6/12 tín hiệu đồng ý, 0 tín hiệu phản đối.
• Xu hướng giảm trên biểu đồ 4 giờ (dưới EMA50 & EMA200)
• Xu hướng giảm trên biểu đồ 1 giờ (dưới EMA50 & EMA200)
• Người bán đang đẩy giá xuống (ADX 15 phút ở mức 33.3)
Tại sao lại là bây giờ?
Xu hướng 4 giờ cho thấy giá nằm dưới cả EMA 50 và 200, với người bán đang đẩy giá xuống khi ADX ở mức 33.3 và RSI 1 giờ ở mức 30.2. Xu hướng hàng ngày đang đi ngang và bối cảnh BTC đang giảm, vì vậy thiết lập lệnh bán phù hợp với động lượng chung. Cửa sổ vào lệnh là từ 79482.02 đến 79613.58.
Bạn sẽ đặt điểm hủy lệnh ở đâu nếu bạn thực hiện lệnh bán này?
14
·
--
Kite y el próximo capítulo de la economía de los agentes
La verdadera oportunidad de la economía de los agentes no consiste simplemente en crear más agentes de IA. Consiste en construir un entorno donde los agentes puedan coordinarse, interactuar y contribuir a una actividad económica significativa.
A medida que los agentes de IA se vuelven más capaces, surge una pregunta crucial: ¿cómo pueden los agentes independientes descubrir oportunidades, generar confianza y colaborar eficazmente en distintos ecosistemas digitales?
Aquí es donde creo que Kite merece atención. En lugar de analizar la economía de los agentes únicamente desde la perspectiva del rendimiento de la IA, también deberíamos tener en cuenta la infraestructura, la coordinación y la participación necesarias para que los sistemas impulsados por agentes sean útiles en la práctica.
En el caso de Web3, la oportunidad más profunda se encuentra en la intersección del software autónomo y las redes digitales abiertas. Si los agentes pueden participar de manera más eficaz en estos entornos, podrían hacerse posibles formas totalmente nuevas de colaboración y servicios digitales. Sin embargo, el progreso real dependerá de la adopción práctica, la seguridad, la fiabilidad y la utilidad medible, no solo de la expectación.
En mi opinión, el futuro de la economía de los agentes no estará determinado por la cantidad de agentes creados, sino por lo bien que colaboren para resolver problemas reales.
¿Cómo creen que proyectos como Kite pueden ayudar a convertir la economía de los agentes, de una idea emergente, en una infraestructura práctica?
[https://app.binance.com/uni-qr/cpro/Deaflove?l=en&r=JQ3F4UE9&uc=web_square_share_link&us=copylink](https://app.binance.com/uni-qr/cpro/Deaflove?l=en&r=JQ3F4UE9&uc=web_square_share_link&us=copylink)
#KiteBBW $KITE @GoKiteAI
Kite y el próximo capítulo de la economía de los agentes
La verdadera oportunidad de la economía de los agentes no consiste simplemente en crear más agentes de IA. Consiste en construir un entorno donde los agentes puedan coordinarse, interactuar y contribuir a una actividad económica significativa.
A medida que los agentes de IA se vuelven más capaces, surge una pregunta crucial: ¿cómo pueden los agentes independientes descubrir oportunidades, generar confianza y colaborar eficazmente en distintos ecosistemas digitales?
Aquí es donde creo que Kite merece atención. En lugar de analizar la economía de los agentes únicamente desde la perspectiva del rendimiento de la IA, también deberíamos tener en cuenta la infraestructura, la coordinación y la participación necesarias para que los sistemas impulsados por agentes sean útiles en la práctica.
En el caso de Web3, la oportunidad más profunda se encuentra en la intersección del software autónomo y las redes digitales abiertas. Si los agentes pueden participar de manera más eficaz en estos entornos, podrían hacerse posibles formas totalmente nuevas de colaboración y servicios digitales. Sin embargo, el progreso real dependerá de la adopción práctica, la seguridad, la fiabilidad y la utilidad medible, no solo de la expectación.
En mi opinión, el futuro de la economía de los agentes no estará determinado por la cantidad de agentes creados, sino por lo bien que colaboren para resolver problemas reales.
¿Cómo creen que proyectos como Kite pueden ayudar a convertir la economía de los agentes, de una idea emergente, en una infraestructura práctica?
https://app.binance.com/uni-qr/cpro/Deaflove?l=en&r=JQ3F4UE9&uc=web_square_share_link&us=copylink
#KiteBBW $KITE @GoKiteAI

35
·
--
Bajista
El precio está por debajo de ambas EMA en el gráfico de 4 h
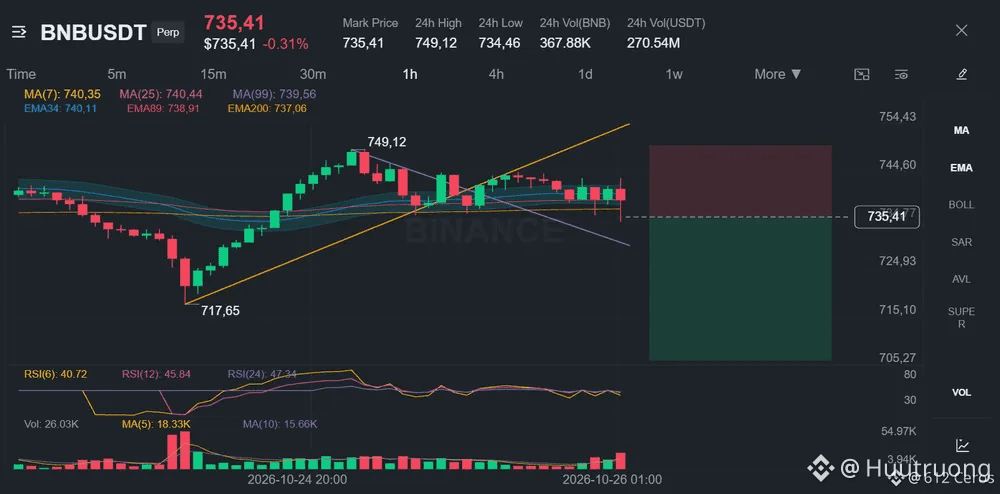
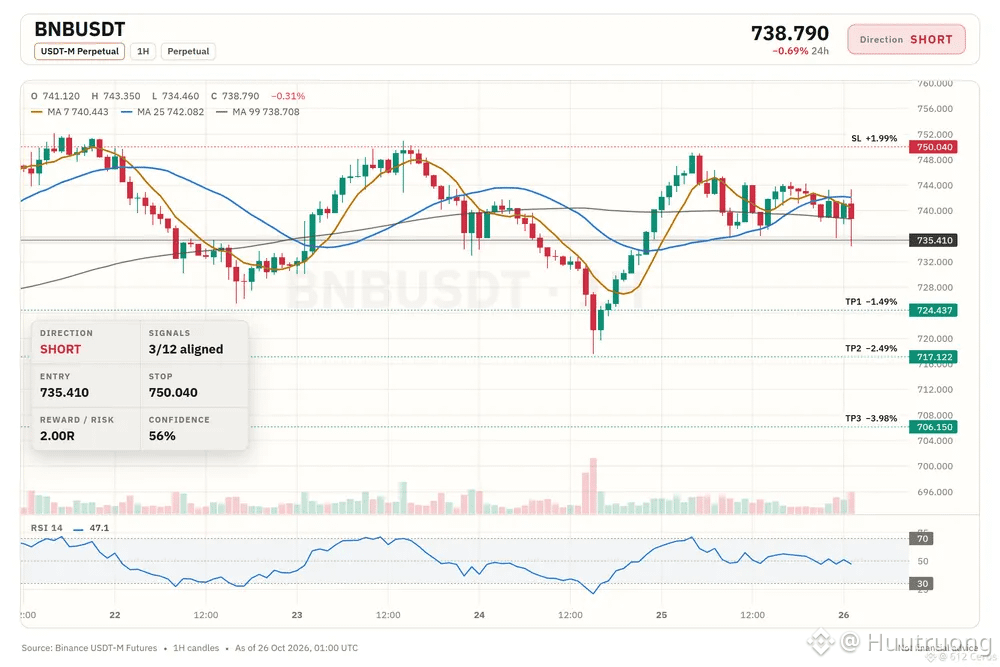
🔴 CORTO $BNB /USDT: se espera que el precio BAJE
Sesgo: CORTO · Tendencia
Entrada: 734.743 – 736.077
TP1: 724.437 (-1.5%)
TP2: 717.122 (-2.5%)
TP3: 706.150 (-4.0%)
SL: 750.040 (+2.0%)
Plan: entrar solo dentro de la zona, cerrar el 50% en TP1, el 25% en TP2 y el 25% en TP3, y mover el stop al precio de entrada después de TP1.
Precaución: idea contra la tendencia respaldada solo por 3 señales. Usar un tamaño menor y un stop estricto.
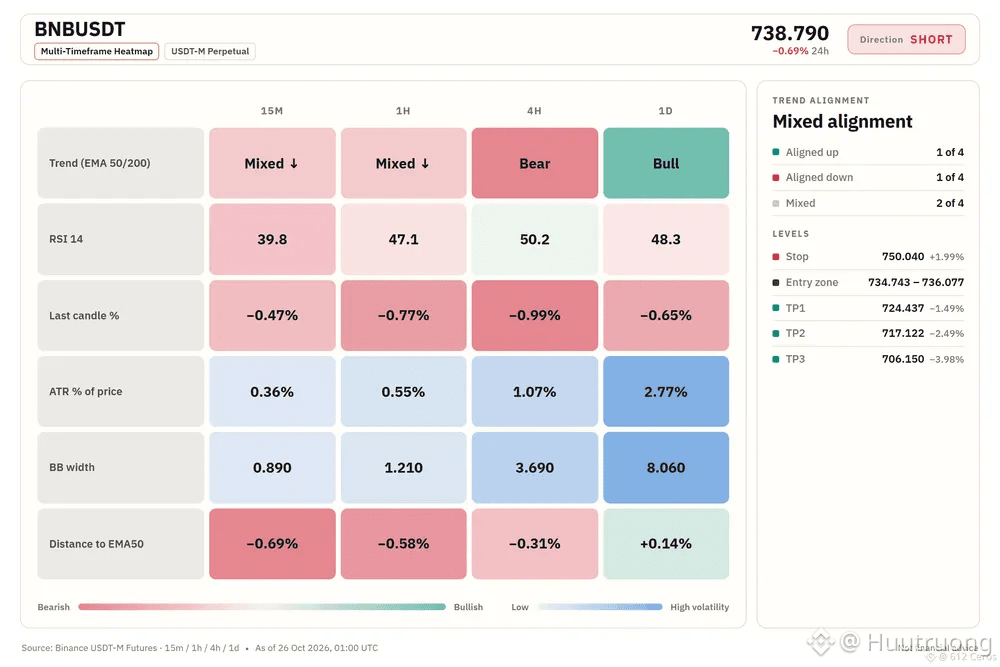
¿Por qué CORTO? 3/12 señales están de acuerdo y 1 está en contra.
• Tendencia bajista en 4 h (por debajo de EMA50 y EMA200)
• está cayendo; esta moneda suele seguirla (correlación 0.90)
• Los vendedores están presionando ahora mismo (vela de 15 min −0.47%)
Riesgo: tendencia diaria alcista (por encima de EMA50 y EMA200)
Nota de la operación:
Estoy atento a una posición corta en porque la tendencia de 4 h muestra que el precio está por debajo de EMA50 y EMA200, una configuración bajista. El RSI de 15 min está en 39.78; una lectura por debajo de 50 significa que los vendedores tienen el control ahora mismo. Quiero ver a BNB avanzar desde el precio de 735.41 en 1 h hacia la tendencia diaria, pero la tendencia diaria es alcista, así que esta es una apuesta de reversión contra la tendencia y reduciré el tamaño de la posición, respetando el stop en 750.040. El respaldo más sólido es la configuración bajista de 4 h y el contexto de BTC con una correlación de 0.90, que indica que BTC está cayendo y que BNB suele seguirlo; el principal riesgo es que la tendencia diaria alcista va en contra de la configuración.
¿Dónde tomarías ganancias en esta posición corta?
32
·
--
Bajista
ETH muestra una configuración bajista en todos los marcos temporales de tendencia
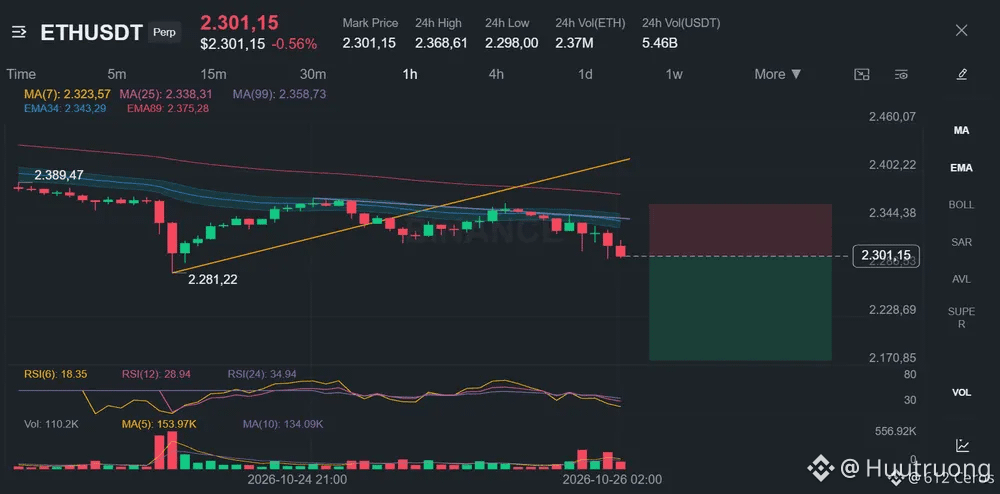
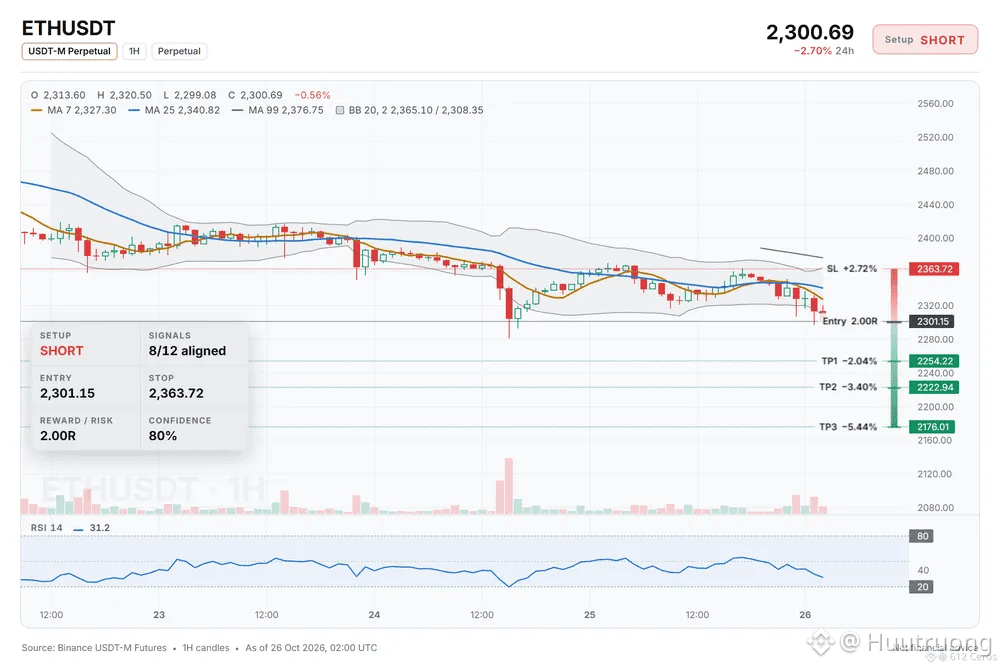
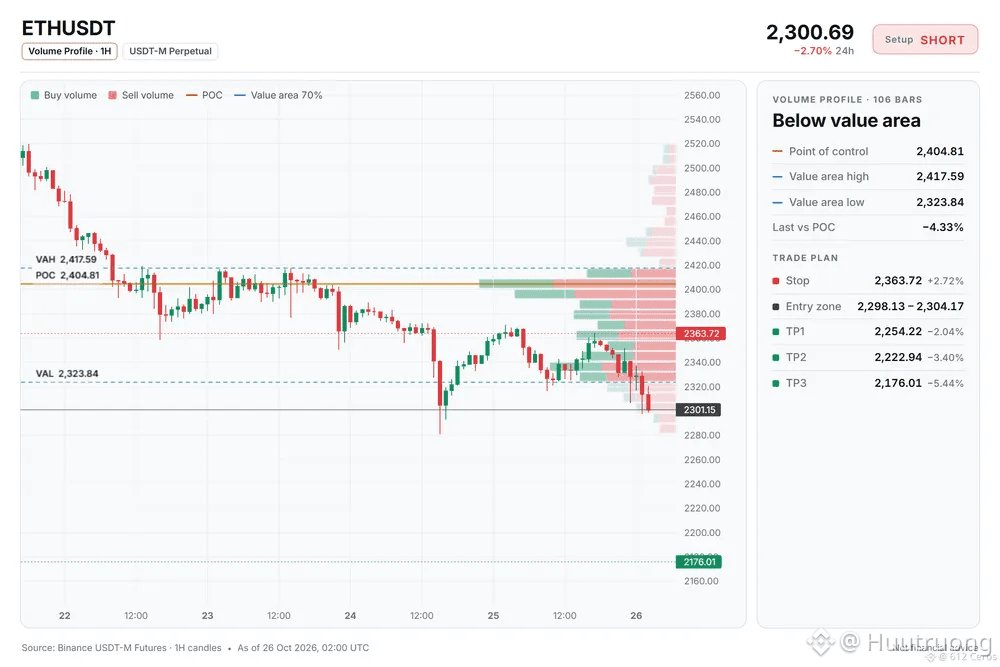
🔴 CORTO $ETH /USDT: se espera que el precio BAJE
Sesgo: CORTO · Fuerte
Entrada: 2298.13 – 2304.17
TP1: 2254.22 (-2.0%)
TP2: 2222.94 (-3.4%)
TP3: 2176.01 (-5.4%)
SL: 2363.72 (+2.7%)
Plan: entrar solo dentro de la zona, cerrar el 50% en TP1, el 25% en TP2 y el 25% en TP3, y mover el stop al precio de entrada después de TP1.
¿Por qué en corto? 8/12 señales coinciden y 0 están en contra.
• Tendencia bajista en 4h (por debajo de EMA50 y EMA200)
• Tendencia bajista en 1h (por debajo de EMA50 y EMA200)
• Los vendedores impulsan el movimiento (ADX de 15m: 36.5)
P: ¿Por qué abrir una posición corta ahora?
R: La tendencia de 4h muestra que el precio está por debajo de EMA50 y de EMA200, lo que confirma que la tendencia general es bajista.
P: ¿Cuándo deja de ser válida esta operación?
R: Si el precio en 1h supera 2363.72, se alcanza el nivel de invalidación y la estrategia deja de ser válida.
¿Cuál es tu nivel si esto falla?
47
·
--
Bajista
Las rupturas del rango suelen convertirse en rápidas caídas.
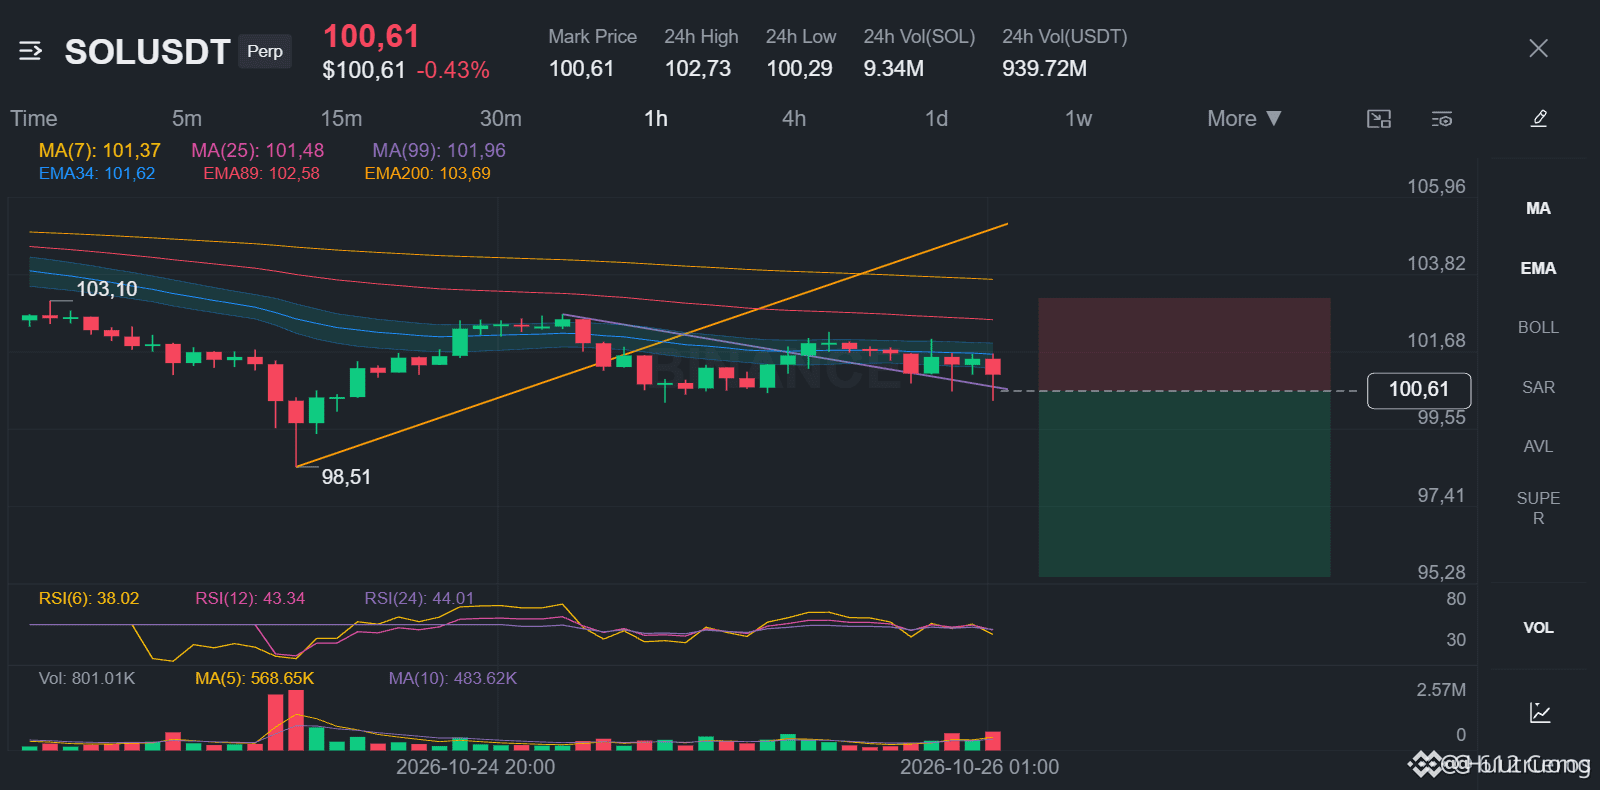
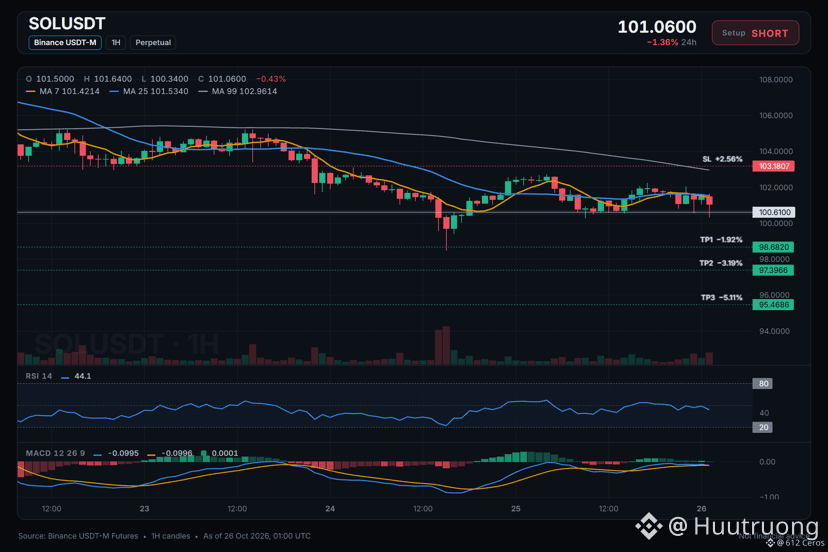
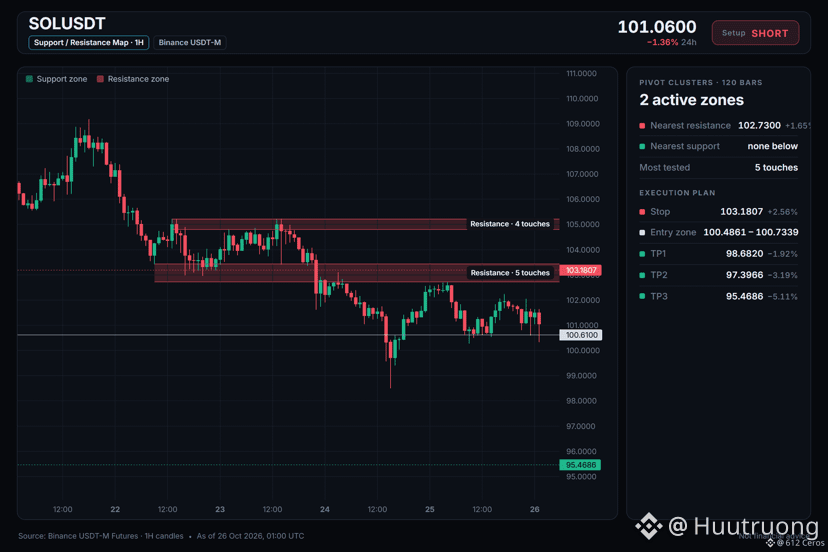
🔴 CORTO $SOL /USDT: se espera que el precio BAJE
Sesgo: CORTO · Fuerte
Entrada: 100.4861 – 100.7339
TP1: 98.6820 (-1.9%)
TP2: 97.3966 (-3.2%)
TP3: 95.4686 (-5.1%)
SL: 103.1807 (+2.6%)
Plan: entrar solo dentro de la zona, cerrar el 50% en TP1, el 25% en TP2 y el 25% en TP3, y mover el stop al precio de entrada después de TP1.
¿Por qué CORTO? 7/12 señales coinciden y 1 está en contra.
• Tendencia de 4 h bajista (por debajo de EMA50 y EMA200)
• Tendencia de 1 h bajista (por debajo de EMA50 y EMA200)
• Los vendedores impulsan el movimiento (ADX de 15 min: 24.6)
Riesgo: el fondo del rango, donde los compradores suelen entrar (RSI z −2.04)
En resumen:
1. La tendencia diaria está dentro de un rango, pero la tendencia de 4 h muestra una clara configuración bajista.
2. La tendencia de 1 h también es bajista, con el precio por debajo de EMA50 y EMA200.
3. Un rebote hasta la EMA50 de 1 h invalidaría esta idea.
¿Qué nivel te haría tomar la posición contraria?
{spot}(SOLUSDT)
Las rupturas del rango suelen convertirse en rápidas caídas.
🔴 CORTO $SOL /USDT: se espera que el precio BAJE
Sesgo: CORTO · Fuerte
Entrada: 100.4861 – 100.7339
TP1: 98.6820 (-1.9%)
TP2: 97.3966 (-3.2%)
TP3: 95.4686 (-5.1%)
SL: 103.1807 (+2.6%)
Plan: entrar solo dentro de la zona, cerrar el 50% en TP1, el 25% en TP2 y el 25% en TP3, y mover el stop al precio de entrada después de TP1.
¿Por qué CORTO? 7/12 señales coinciden y 1 está en contra.
• Tendencia de 4 h bajista (por debajo de EMA50 y EMA200)
• Tendencia de 1 h bajista (por debajo de EMA50 y EMA200)
• Los vendedores impulsan el movimiento (ADX de 15 min: 24.6)
Riesgo: el fondo del rango, donde los compradores suelen entrar (RSI z −2.04)
En resumen:
1. La tendencia diaria está dentro de un rango, pero la tendencia de 4 h muestra una clara configuración bajista.
2. La tendencia de 1 h también es bajista, con el precio por debajo de EMA50 y EMA200.
3. Un rebote hasta la EMA50 de 1 h invalidaría esta idea.
¿Qué nivel te haría tomar la posición contraria?
58
·
--
Bajista
ONG parece lista para una operación en corto, aunque la convicción es moderada.
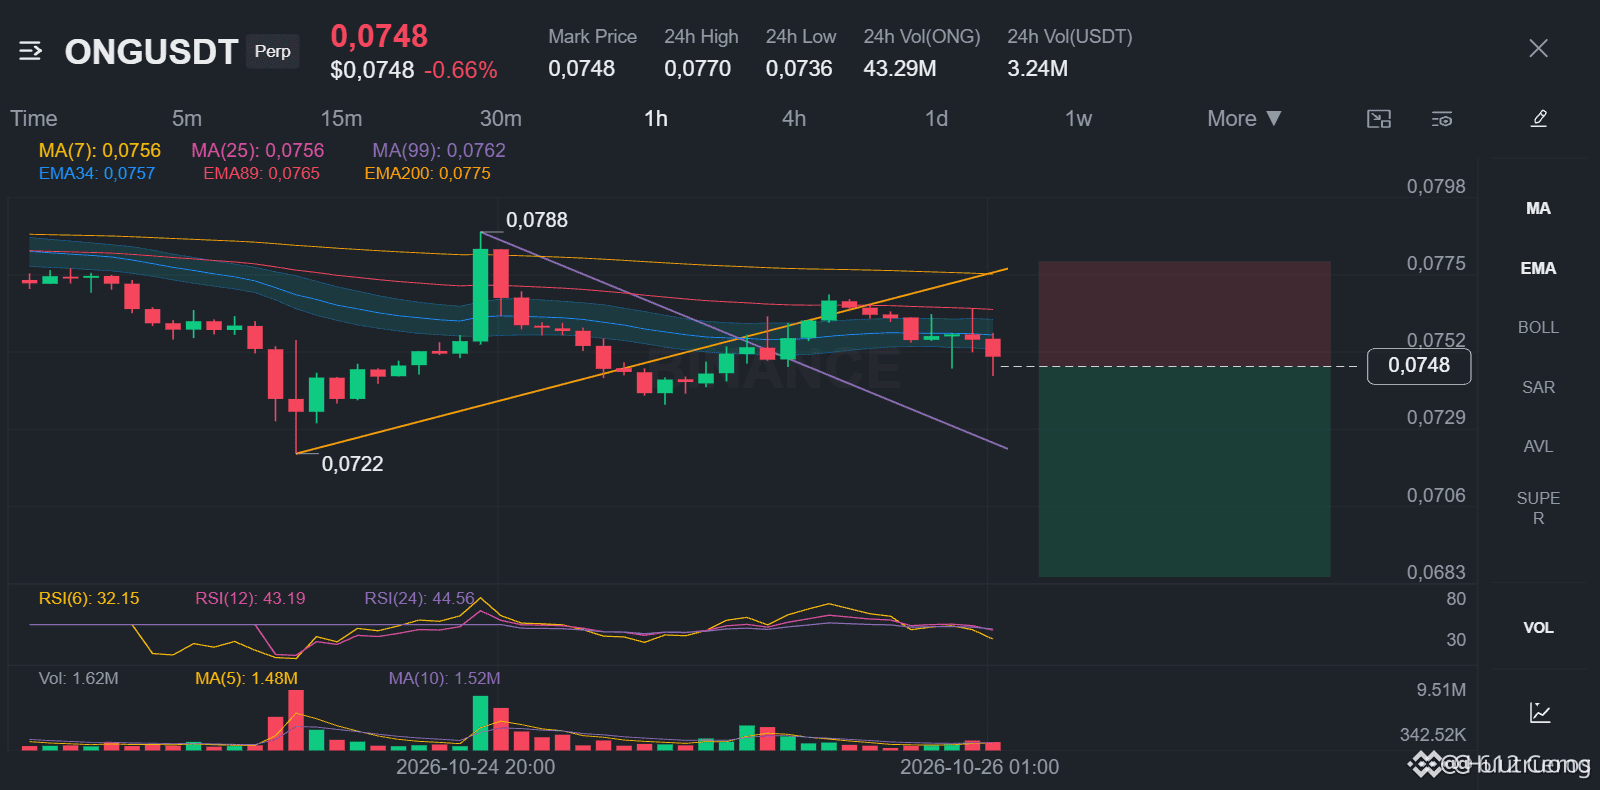
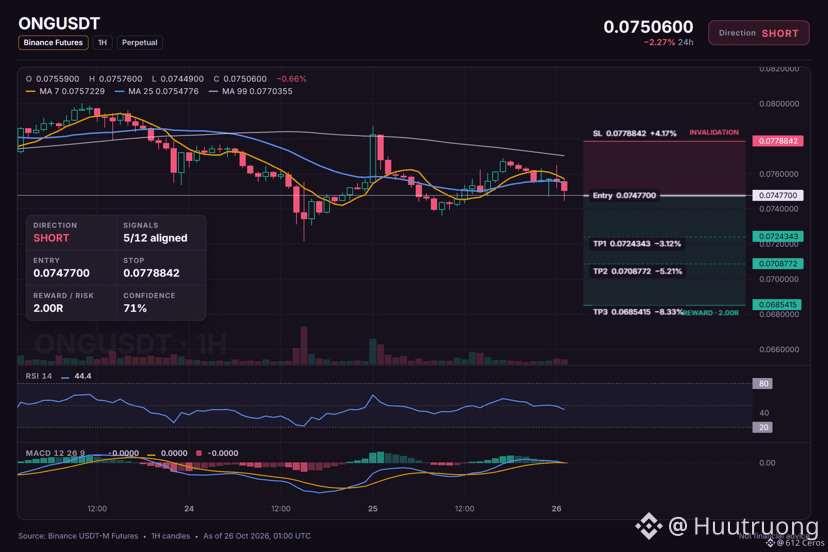
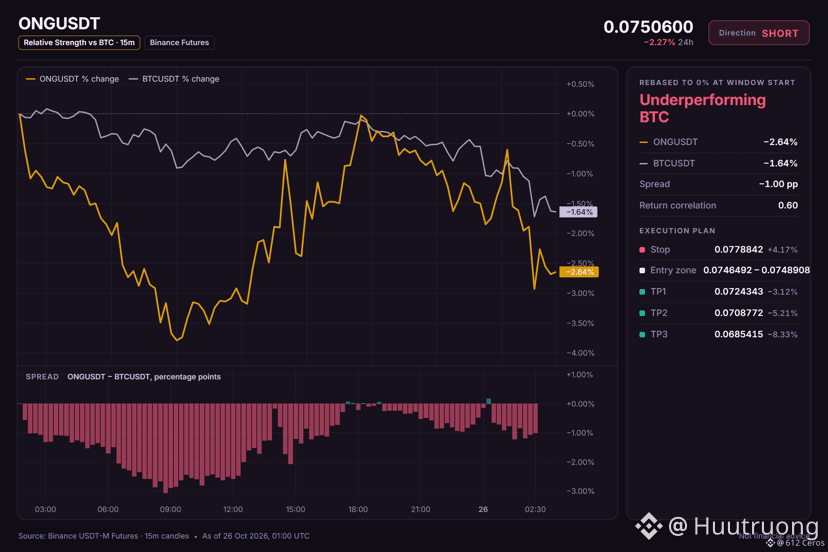
🔴 CORTO $ONG /USDT: se espera que el precio BAJE
Sesgo: CORTO · Inclinación
Entrada: 0.0746492 – 0.0748908
TP1: 0.0724343 (-3.1%)
TP2: 0.0708772 (-5.2%)
TP3: 0.0685415 (-8.3%)
SL: 0.0778842 (+4.2%)
Plan: entra solo dentro de la zona, cierra el 50% en TP1, el 25% en TP2 y el 25% en TP3, y mueve el stop al precio de entrada después de TP1.
Nota: la convicción es moderada; mantén un tamaño de posición pequeño.
¿Por qué CORTO? 5/12 señales coinciden y 0 están en contra.
• Tendencia bajista en 4 h (por debajo de EMA50 y EMA200)
• Tendencia bajista en 1 h (por debajo de EMA50 y EMA200)
• Los vendedores impulsan el movimiento (ADX de 15 min: 22.2)
En palabras sencillas:
ONG está cayendo en una estructura bajista en los marcos temporales de 1 h y 4 h, y la tendencia de 4 h apunta a la baja. El RSI de 1 h está por debajo de 45, lo que indica que los vendedores aún tienen el impulso, y el ADX muestra que DI- está muy por encima de DI+, lo que significa que los vendedores tienen el control.
¿Dónde pondrías el stop para esta operación en corto?
{spot}(ONGUSDT)
ONG parece lista para una operación en corto, aunque la convicción es moderada.
🔴 CORTO $ONG /USDT: se espera que el precio BAJE
Sesgo: CORTO · Inclinación
Entrada: 0.0746492 – 0.0748908
TP1: 0.0724343 (-3.1%)
TP2: 0.0708772 (-5.2%)
TP3: 0.0685415 (-8.3%)
SL: 0.0778842 (+4.2%)
Plan: entra solo dentro de la zona, cierra el 50% en TP1, el 25% en TP2 y el 25% en TP3, y mueve el stop al precio de entrada después de TP1.
Nota: la convicción es moderada; mantén un tamaño de posición pequeño.
¿Por qué CORTO? 5/12 señales coinciden y 0 están en contra.
• Tendencia bajista en 4 h (por debajo de EMA50 y EMA200)
• Tendencia bajista en 1 h (por debajo de EMA50 y EMA200)
• Los vendedores impulsan el movimiento (ADX de 15 min: 22.2)
En palabras sencillas:
ONG está cayendo en una estructura bajista en los marcos temporales de 1 h y 4 h, y la tendencia de 4 h apunta a la baja. El RSI de 1 h está por debajo de 45, lo que indica que los vendedores aún tienen el impulso, y el ADX muestra que DI- está muy por encima de DI+, lo que significa que los vendedores tienen el control.
¿Dónde pondrías el stop para esta operación en corto?
81
·
--
Bajista
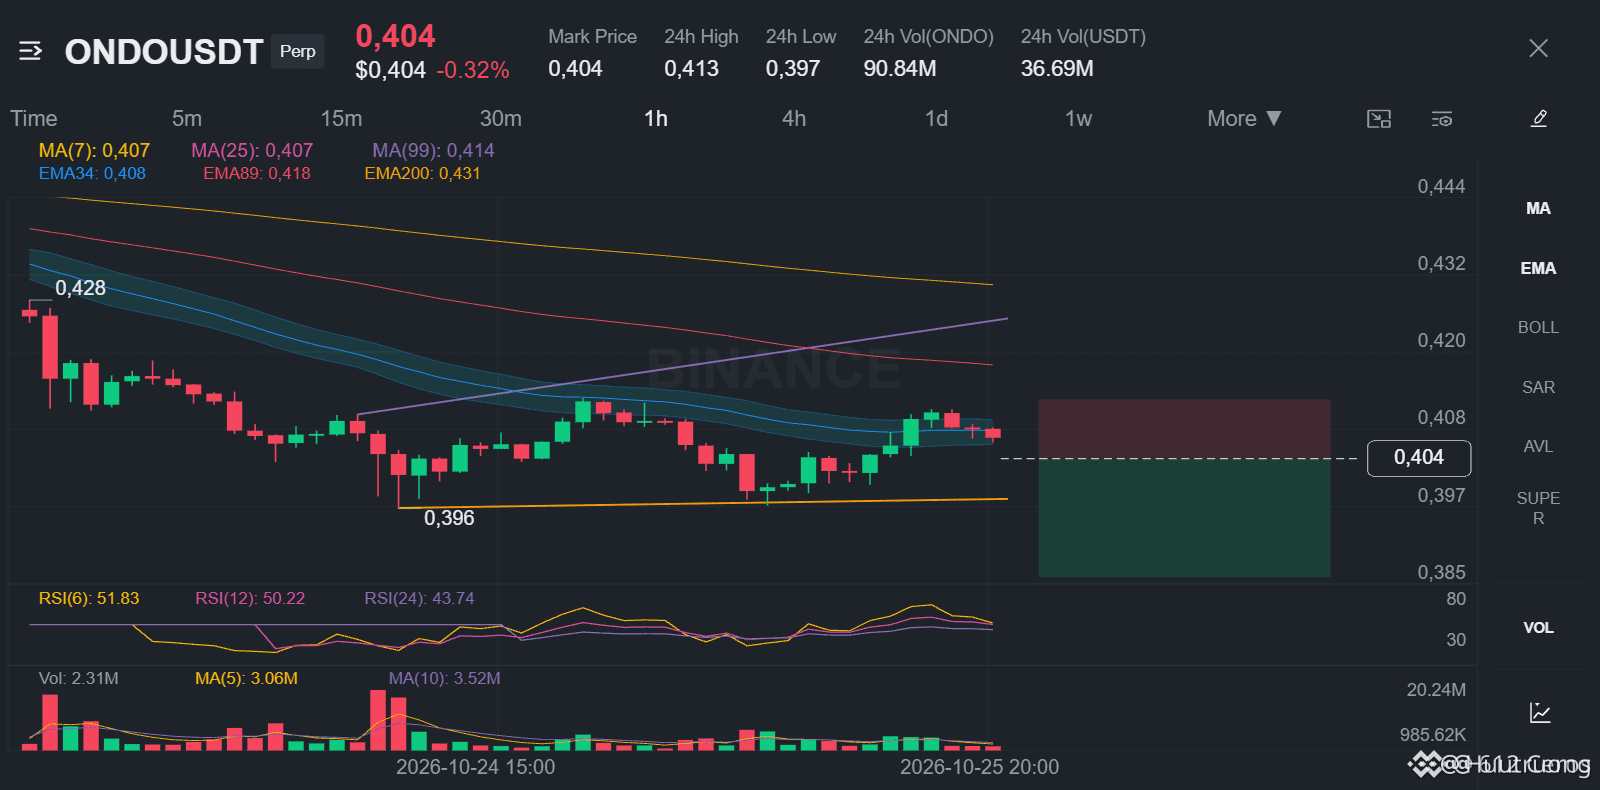
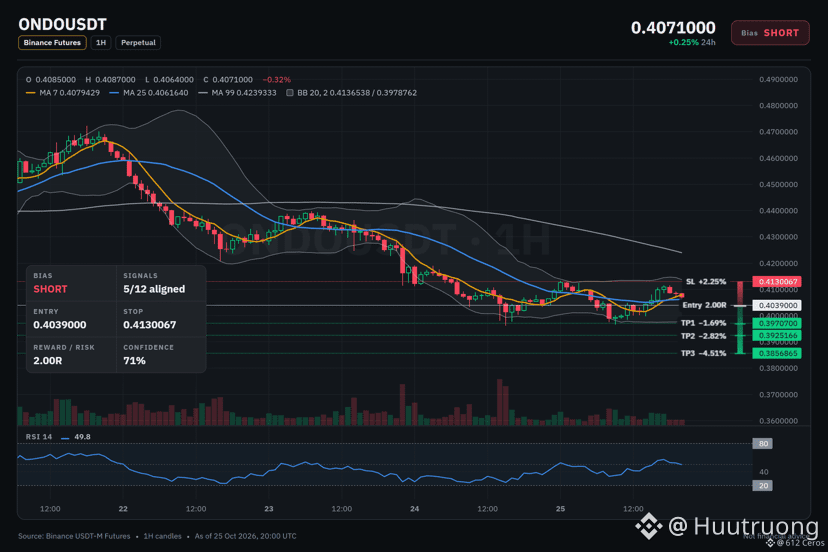
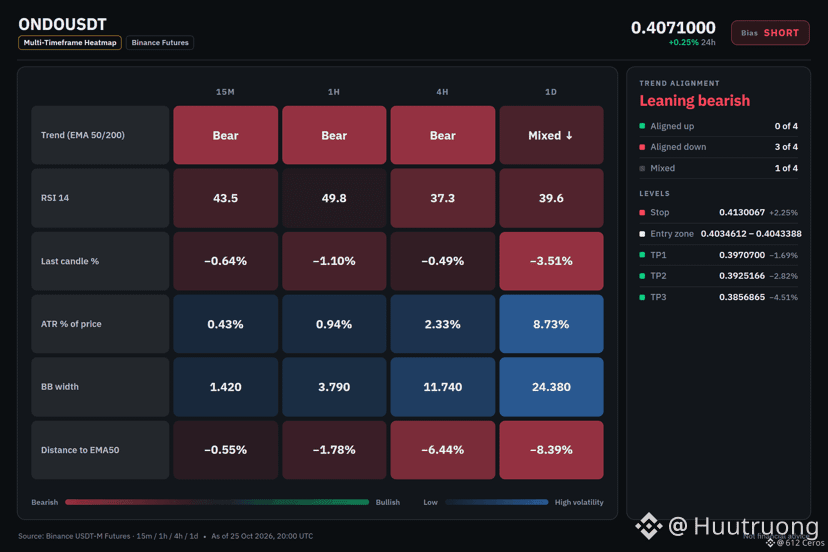
ONDO 4h con estructura bajista y los vendedores al mando.
🔴 CORTO $ONDO /USDT: se espera que el precio BAJE
Sesgo: CORTO · Inclinación
Entrada: 0.4034612 – 0.4043388
TP1: 0.3970700 (-1.7%)
TP2: 0.3925166 (-2.8%)
TP3: 0.3856865 (-4.5%)
SL: 0.4130067 (+2.3%)
Plan: entrar solo dentro de la zona, cerrar el 50% en TP1, el 25% en TP2 y el 25% en TP3, y mover el stop al precio de entrada después de TP1.
Nota: convicción moderada; mantén un tamaño de posición pequeño.
¿Por qué CORTO? 5/12 señales coinciden, 0 en contra.
• Tendencia bajista en 4h (por debajo de EMA50 y EMA200)
• Tendencia bajista en 1h (por debajo de EMA50 y EMA200)
• Los vendedores impulsan el movimiento (ADX de 15m: 20.5)
Plan A:
Si la estrategia funciona, el precio en 1h continúa por debajo de EMA50 y EMA200, con el objetivo de alcanzar el mínimo de entrada en 1h de 0.4034612.
Plan B (invalidación):
Un cierre diario por encima de 0.4130067 invalidaría la operación en corto y saldría de ella.
¿Dónde colocarías tu stop en esta operación?
{spot}(ONDOUSDT)
ONDO 4h con estructura bajista y los vendedores al mando.
🔴 CORTO $ONDO /USDT: se espera que el precio BAJE
Sesgo: CORTO · Inclinación
Entrada: 0.4034612 – 0.4043388
TP1: 0.3970700 (-1.7%)
TP2: 0.3925166 (-2.8%)
TP3: 0.3856865 (-4.5%)
SL: 0.4130067 (+2.3%)
Plan: entrar solo dentro de la zona, cerrar el 50% en TP1, el 25% en TP2 y el 25% en TP3, y mover el stop al precio de entrada después de TP1.
Nota: convicción moderada; mantén un tamaño de posición pequeño.
¿Por qué CORTO? 5/12 señales coinciden, 0 en contra.
• Tendencia bajista en 4h (por debajo de EMA50 y EMA200)
• Tendencia bajista en 1h (por debajo de EMA50 y EMA200)
• Los vendedores impulsan el movimiento (ADX de 15m: 20.5)
Plan A:
Si la estrategia funciona, el precio en 1h continúa por debajo de EMA50 y EMA200, con el objetivo de alcanzar el mínimo de entrada en 1h de 0.4034612.
Plan B (invalidación):
Un cierre diario por encima de 0.4130067 invalidaría la operación en corto y saldría de ella.
¿Dónde colocarías tu stop en esta operación?
26
·
--
Bajista
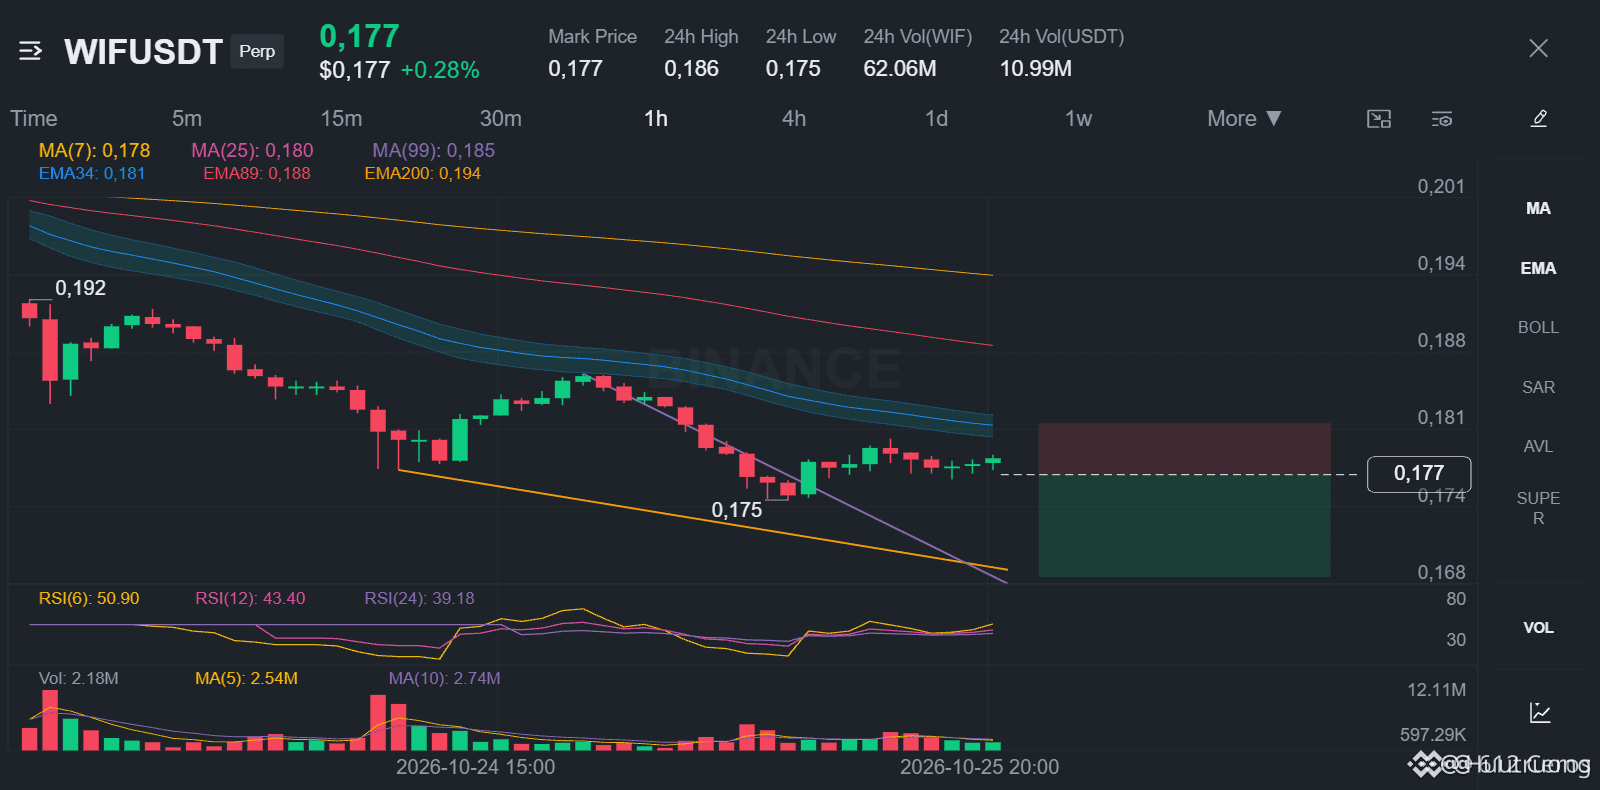
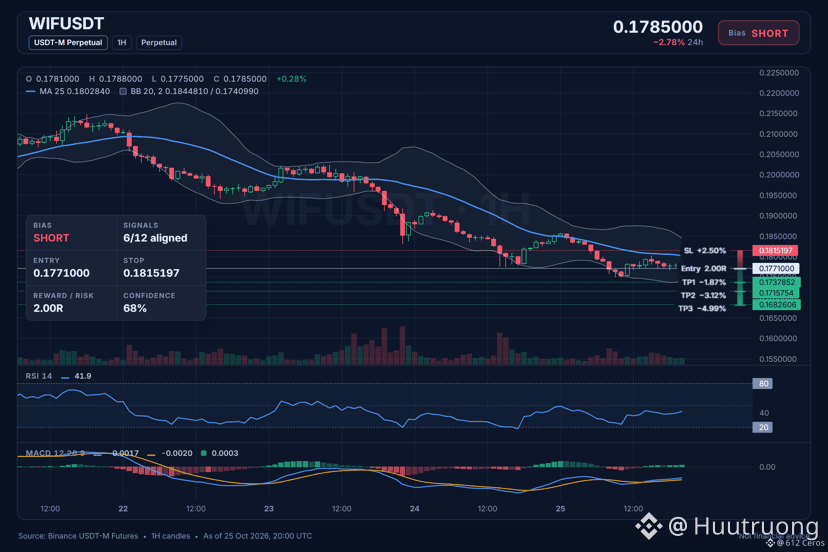
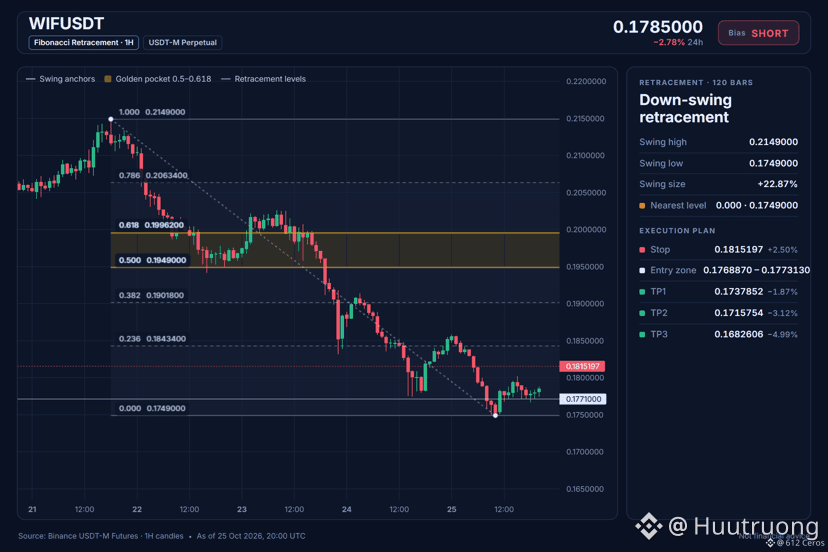
Configuración corta de WIF: tendencia bajista en el gráfico de 4 h.
🔴 CORTO $WIF /USDT: se espera que el precio BAJE
Sesgo: CORTO · Fuerte
Entrada: 0.1768870 – 0.1773130
TP1: 0.1737852 (-1.9%)
TP2: 0.1715754 (-3.1%)
TP3: 0.1682606 (-5.0%)
SL: 0.1815197 (+2.5%)
Plan: entra solo dentro de la zona, cierra el 50% en TP1, el 25% en TP2 y el 25% en TP3, y mueve el stop al precio de entrada después de TP1.
¿Por qué CORTO? Esto es lo que comprobé: 6/12 están de acuerdo, 1 en contra.
• Tendencia de 4 h bajista (por debajo de EMA50 y EMA200)
• Tendencia de 1 h bajista (por debajo de EMA50 y EMA200)
• BTC está cayendo y esta moneda lo sigue (correlación: 0.77)
Atención: Está muy por debajo de su promedio; es probable un rebote (−3.6 ATR desde la EMA50 de 1 h)
Atención: La idea queda invalidada si el precio alcanza el stop en 0.1815197
Veredicto: La tendencia de 4 h es bajista y el precio está por debajo de ambas medias móviles, pero el precio en 1 h está sobreextendido y podría rebotar.
¿Cuál es tu nivel o pronóstico para WIF?
{spot}(WIFUSDT)
Configuración corta de WIF: tendencia bajista en el gráfico de 4 h.
🔴 CORTO $WIF /USDT: se espera que el precio BAJE
Sesgo: CORTO · Fuerte
Entrada: 0.1768870 – 0.1773130
TP1: 0.1737852 (-1.9%)
TP2: 0.1715754 (-3.1%)
TP3: 0.1682606 (-5.0%)
SL: 0.1815197 (+2.5%)
Plan: entra solo dentro de la zona, cierra el 50% en TP1, el 25% en TP2 y el 25% en TP3, y mueve el stop al precio de entrada después de TP1.
¿Por qué CORTO? Esto es lo que comprobé: 6/12 están de acuerdo, 1 en contra.
• Tendencia de 4 h bajista (por debajo de EMA50 y EMA200)
• Tendencia de 1 h bajista (por debajo de EMA50 y EMA200)
• BTC está cayendo y esta moneda lo sigue (correlación: 0.77)
Atención: Está muy por debajo de su promedio; es probable un rebote (−3.6 ATR desde la EMA50 de 1 h)
Atención: La idea queda invalidada si el precio alcanza el stop en 0.1815197
Veredicto: La tendencia de 4 h es bajista y el precio está por debajo de ambas medias móviles, pero el precio en 1 h está sobreextendido y podría rebotar.
¿Cuál es tu nivel o pronóstico para WIF?
2
19
·
--
Bajista
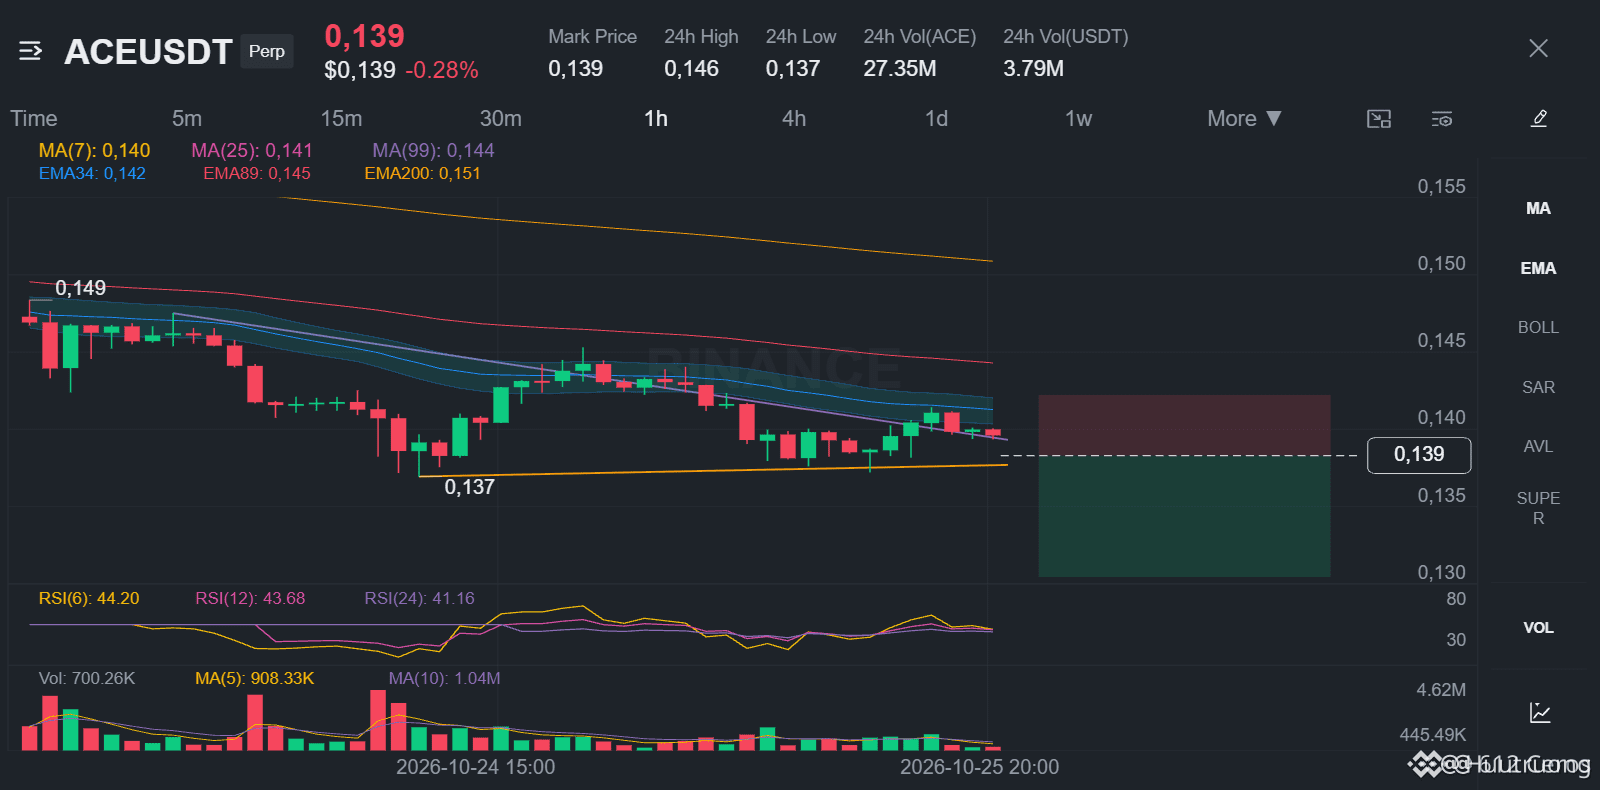
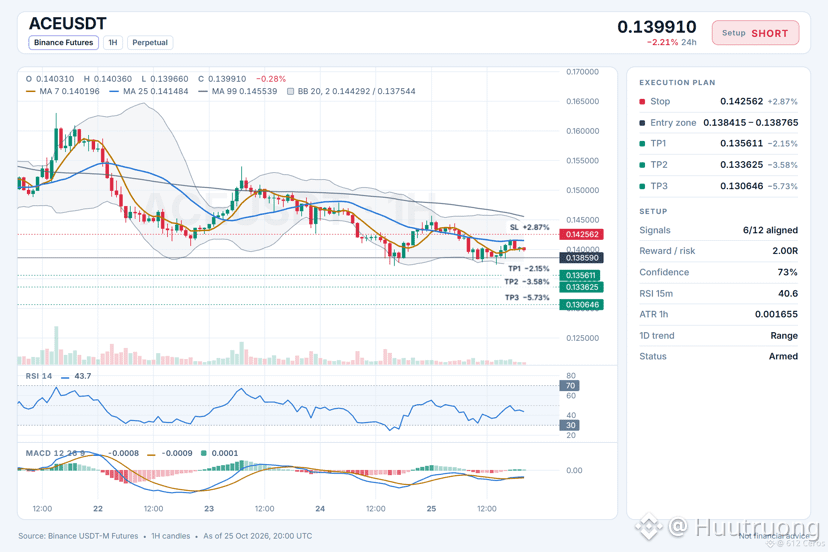
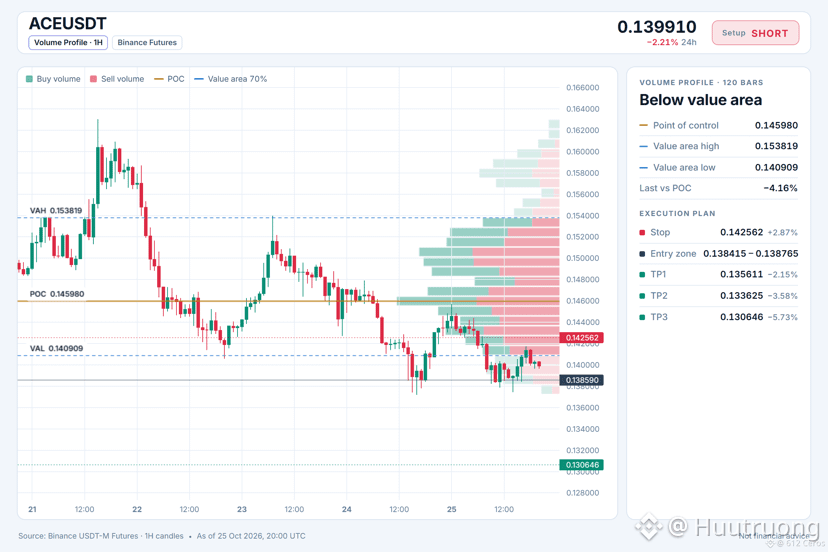
¿Está ACE listo para prolongar su caída?
🔴 CORTO $ACE /USDT: se espera que el precio BAJE
Sesgo: CORTO · Fuerte
Entrada: 0.138415 – 0.138765
TP1: 0.135611 (-2.1%)
TP2: 0.133625 (-3.6%)
TP3: 0.130646 (-5.7%)
SL: 0.142562 (+2.9%)
Plan: entra solo dentro de la zona, cierra el 50% en TP1, el 25% en TP2 y el 25% en TP3, y mueve el stop al precio de entrada después de TP1.
¿Por qué CORTO? 6/12 señales coinciden, 0 están en contra.
• Tendencia bajista en 4h (por debajo de EMA50 y EMA200)
• Tendencia bajista en 1h (por debajo de EMA50 y EMA200)
• BTC está cayendo y esta moneda lo sigue (correlación: 0.77)
¿Por qué ahora?
ACE ya está por debajo de las EMA de 1h y 4h, y la estructura de EMA de 4h es bajista, lo que significa que los vendedores controlan la tendencia a corto plazo y la tendencia oscilante. BTC también está cayendo, con una correlación de 0.77, por lo que ACE tiende a seguirlo. El RSI de 1h está en 43.7, por debajo de 45, lo que confirma que los vendedores aún mantienen el impulso.
¿Dónde colocarías tu nivel de invalidación?
{spot}(ACEUSDT)
¿Está ACE listo para prolongar su caída?
🔴 CORTO $ACE /USDT: se espera que el precio BAJE
Sesgo: CORTO · Fuerte
Entrada: 0.138415 – 0.138765
TP1: 0.135611 (-2.1%)
TP2: 0.133625 (-3.6%)
TP3: 0.130646 (-5.7%)
SL: 0.142562 (+2.9%)
Plan: entra solo dentro de la zona, cierra el 50% en TP1, el 25% en TP2 y el 25% en TP3, y mueve el stop al precio de entrada después de TP1.
¿Por qué CORTO? 6/12 señales coinciden, 0 están en contra.
• Tendencia bajista en 4h (por debajo de EMA50 y EMA200)
• Tendencia bajista en 1h (por debajo de EMA50 y EMA200)
• BTC está cayendo y esta moneda lo sigue (correlación: 0.77)
¿Por qué ahora?
ACE ya está por debajo de las EMA de 1h y 4h, y la estructura de EMA de 4h es bajista, lo que significa que los vendedores controlan la tendencia a corto plazo y la tendencia oscilante. BTC también está cayendo, con una correlación de 0.77, por lo que ACE tiende a seguirlo. El RSI de 1h está en 43.7, por debajo de 45, lo que confirma que los vendedores aún mantienen el impulso.
¿Dónde colocarías tu nivel de invalidación?
13
Inicia sesión para explorar más contenidos
Únete a usuarios globales de criptomonedas en Binance Square
⚡️ Obtén información útil y actualizada sobre criptos.
💬 Avalado por el mayor exchange de criptomonedas en el mundo.
👍 Descubre perspectivas reales de creadores verificados.
Email/número de teléfono
Temas populares
BinancePick
2.5M vistas
137,704 están debatiendo
¡Únete a #TemporadaDeResultados: predice resultados en Binance Pick y comparte tu opinión en Binance Square!
Binance Square Official
·399 me gusta
·337k vistas
EarningsSeason
4.9M vistas
23,897 están debatiendo
ElectrumWalletBugLetRogueServersStealFunds
2,414 vistas
133 están debatiendo