[OCTOBER 1 Bitcoin chart analysis]
BTCUSD 30Min Chart
*My analysis is optimized for TradingView.
If you press the replay button, you can check real-time movements.
-Long position strategy-
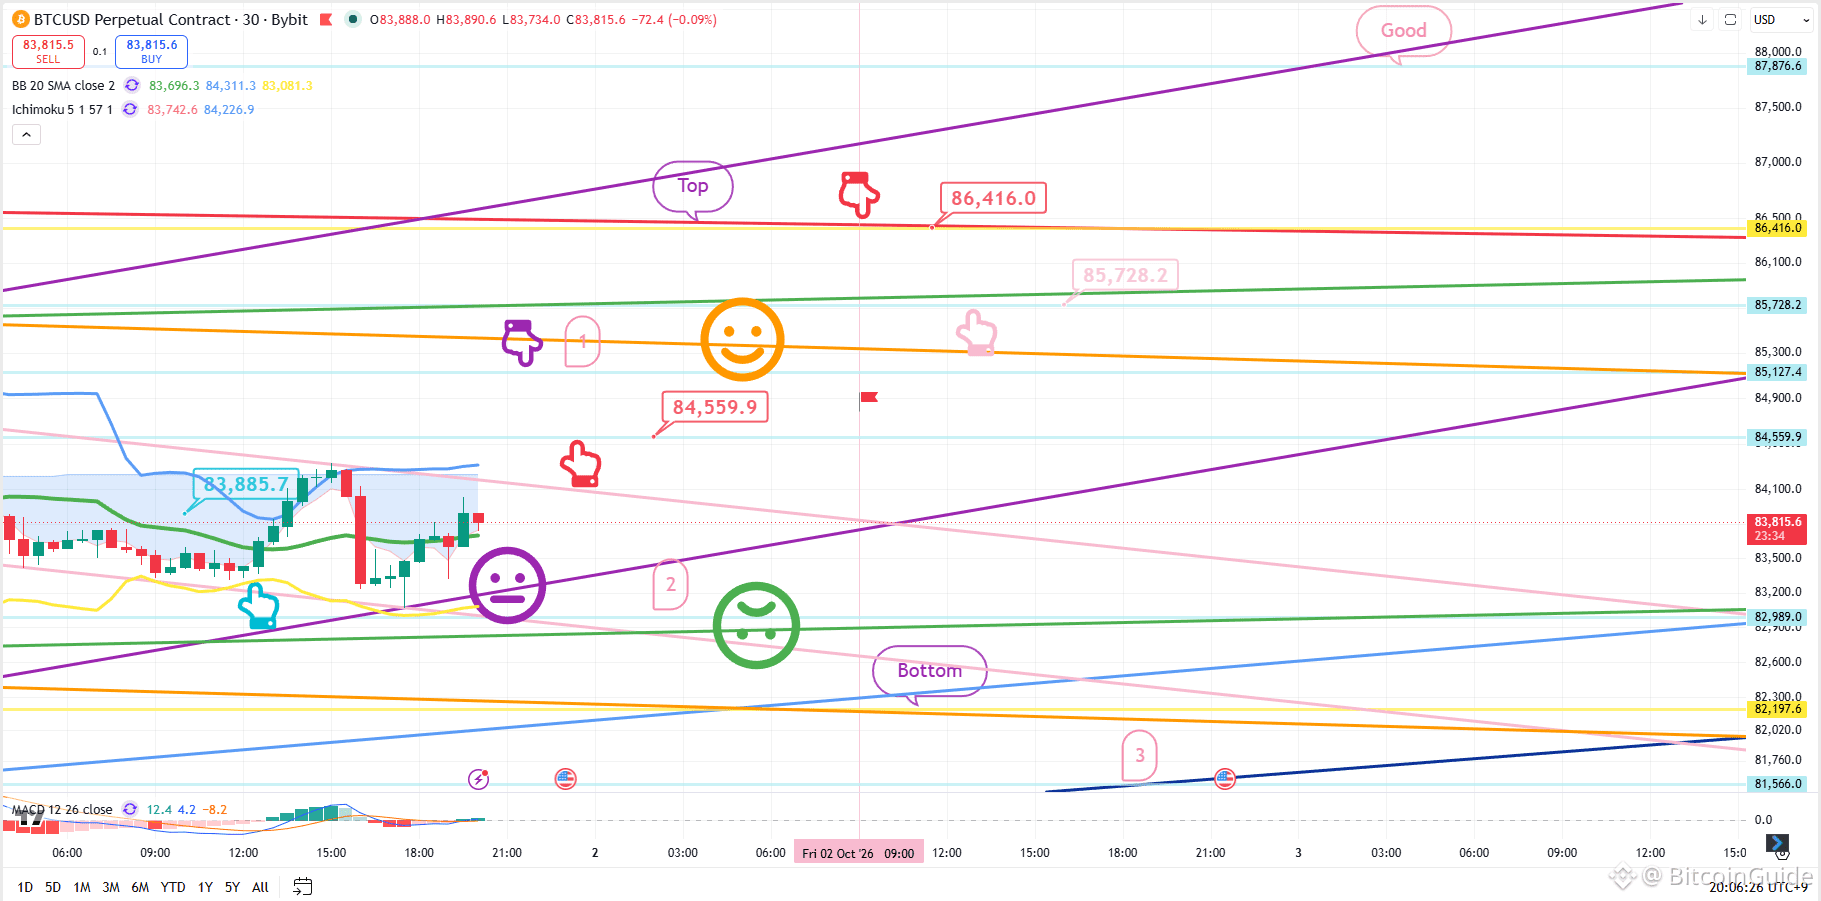
At the bottom left, indicated by the light blue finger, I have maintained the strategy for the long position entry point of $83,885.7 established yesterday.
Nasdaq economic data is scheduled for release at 11:00.
*Long position strategy based on touching the "Purple Finger 1" zone at the top:
1) After confirming a touch on "Purple Finger 1":
Long position entry at the red finger mark ($84,559.9) / Stop-loss if the purple support line is breached.
2) Top zone ($86,416) as the 1st target for the long position -> "Good" level as the 2nd target.
If the strategy succeeds, the $85.7K level can be used for re-entering a long position.
3) If the price drops without touching Zone 1:
Long position entry at Zone 2 ($82,989) / Stop-loss if the green support line is breached.
For those holding the $83.8K long position from yesterday,
it would be advisable to apply the same stop-loss level based on the green support line.
Once the green support line is breached,
the price could drop toward the "Bottom" zone marked below—potentially down to Zone 3—
so please exercise caution.
Although yesterday's monthly candle formed at the lower end,
it touched the Bollinger Bands' middle line;
therefore, if it holds without breaking the purple support line, the upward trend can continue.
I post the analysis results as a Comment every day.
Thank you.
(You can find the link on my profile.)
- Click Follow to receive faster information every day.
- Check the results using the replay button on TradingView.
#BTC100K #Altcoin Season# #Crypto #BTC Price Analysis# $ETH $XRP $USDT $BTC
BTCUSD 30Min Chart
*My analysis is optimized for TradingView.
If you press the replay button, you can check real-time movements.
-Long position strategy-
At the bottom left, indicated by the light blue finger, I have maintained the strategy for the long position entry point of $83,885.7 established yesterday.
Nasdaq economic data is scheduled for release at 11:00.
*Long position strategy based on touching the "Purple Finger 1" zone at the top:
1) After confirming a touch on "Purple Finger 1":
Long position entry at the red finger mark ($84,559.9) / Stop-loss if the purple support line is breached.
2) Top zone ($86,416) as the 1st target for the long position -> "Good" level as the 2nd target.
If the strategy succeeds, the $85.7K level can be used for re-entering a long position.
3) If the price drops without touching Zone 1:
Long position entry at Zone 2 ($82,989) / Stop-loss if the green support line is breached.
For those holding the $83.8K long position from yesterday,
it would be advisable to apply the same stop-loss level based on the green support line.
Once the green support line is breached,
the price could drop toward the "Bottom" zone marked below—potentially down to Zone 3—
so please exercise caution.
Although yesterday's monthly candle formed at the lower end,
it touched the Bollinger Bands' middle line;
therefore, if it holds without breaking the purple support line, the upward trend can continue.
I post the analysis results as a Comment every day.
Thank you.
(You can find the link on my profile.)
- Click Follow to receive faster information every day.
- Check the results using the replay button on TradingView.
#BTC100K #Altcoin Season# #Crypto #BTC Price Analysis# $ETH $XRP $USDT $BTC