
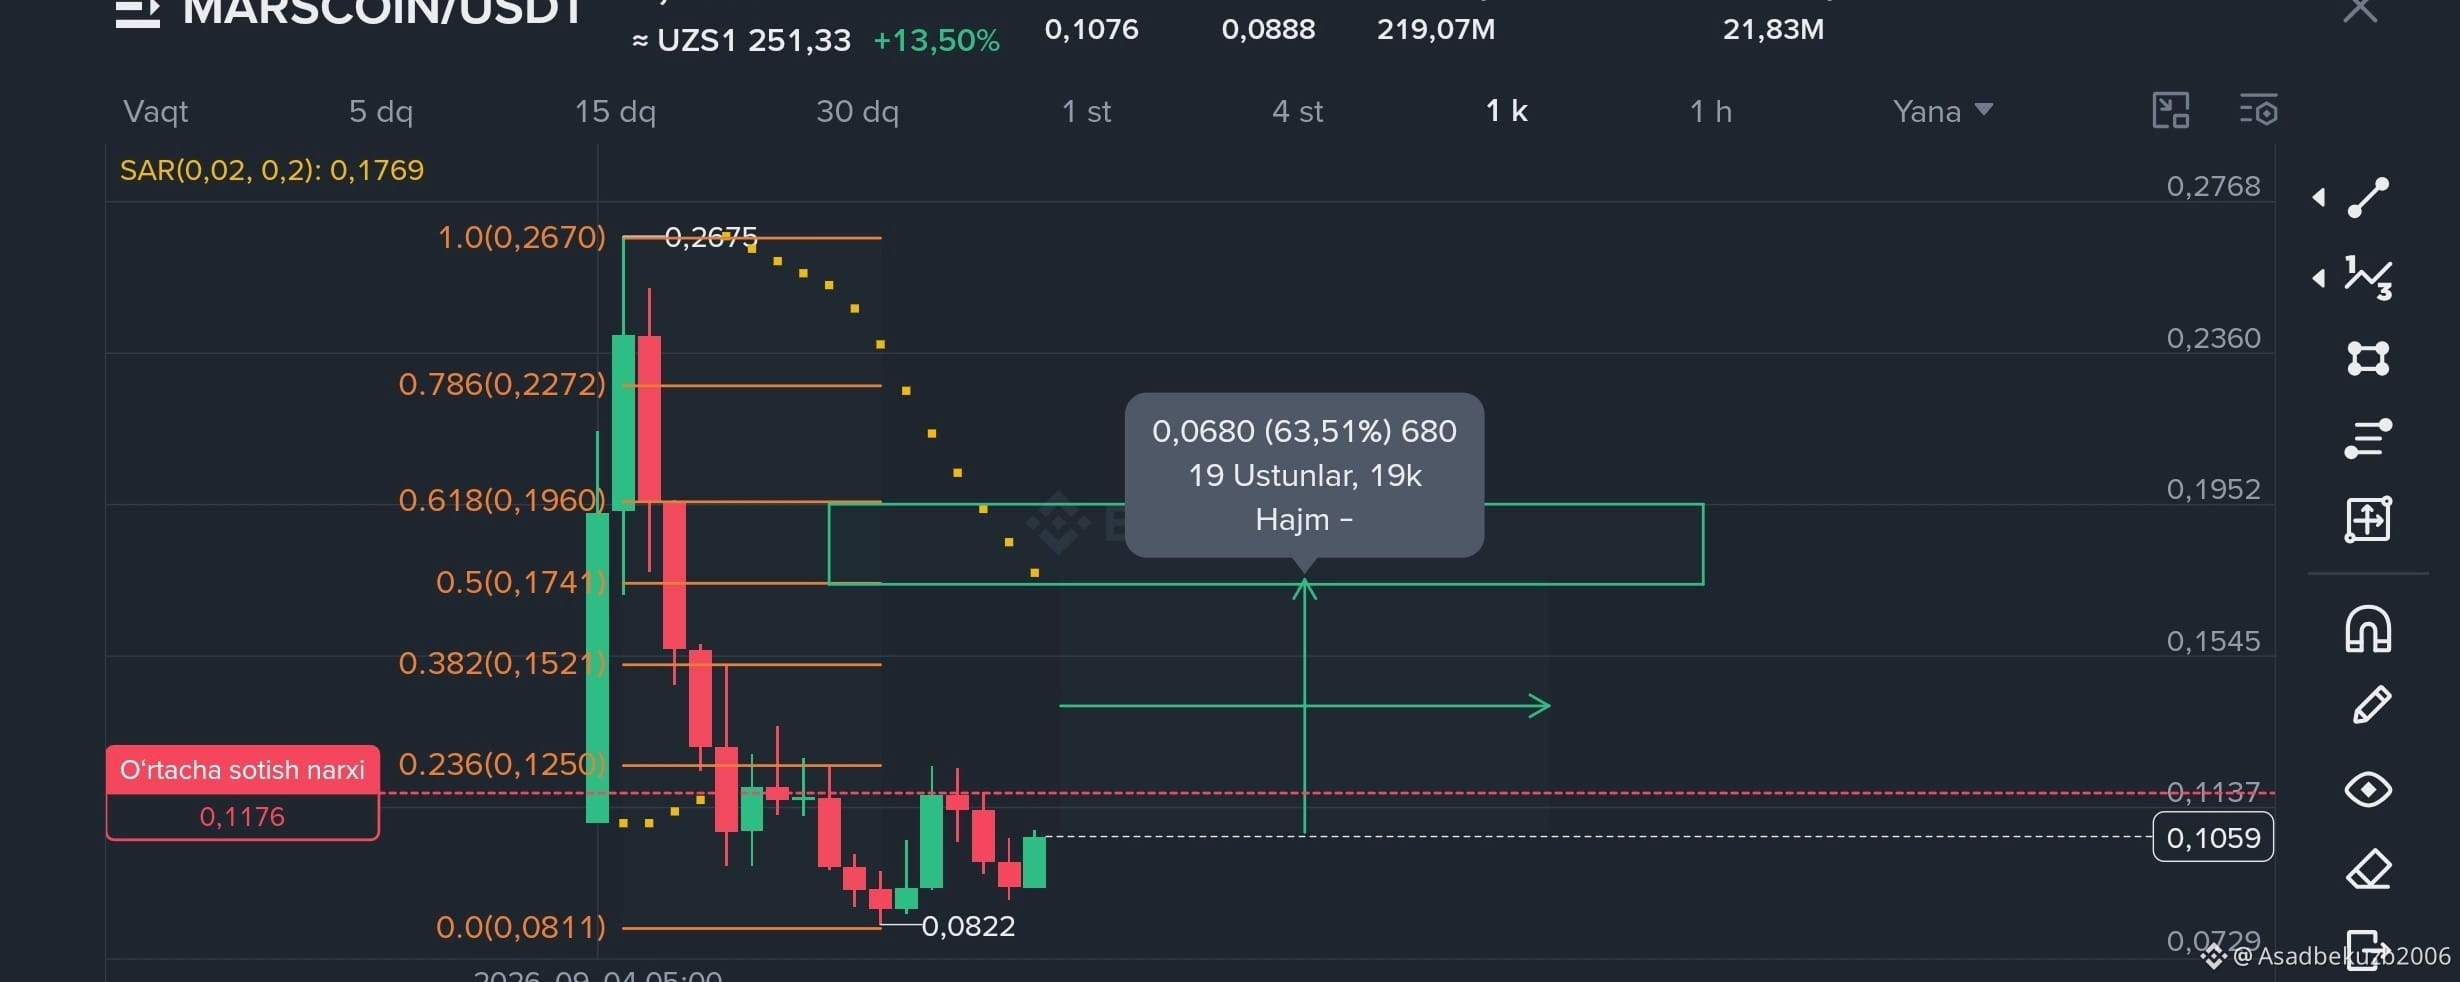

MARSCOIN/USDT is showing interesting price action after a significant decline from its recent high. With the price attempting to stabilize near the lower range, I’m monitoring a potential recovery scenario based on Fibonacci retracement levels and key resistance zones.
Could MARSCOIN make a stronger move toward the upper levels? Let’s analyze the chart. 👇
📊 Current Price: 0.1059 USDT
🔹 24H Change: +13.50%
🔹 24H High: 0.1076 USDT
🔹 24H Low: 0.0888 USDT
🔹 Previous High: 0.2675 USDT
🔹 Recent Low: 0.0822 USDT
🔹 Measured Upside: Approximately 63.51%
📈 MY TECHNICAL ANALYSIS
Looking at the 1D chart, MARSCOIN has experienced a strong decline from its previous high near 0.2675 USDT.
After reaching the lower price area around 0.0822 USDT, the market has shown signs of stabilization, with recent candles indicating an attempt to recover.
I’ve used Fibonacci retracement levels to identify potential resistance areas and a possible upside scenario.
🎯 MY MAIN RESISTANCE ZONE
The highlighted zone is located approximately between 0.1741 and 0.1960 USDT, which corresponds to the 0.5 and 0.618 Fibonacci retracement levels on my chart.
Based on my measured move, the potential upside is approximately 63.51% from the reference point.
However, this is a technical projection, not a guaranteed target. The price must overcome several resistance levels before reaching this zone.
🔍 KEY FIBONACCI LEVELS TO WATCH
📌 0.236 — 0.1250 USDT
An initial Fibonacci resistance level to monitor if the recovery continues.
📌 0.382 — 0.1521 USDT
An intermediate level that could become relevant during a stronger upward move.
📌 0.5 — 0.1741 USDT
A key Fibonacci retracement level within the lower part of my highlighted resistance zone.
📌 0.618 — 0.1960 USDT
The upper Fibonacci reference level of the highlighted zone.
📌 0.786 — 0.2272 USDT
A higher retracement level to monitor if the price continues recovering.
🟢 BULLISH SCENARIO
If MARSCOIN maintains its recovery momentum and breaks through the intermediate Fibonacci levels with increased trading volume, the highlighted resistance zone between 0.1741 and 0.1960 USDT could become an area of interest.
A confirmed daily candle close above key resistance levels would provide stronger evidence than a temporary price spike.
🔴 BEARISH / REJECTION SCENARIO
If the price fails to maintain its recovery and sellers regain control, MARSCOIN could retest lower support areas.
The recent low around 0.0822 USDT is an important reference point on this chart. However, previous support does not guarantee that the price will hold there again.
📊 PARABOLIC SAR & PRICE ACTION
The Parabolic SAR dots on the chart appear above the latest price candles, suggesting that the indicator has not yet confirmed a bullish trend reversal.
For this reason, I would monitor whether the SAR shifts below price, together with volume and daily candle structure.
A single indicator should not be used as the only basis for a trading decision.
💡 FINAL THOUGHTS
MARSCOIN/USDT is now on my watchlist as the price attempts to recover from its recent lows.
The key question is:
Can MARSCOIN build enough momentum to break through the Fibonacci resistance levels and move toward the 0.1741–0.1960 USDT zone? 🚀
📈 Recovery continuation or another rejection?
What do you think about MARSCOIN’s current structure?
Share your technical analysis in the comments! 👇
⚠️ This article is for educational purposes only and does not constitute financial advice. Always conduct your own research and manage your risk.