The Binance trading interface contains a robust set of tools and options to help you in your trading analysis. These include:
- Candlestick charts
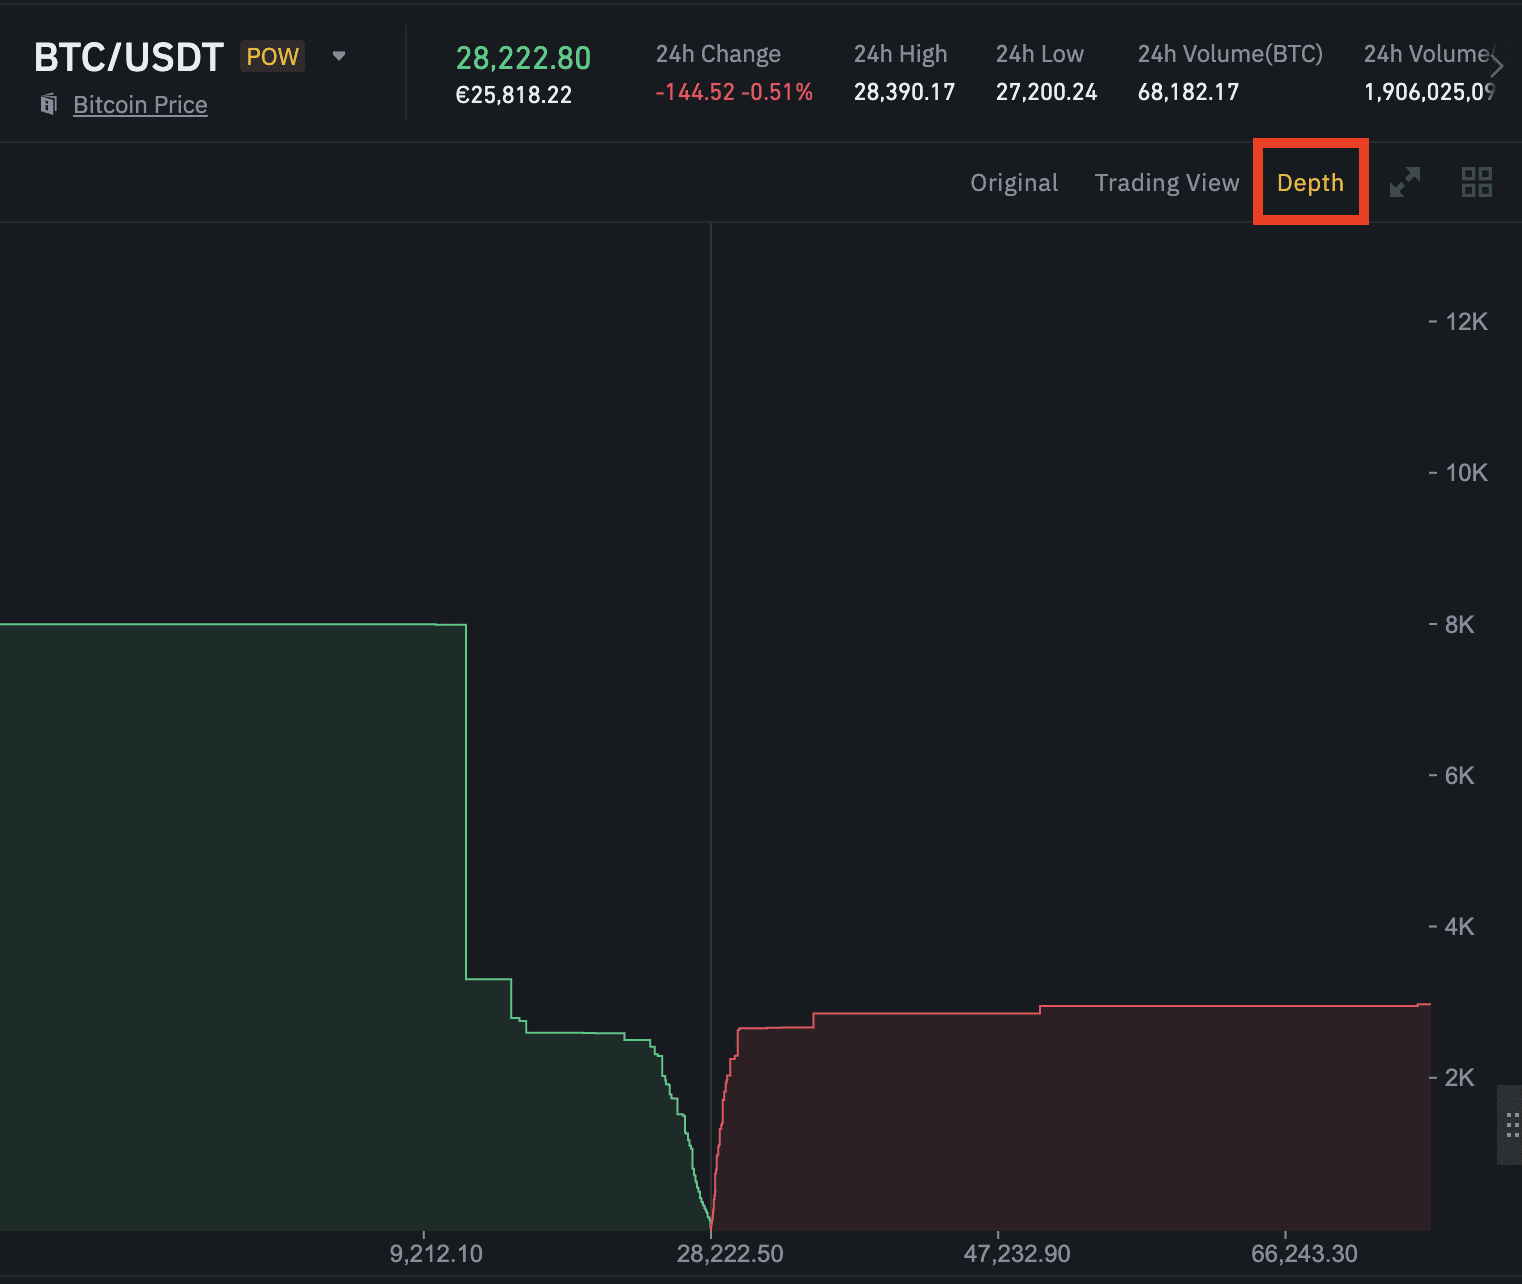
- Depth charts
- Time intervals
- Drawing tools
- Technical indicators
TradingView allows users to create a customized toolset for technical analysis. Let’s see how to use it on Binance.
How to access TradingView?
The TradingView and trading tools are accessible in the Classic, Advanced, and Full-Screen versions on the Binance trading interface. They offer different, editable layouts and you can easily switch between them at any time.
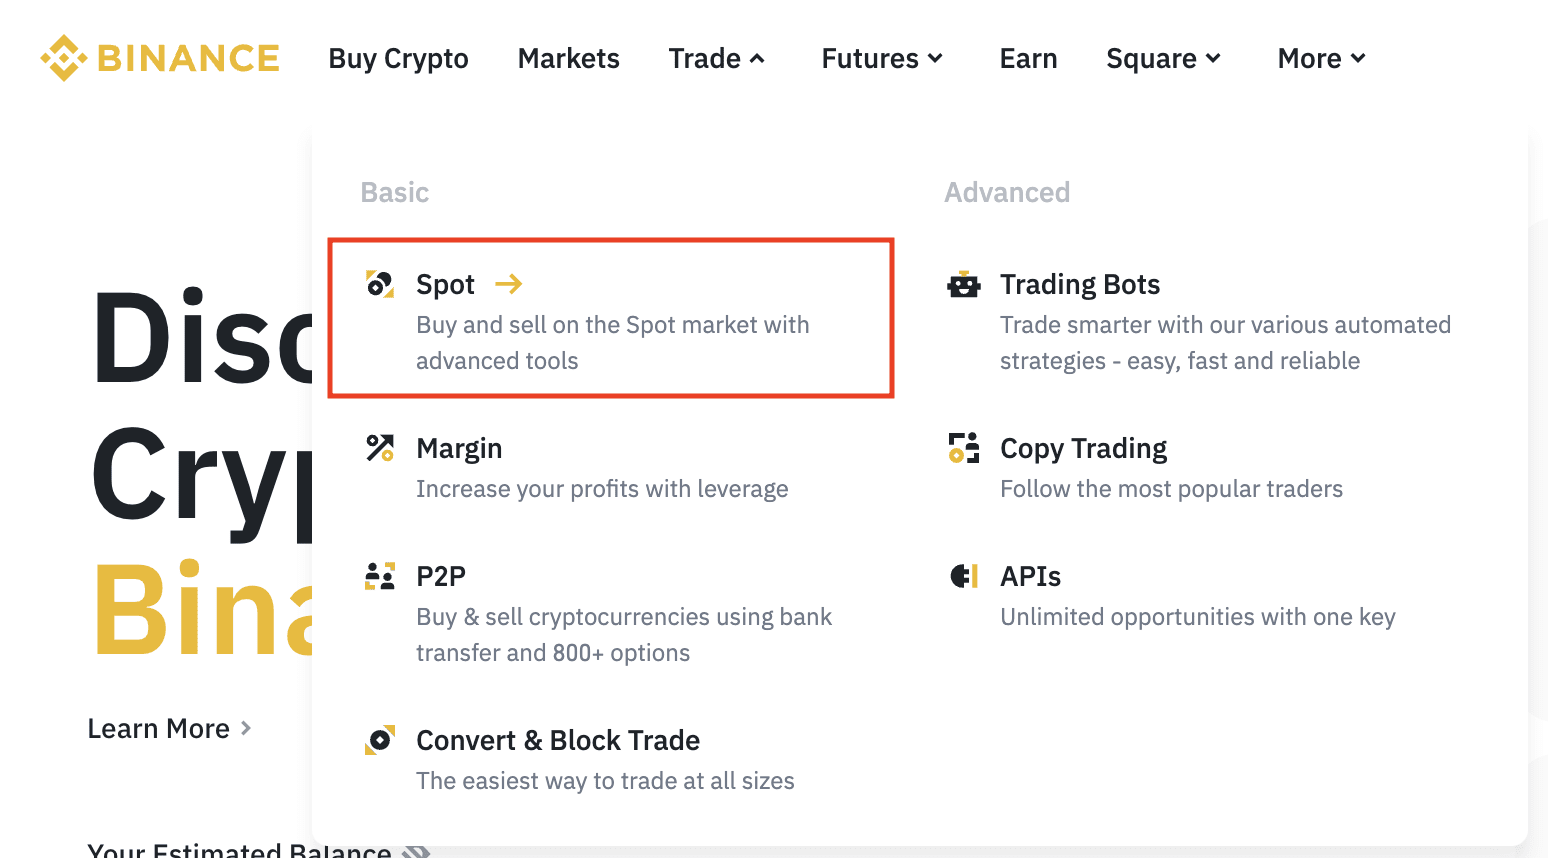
1. Log in to your Binance account and hover over [Trade]. Click [Spot].
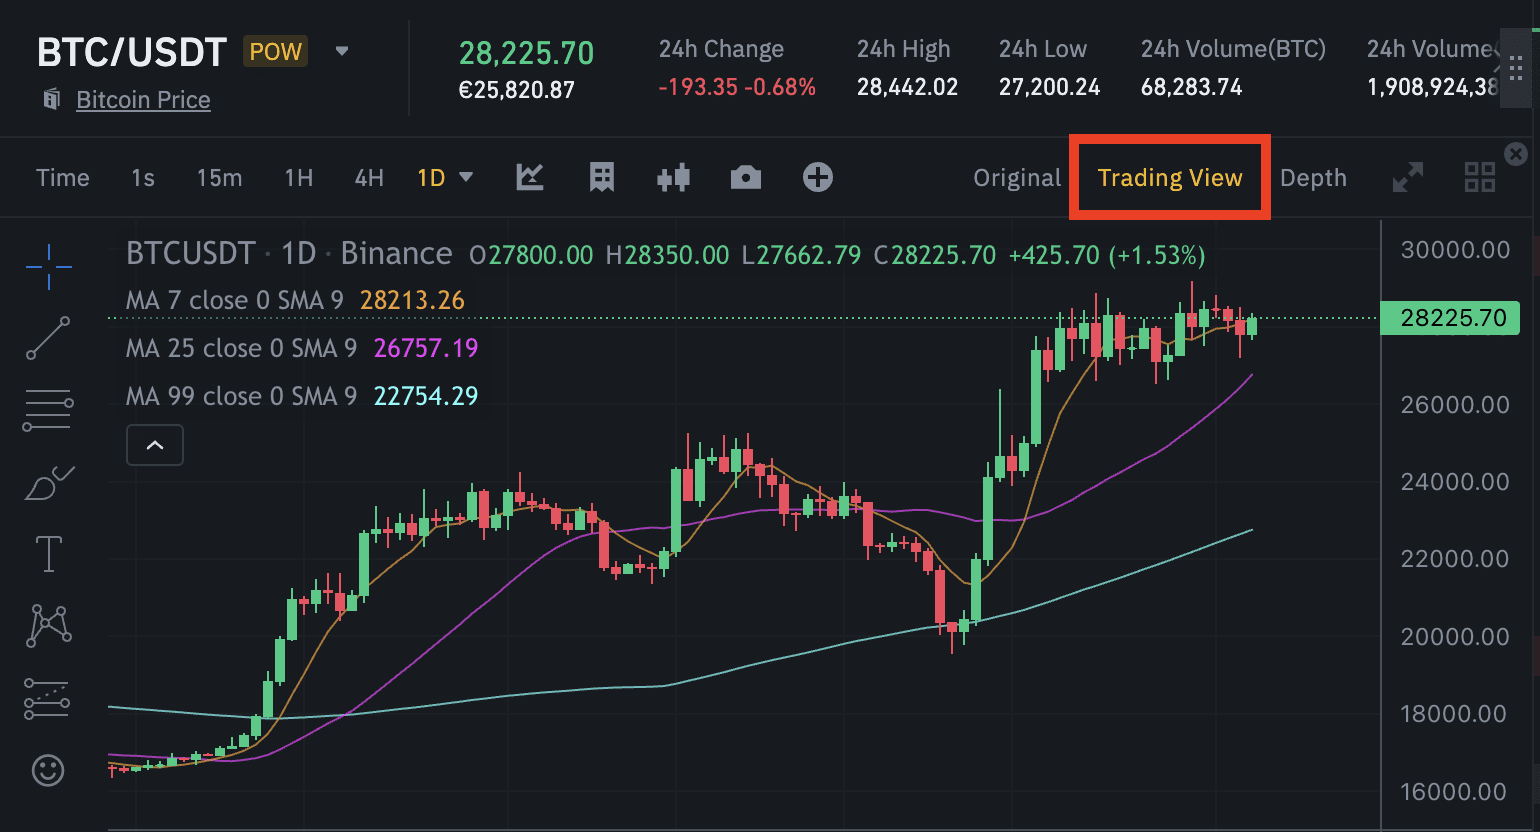
2. Click [TradingView] above the chart to gain full access to the trading tools available and candlestick charts.
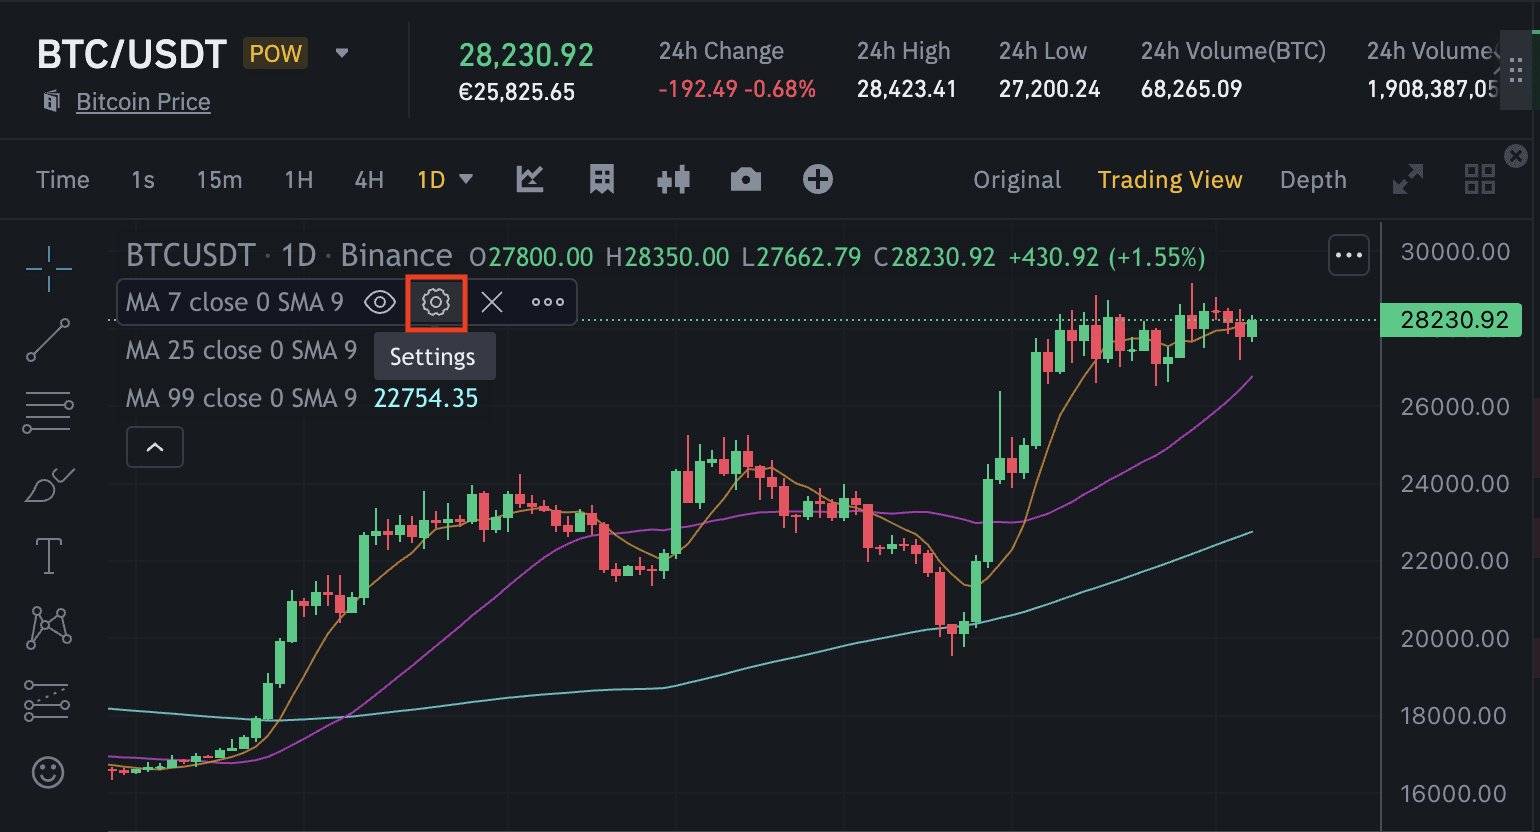
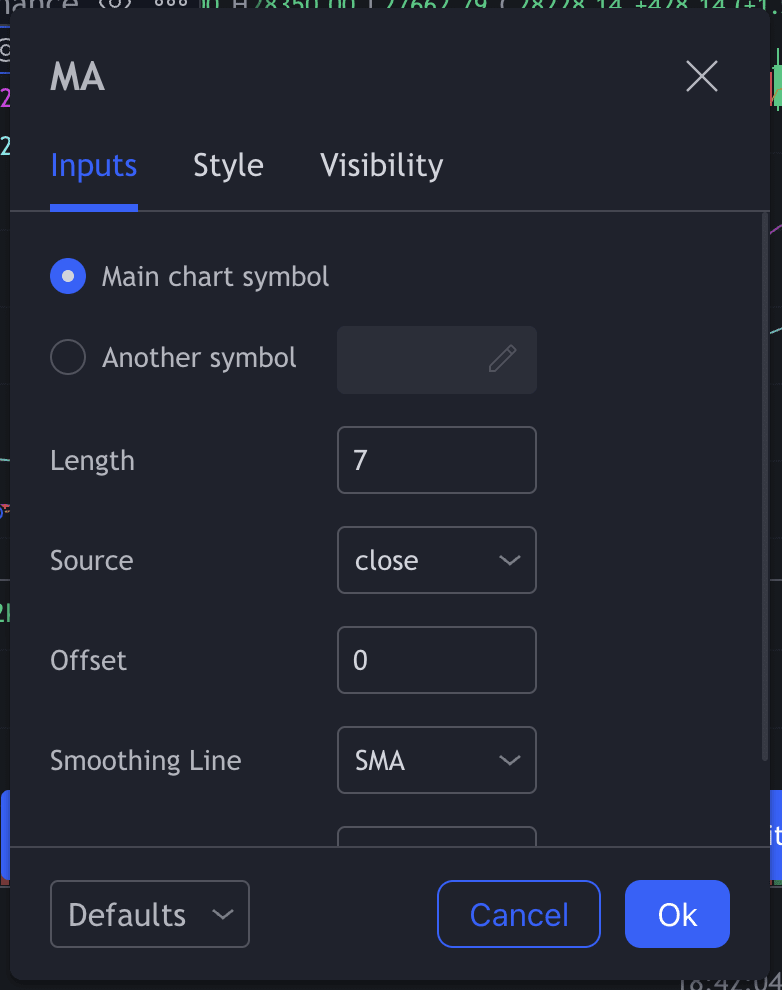
You will note that moving averages are already displayed on the chart. You can change their settings by clicking the [Settings] icon. Each moving average is adjusted according to the specified time frame. For example, MA 7 is the moving average over seven candles of your time interval (e.g., 7 hours if you are using a 1H chart or 7 days if it’s a 1D chart).
- MA 7 - Orange
- MA 25 - Purple
- MA 99 - Cyan
[Depth] provides a visual representation of unfilled buy/sell orders on the order book.
Candlestick charts
Candlestick charts are a graphical representation of the price movements of an asset. The timeframe of each candlestick is customizable and can represent a given period. Each candlestick contains the open price/close price/high price/low price, along with the highest and lowest price in the period.
For more detailed information on how candlesticks work, see Binance Academy, A Beginner's Guide to Candlestick Charts.
To customize your candlestick chart, double-click on any of the candles in [TradingView] to bring up its settings.
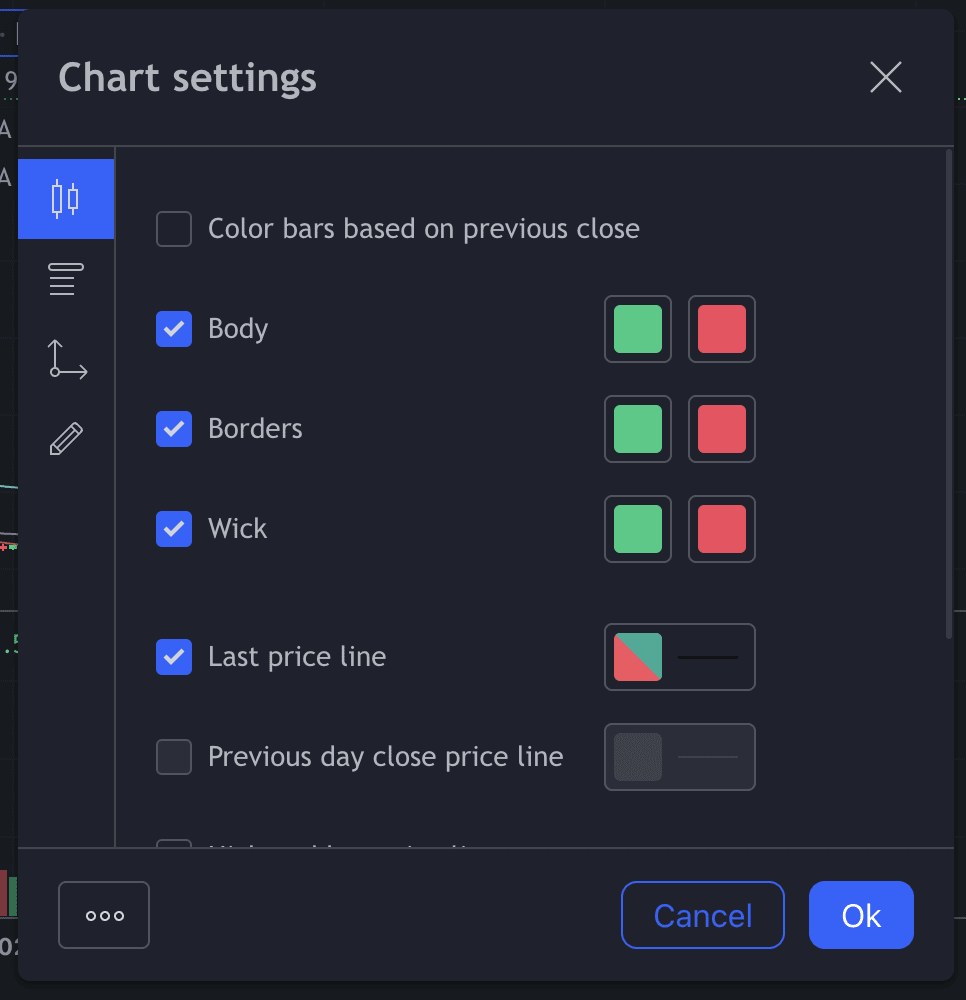
- [Symbol] allows you to change the color of your candlesticks. You can also customize the precision and timezone.
- [Status line] provides advanced options, such as OHLC values, bar change values, volume, and the background chart color intensity.
- [Scales] gives numerous options for integrating labels into your chart, such as symbol name labels, high and low price labels, indicator name labels, indicator value labels, and date format.
- [Appearance] allows you to edit the background and line segment color.
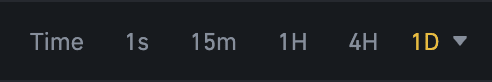
Candlestick intervals
The timeframe represented by each candlestick is alterable by selecting one of the default options above the graph. If you require more intervals, click the downward-facing arrow on the right-hand side.
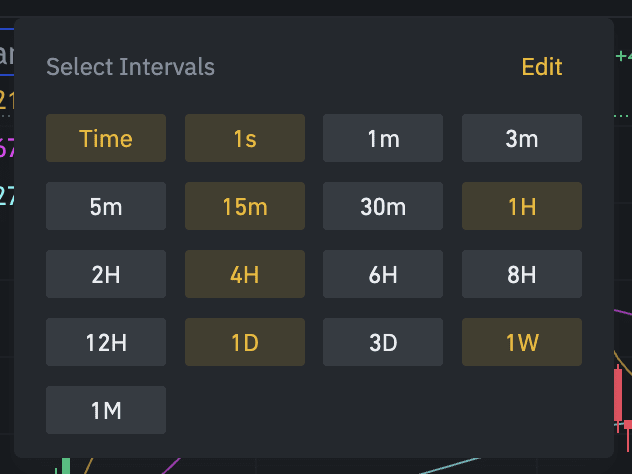
Here you can select a new interval or click the [Edit] button to add more intervals to your default options.
Drawing tools
The left-hand side of the chart provides several drawing tools and options to help with your charting analysis. You can also right-click each tool to find variations of the tool’s primary function.
The default selection contains the following tools:
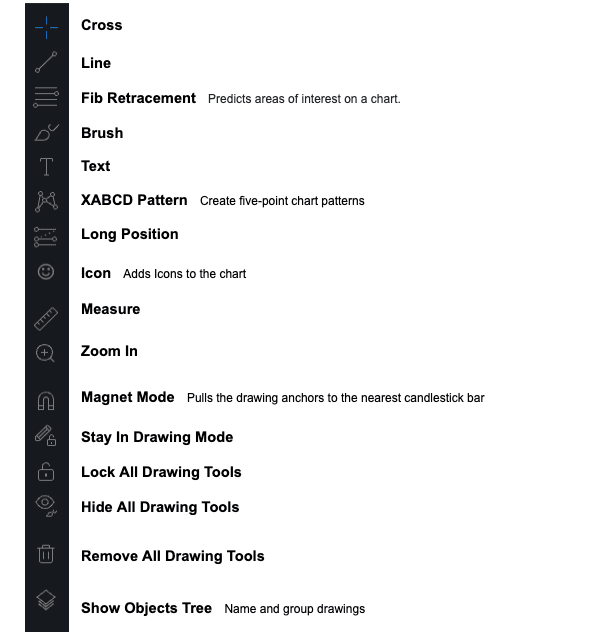
Popular basic tools
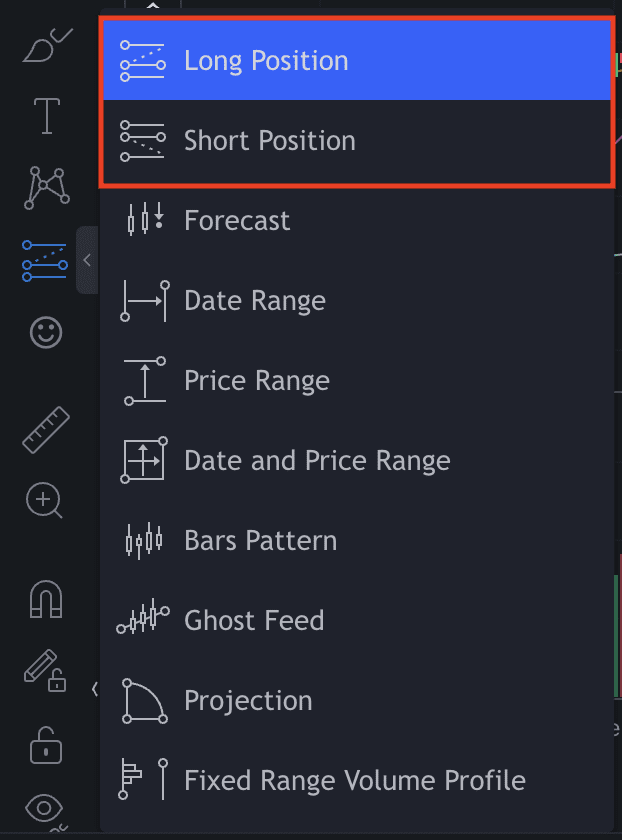
Long/short position
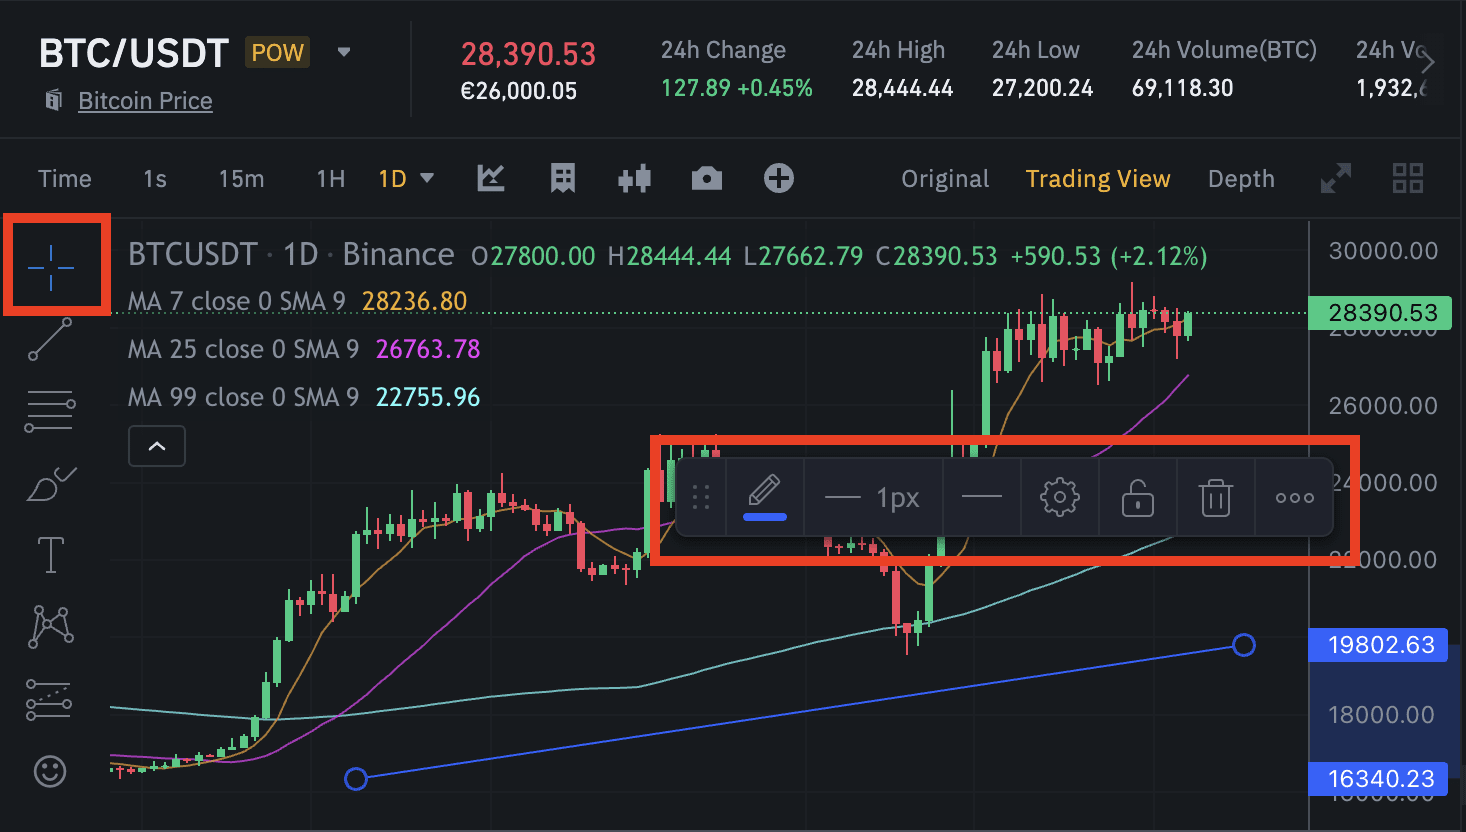
The long or short position tool allows you to track or simulate a trading position. You can manually adjust the Entry Price, Take Profit, and Stop-Loss levels. You will then see the corresponding risk/reward ratio.
1. Select either the [Long Position] or [Short Position] tool.
2. Click on the graph to create your long/short position. The green shaded area represents your target (potential profit), whereas the red shows your stop-loss area (potential loss). At the center, you can see the risk/reward ratio.
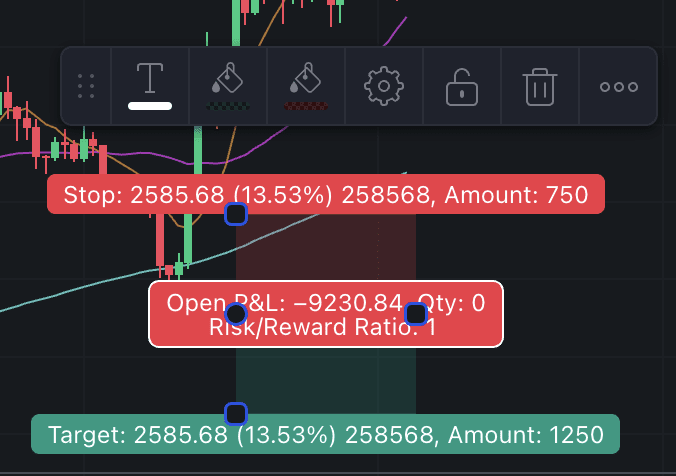
3. Drag the borders of the box to change your Risk/Reward Ratio. Target shows the difference in price between your Entry Price and the Take Profit level. Stop shows the price difference between your entry price and Stop-Loss level.
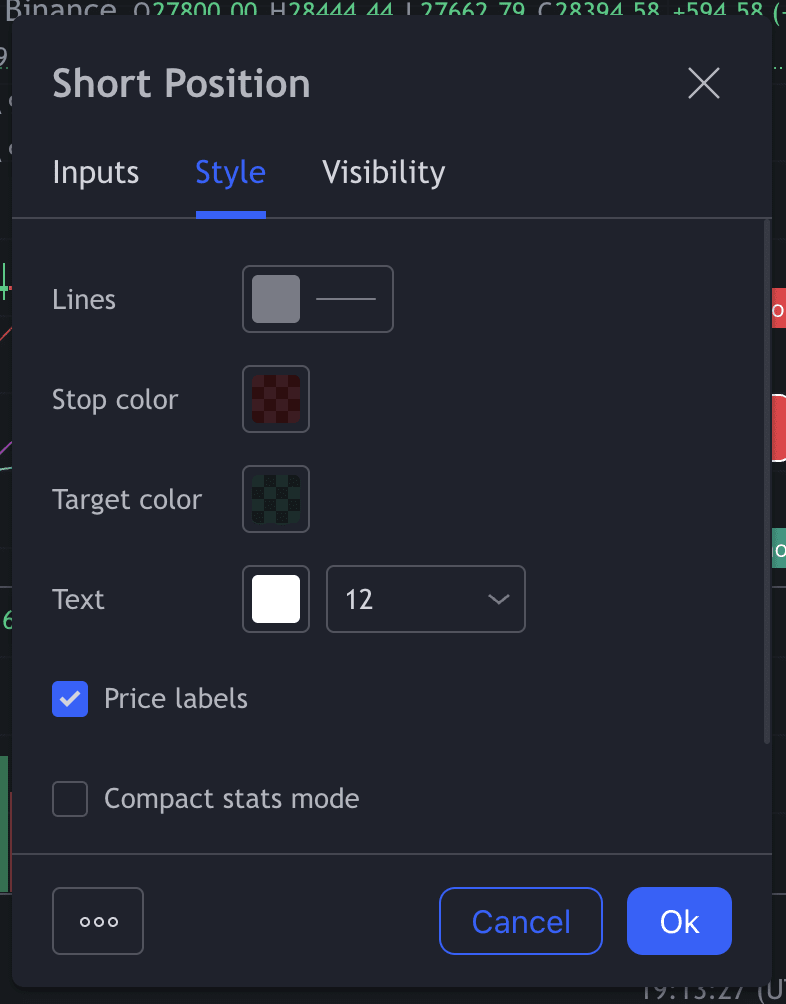
Double-click the Long Position/Short Position chart to adjust its settings. You can change the investment amount, risk percentage, Take Profit, Entry Price, and Stop Level under [Inputs].
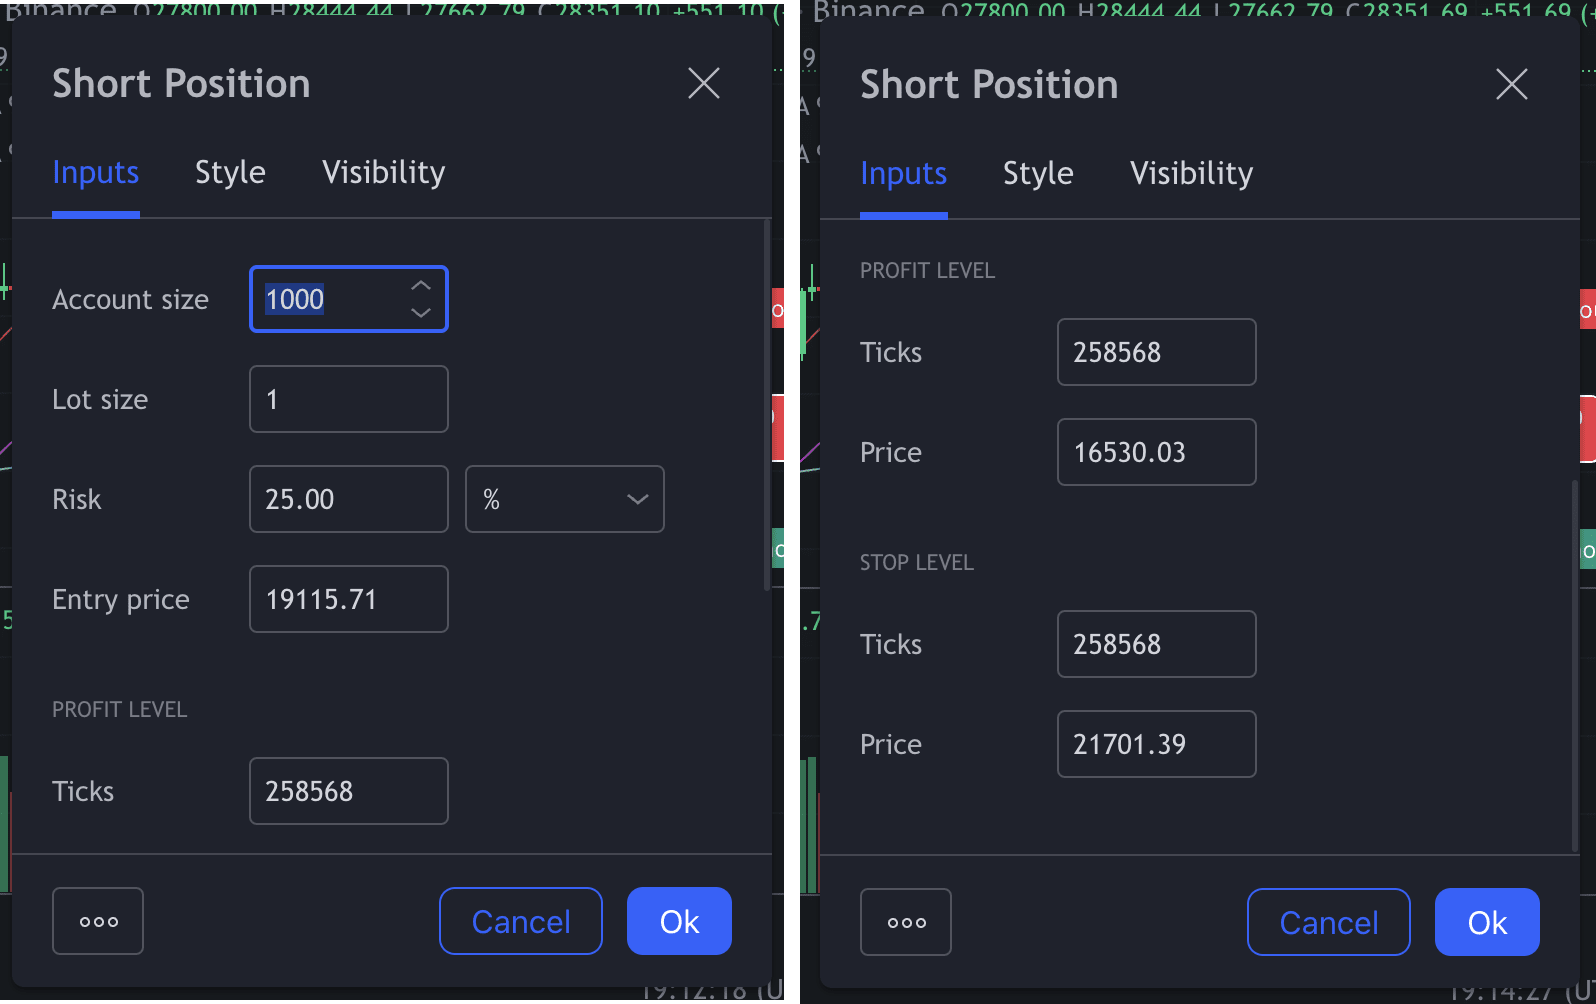
[Style] allows you to change the line colors and price labels.
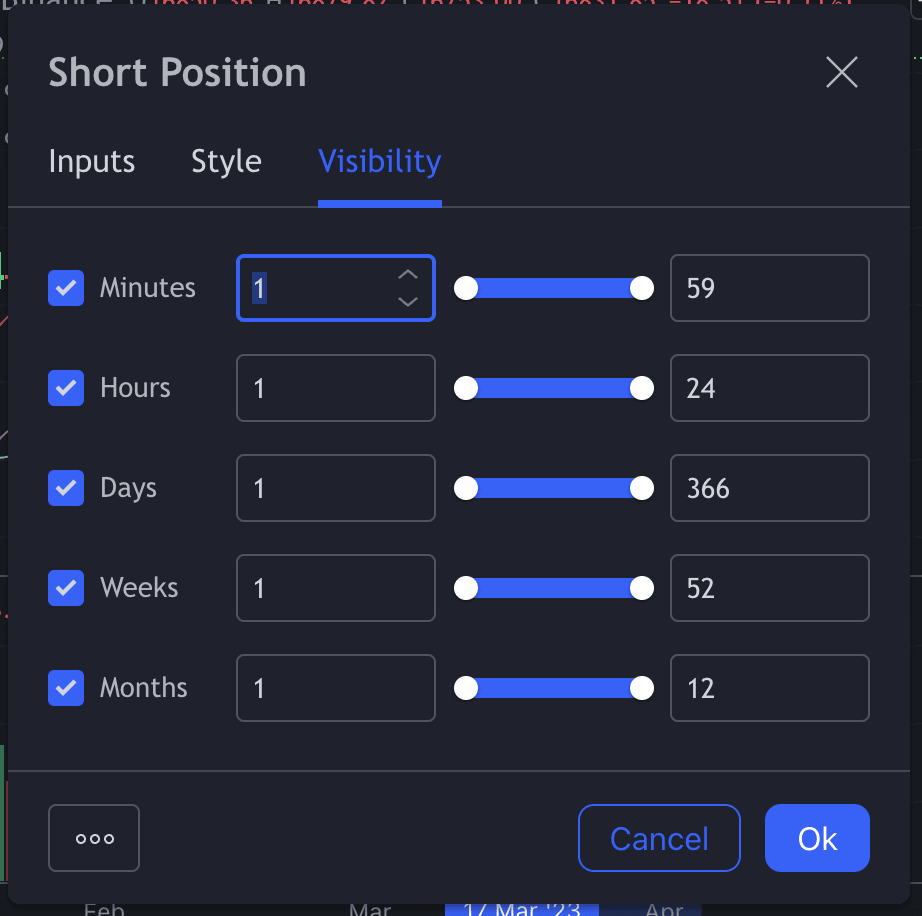
[Visibility] lets you customize the time.
Trend Line
You can easily add trend lines to your chart to fit your technical analysis methods. For more information on trend lines in general, visit our Binance Academy Trend Lines Explained guide.
To create trend lines, simply click the [Trend Line] tool and select the beginning and endpoints for your trend line.
Below is an example of a simple trendline demonstrating possible market entry points. Thickness, color, and other features are customizable using the floating toolbox.
Technical Indicators
Technical indicators, such as Moving Average or Bollinger Bands, are addable in the trading view.
Click the [Technical Indicator] icon for a list of all available options.
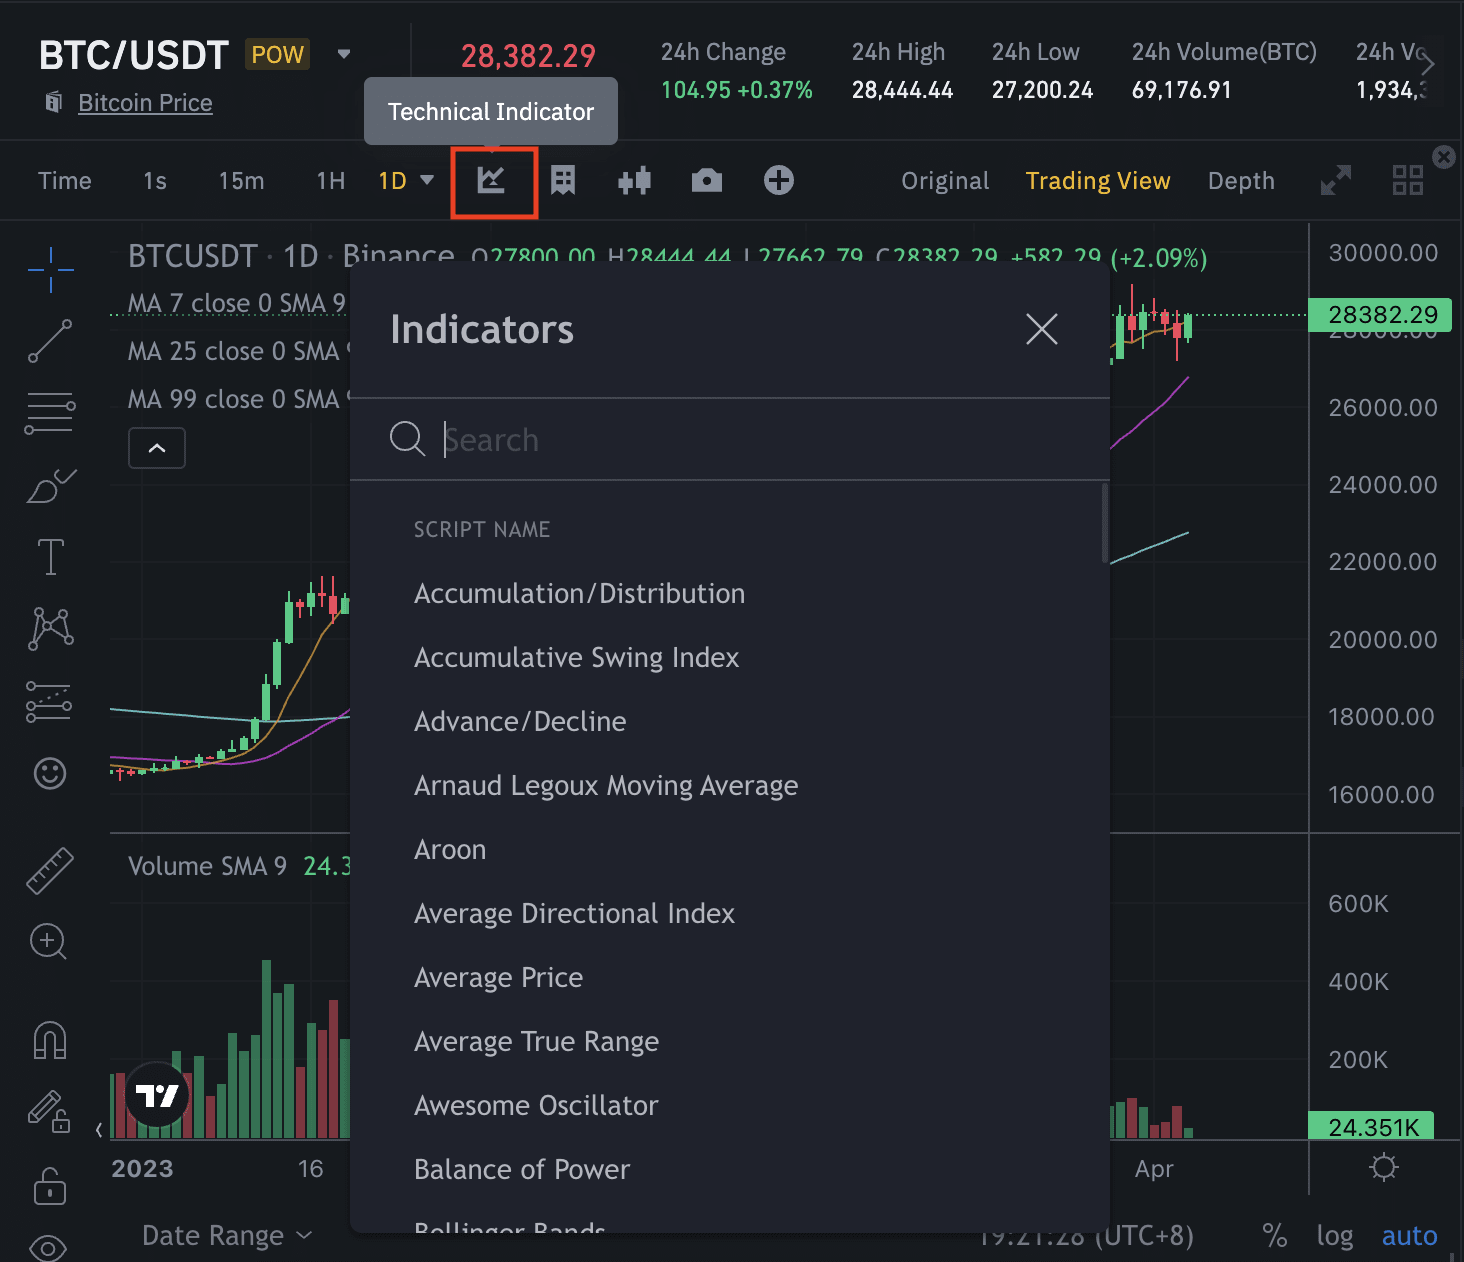
Once you have chosen a technical indicator, it becomes visible on the candlestick chart.
How to reset the chart?
To remove the technical indicators, simply click on it to bring up the floating toolbox, then click on the bin icon.
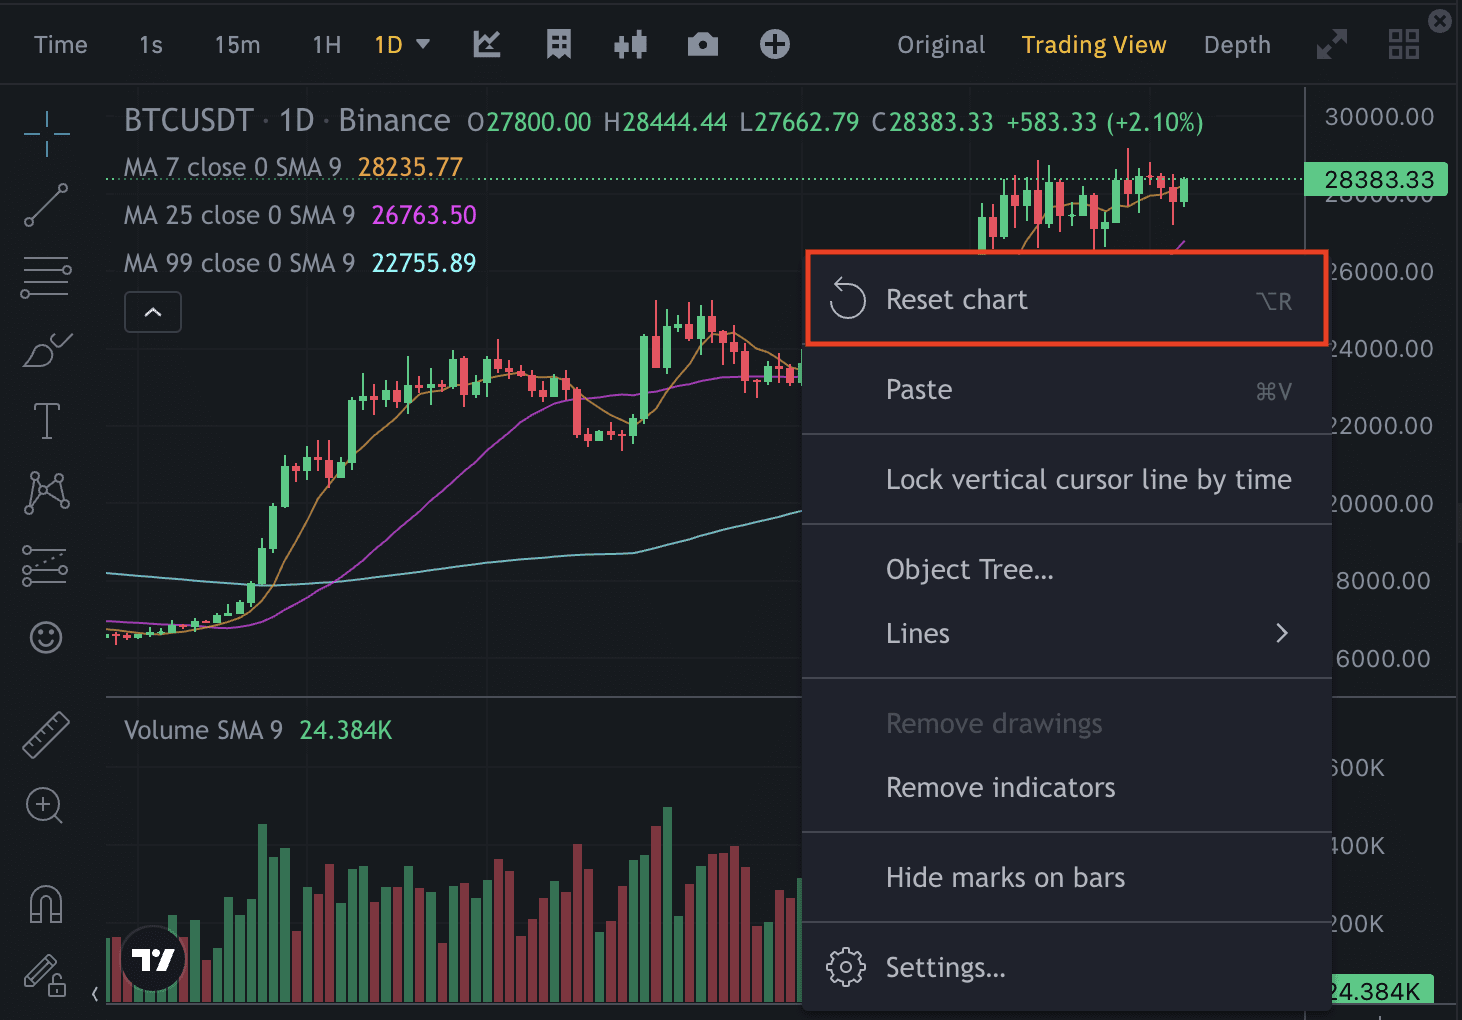
If you want to reset the whole chart, right-click anywhere on the chart and click [Reset Chart], or press [Alt + R] on your keyboard.
How to view charts in other timezones?
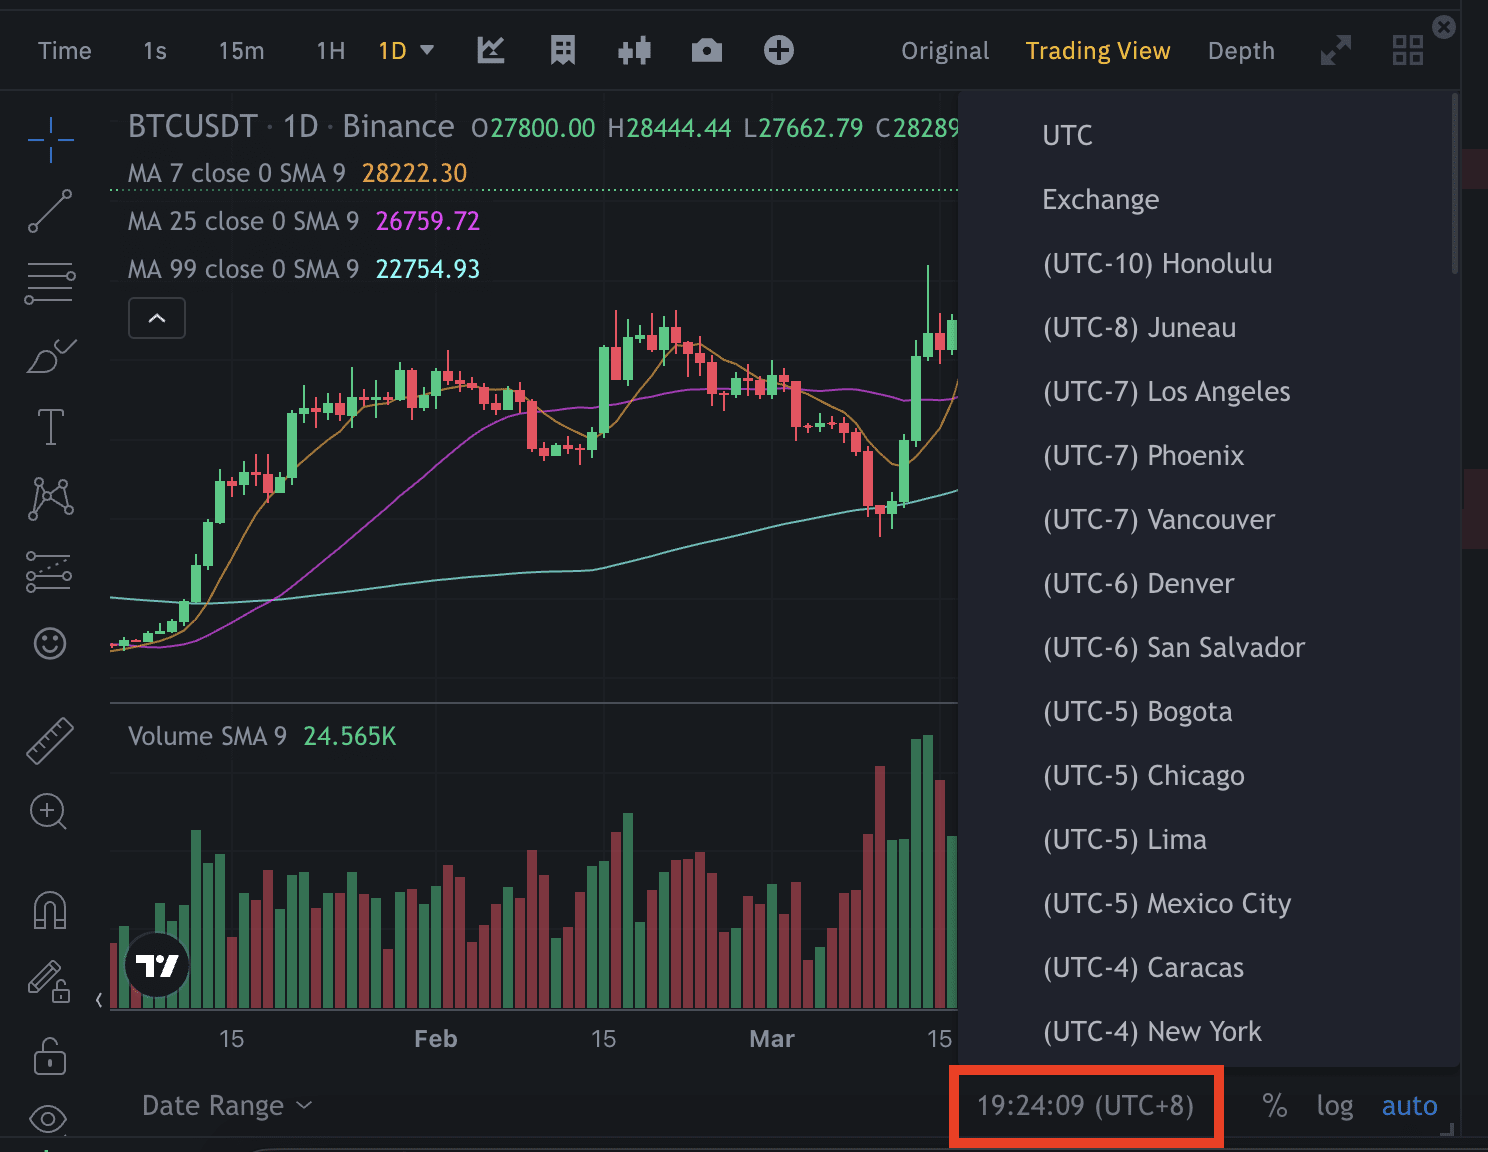
1. Click the clock at the bottom to change the timezone.
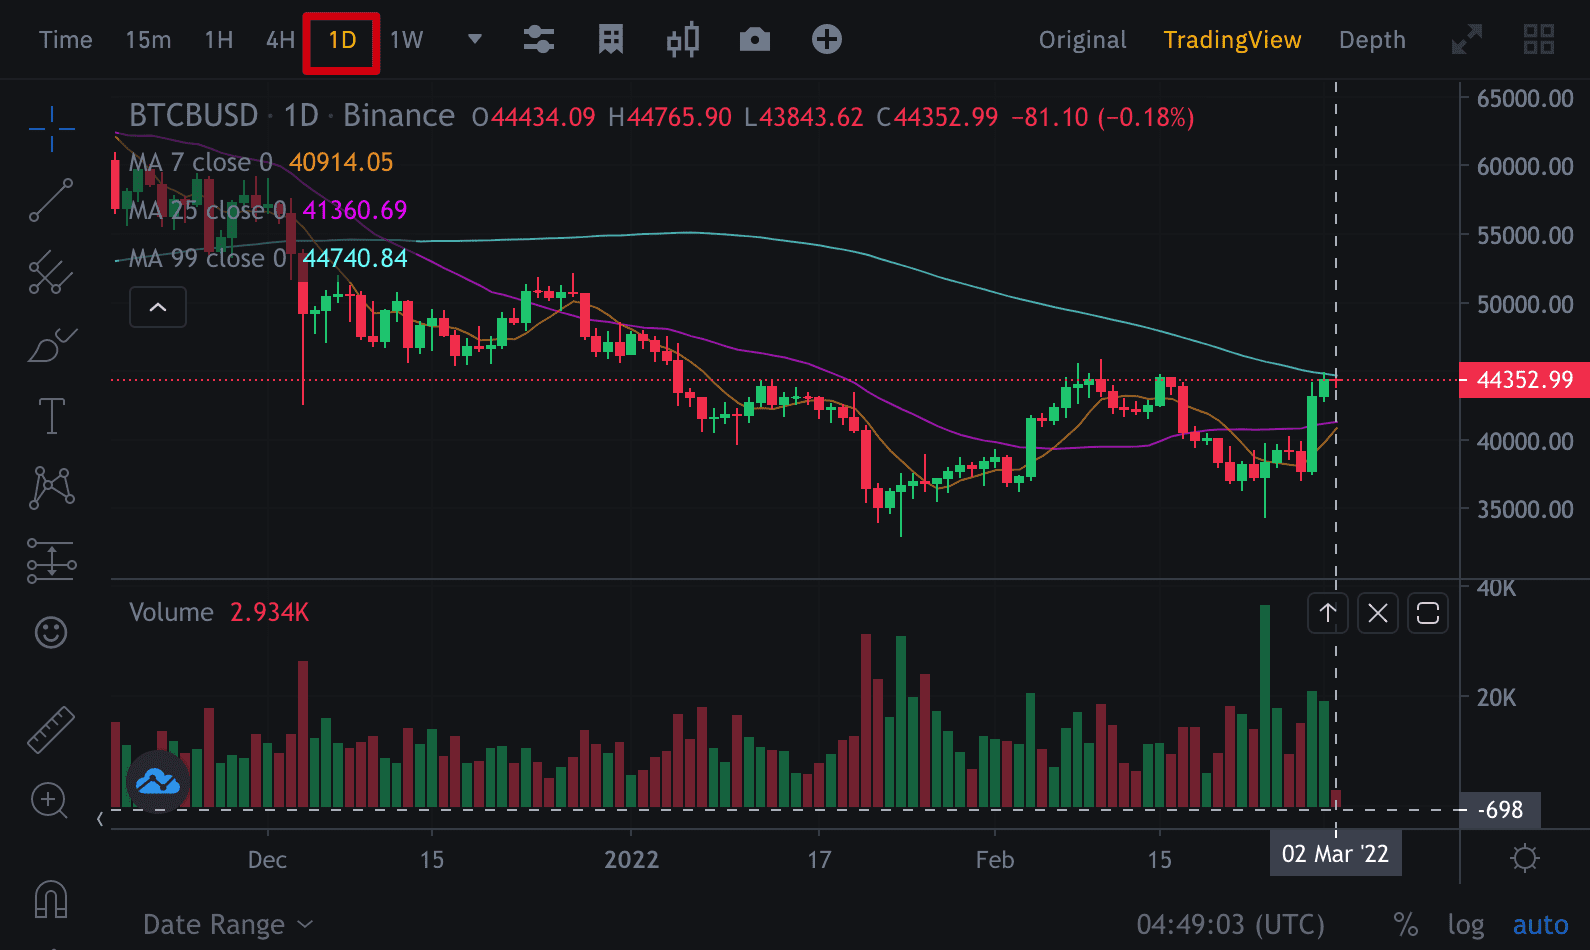
2. After changing your timezone, the chart will display the asset’s performance in [1D] (24 hours).
Please note that the stats would remain the same after changing the timezone. The only difference is the date and time. All calculations are based on UTC+0.
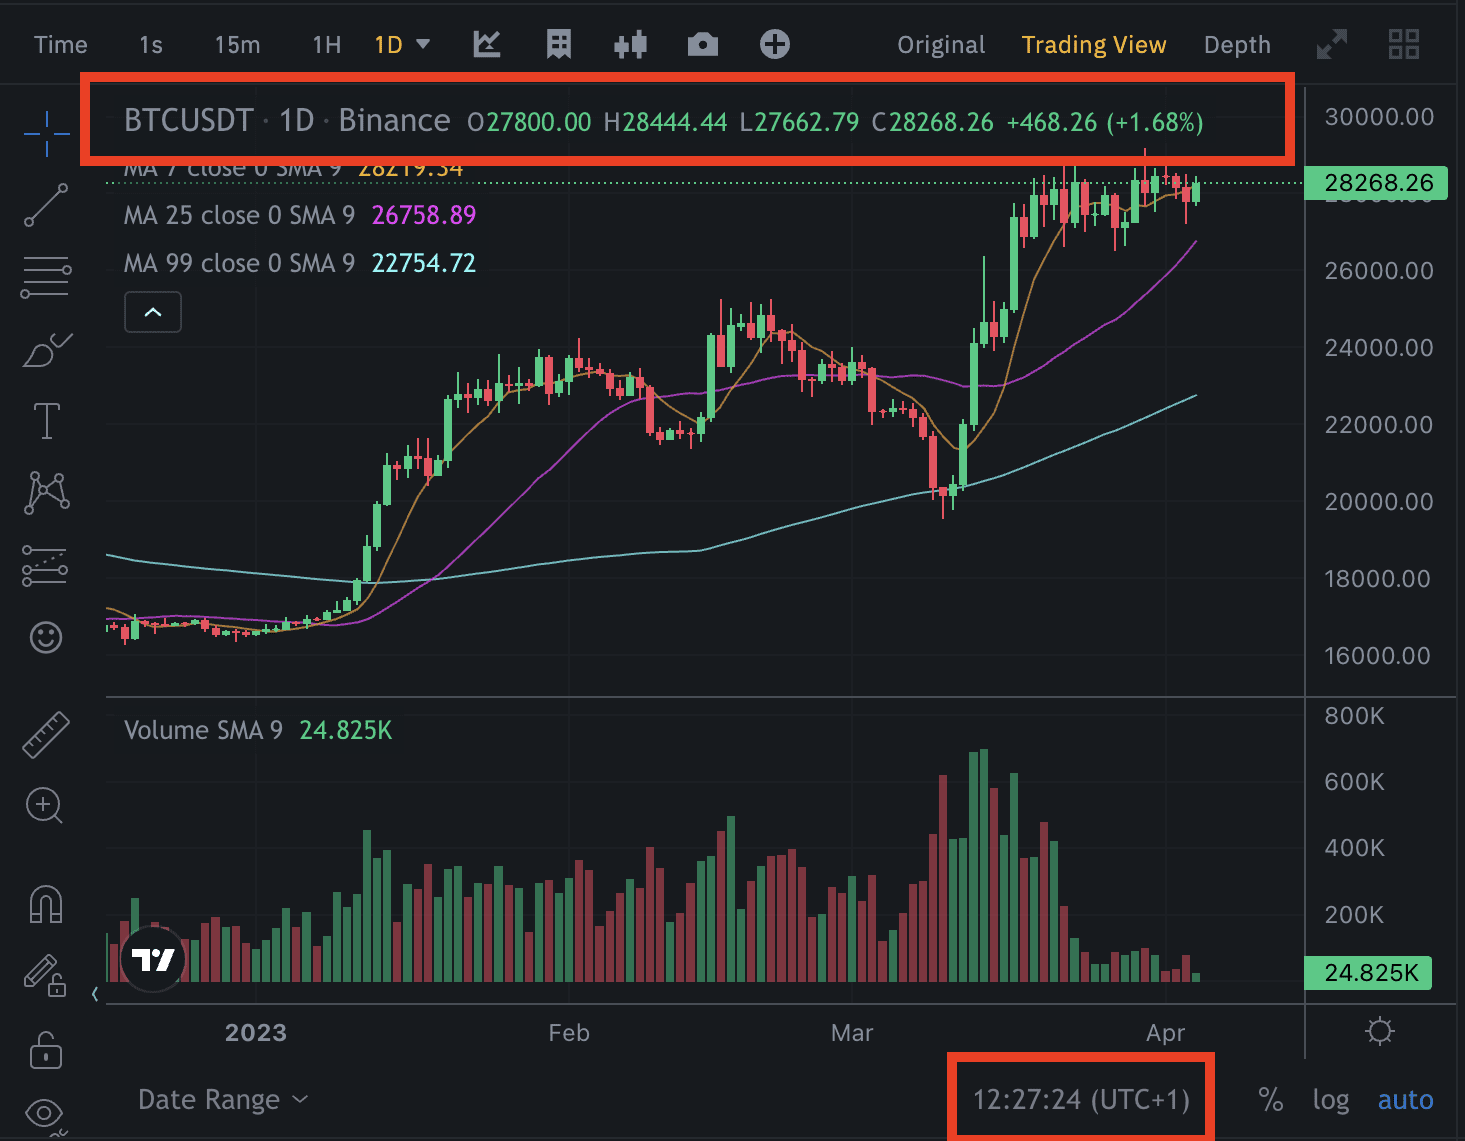
You can view the asset’s 24-hour performance on the chart. For example, the 24-hour performance for BTC/USDT on 2023-04-04 (UTC+1) was +468.26 (+1.68%).
*Please note that all chart settings will revert to their default state if the browser cache is cleared or if the app is reinstalled.