

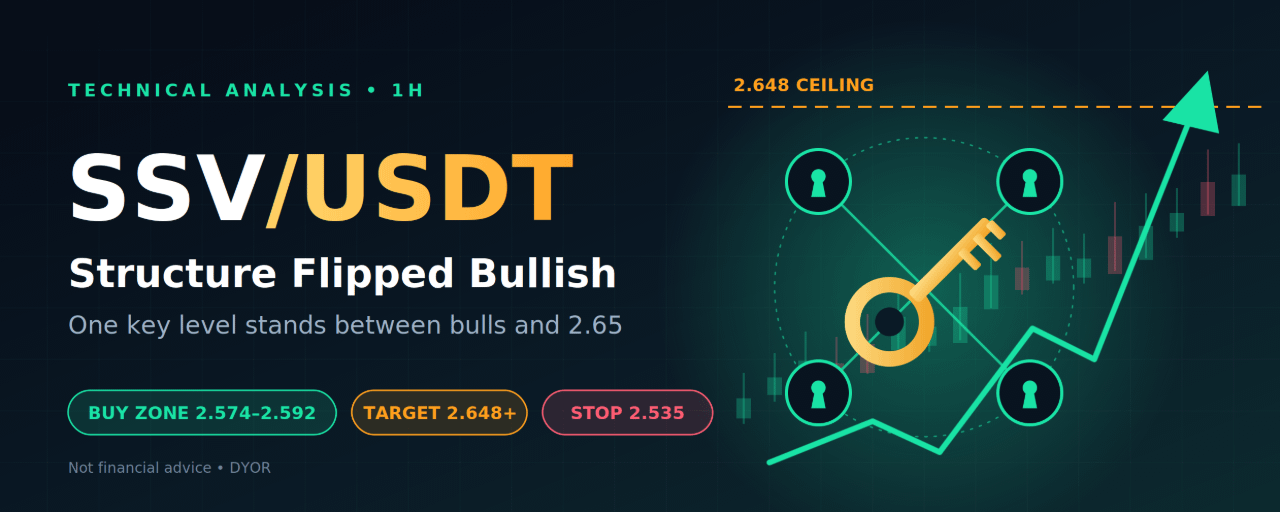


SSV/USDT | 1H | Binance | Chart timestamp: Oct 21, 2026, 17:26 UTC | Price: 2.612
SSV has done what bears didn’t want to see: it broke its downtrend structure. After a slide to a low near 2.43, the chart printed a clean sequence of higher lows, a break above the previous lower high near 2.62, and a fresh Higher High at roughly 2.648. Price is now cooling off (-0.38% on the candle) at 2.612. In a trend like this, the pullback is where the opportunity usually sits.
What the chart is saying
The structure shifted in stages. The earlier leg was a clear bearish staircase of lower highs and lower lows, ending in the sharp flush toward 2.43. From there, buyers stepped in, filled the imbalance and pushed price through the old lower high. The new HH confirms the break. A close back below the breakout zone would weaken this, but for now the trend favors the upside.
The marked range runs from about 2.503 (range low) to 2.648 (range high), and price is holding in the upper half of it. The key levels inside it:
2.648: the Higher High and the ceiling bulls must clear.
2.592: the 0.618 retracement of the range, currently acting as the first line of support.
2.574: the 0.5 level, which lines up with a fresh Fair Value Gap. This is the highest-quality demand pocket on the chart.
2.558: the 0.382 level, the last shallow support before the deeper imbalance below.
2.540–2.560: a larger Fair Value Gap from the earlier impulse. If price dips here, buyers have a second chance to defend.
2.503: the range low and the line in the sand for the whole move.
The trade plan (long bias)
Pullback entry (preferred): Scale in between 2.574 and 2.592. That is where the 0.618 retracement, the 0.5 level and the FVG all overlap. Waiting for price to come to you gives a tighter stop and a better reward-to-risk than chasing at 2.612.
Stop-loss: 2.535, below the larger FVG and the 0.382 zone. A 1H close under this level means the pullback has become a reversal, and the trade is wrong.
Targets:
TP1: 2.648. A retest of the Higher High. Consider taking partial profit and moving the stop to breakeven.
TP2: 2.690. The first measured extension if the HH breaks.
TP3: 2.740. The extended target if momentum builds after the breakout.
Breakout entry (for momentum traders): If you’d rather not wait for a dip, look for a 1H candle close above 2.655, ideally with a retest holding that level, with a stop under 2.620. This entry is cleaner but offers less reward, so size it smaller.
What invalidates the idea
If SSV closes a 1H candle below 2.558 and then loses 2.540, the bullish structure is in trouble. That would open a move back to 2.503, and a break of that low would put the old lows near 2.485 and 2.43 back in play. In that case, step aside and let the chart rebuild.
Price cross-check
I checked live sources against the chart. Results were inconsistent: some aggregator pages showed prices anywhere from about $2 to over $40, and one TradingView market list showed around 3.24, while others were clearly stale or tracking different tokens that share the SSV ticker. None of these could be matched to the chart’s timestamp. I used the chart’s own timestamped Binance price of 2.612 as the reference, and every level above is read from that chart. Before entering, check the live SSV/USDT price on Binance and adjust the levels if it has moved.
Final take
Structure has turned bullish, momentum is rising into the 2.648 high, and the cleanest risk-reward comes from a pullback into the 2.574–2.592 pocket rather than a chase. Patience and a defined stop are what make this setup work.
⚠️ Disclaimer: This is not financial advice. This analysis is for educational purposes only. Crypto trading carries a high risk of loss, and levels here are approximate readings from a chart. Always do your own research and manage your risk.
@Binance Square Official #EarningsSeason #ZcashDevelopersConfirmNovemberDateForNU7Upgrade #OCCIssuesFirstFinalRuleUnderGENIUSAct #Binance #ChartSniper