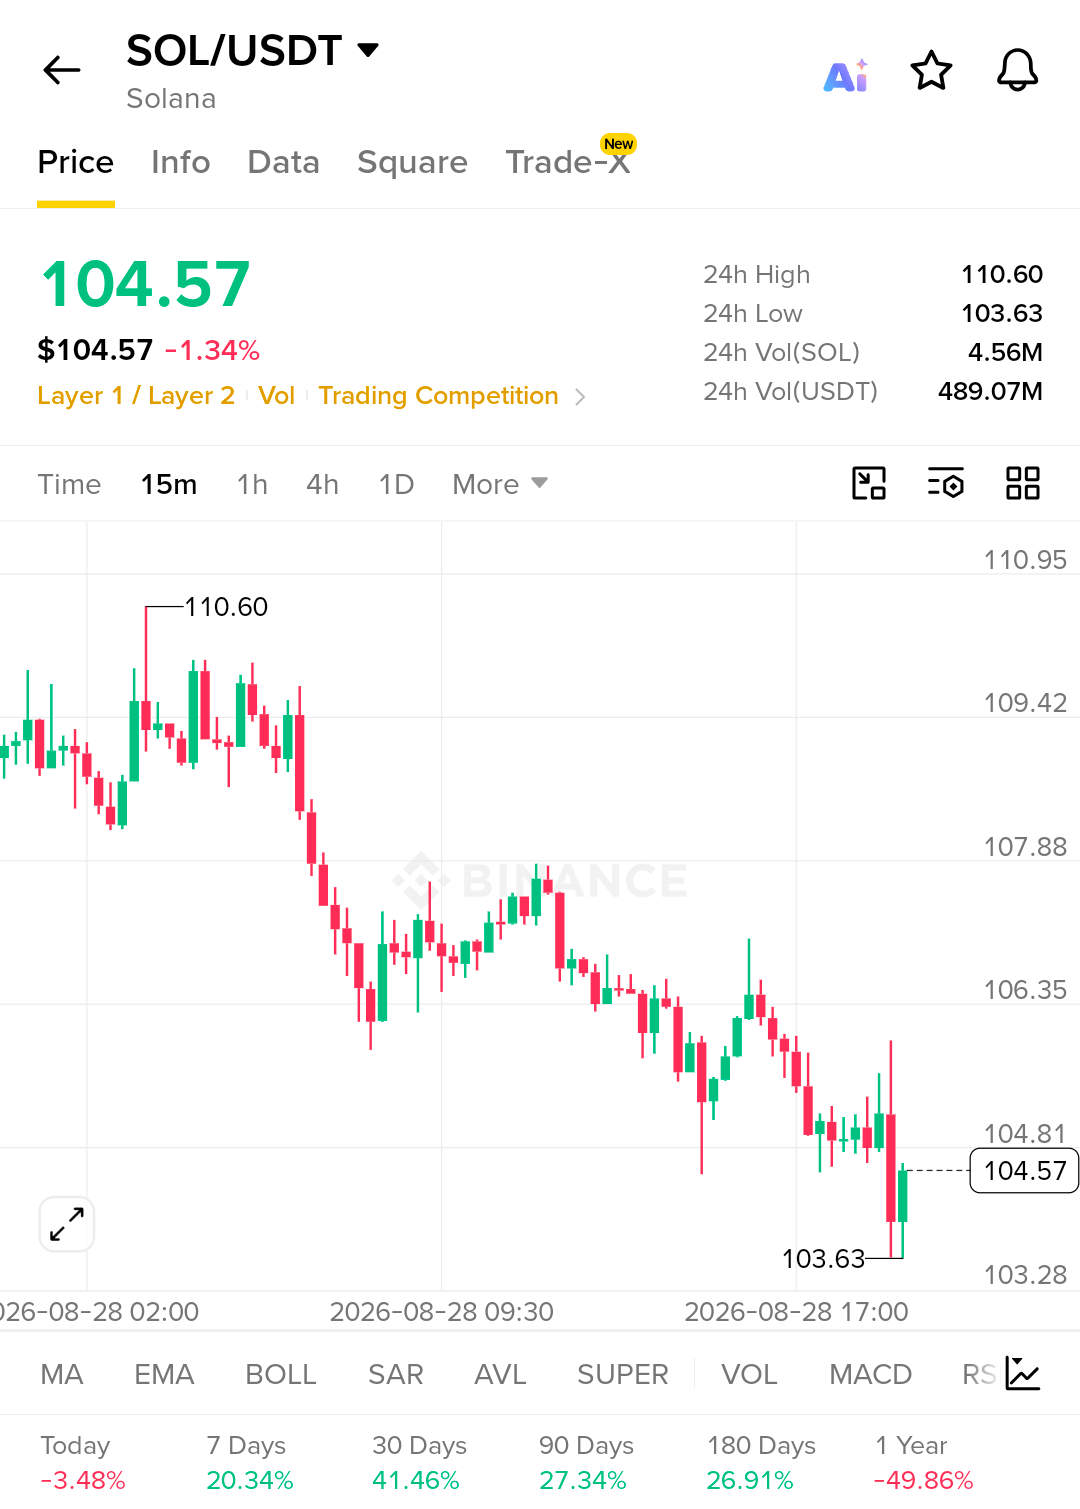

$SOL/USDT — 15M Market Structure Under Pressure
The interesting part of this chart isn’t the latest green candle — it’s what happened before it. $SOL has been printing a clear sequence of lower highs and lower lows, sliding from the $110.60 area toward the $103.63 low. Now price is trying to bounce, but the bigger short-term structure still favors sellers.
Current Price: $104.57
24H Change: -1.34%
24H High: $110.60
24H Low: $103.63
Market Bias: Bearish
Trade Idea
Potential Short Entry: $104.80–$105.20
TP1: $104.00
TP2: $103.63
TP3: $103.28
Stop Loss: $106.35
Key Confirmation: Rejection around $104.81–$105.20 followed by renewed selling
Invalidation: Strong reclaim and hold above $106.35
The $103.63 area is the immediate level I’m watching closely because it is the latest visible low. If sellers push price back toward that zone and break it with momentum, the move could open the door toward the $103.28 area shown on the chart.
On the other hand, I would not chase a short directly into $103.63. Price has already reacted from that low, so a relief bounce is possible. The cleaner scenario would be a move back into the $104.80–$105.20 region followed by rejection. That would give sellers a chance to prove that the bounce is only a temporary recovery rather than a real trend change.
Above that, $106.35 becomes the important warning level. A sustained move through it would weaken the bearish idea and suggest that buyers are gaining control of the short-term structure.
For me, the key is simple: let the bounce show its strength before taking the next decision. If resistance rejects price again, sellers remain in the driver’s seat; if $106.35 is reclaimed decisively, the short thesis needs to be reconsidered.
Wait for the reaction, respect the invalidation, and let the chart confirm the next move — $SOL
#SOLJumps20%OnTheWeek #CaliforniaBillWouldBarOfficialMemeCoins #TRONMainnetActivatesTVMPragueOsaka #QatarExtendsLNGForceMajeureByOneMonth #TaiwanTAIEXRetakes46500OnChipRally
The interesting part of this chart isn’t the latest green candle — it’s what happened before it. $SOL has been printing a clear sequence of lower highs and lower lows, sliding from the $110.60 area toward the $103.63 low. Now price is trying to bounce, but the bigger short-term structure still favors sellers.
Current Price: $104.57
24H Change: -1.34%
24H High: $110.60
24H Low: $103.63
Market Bias: Bearish
Trade Idea
Potential Short Entry: $104.80–$105.20
TP1: $104.00
TP2: $103.63
TP3: $103.28
Stop Loss: $106.35
Key Confirmation: Rejection around $104.81–$105.20 followed by renewed selling
Invalidation: Strong reclaim and hold above $106.35
The $103.63 area is the immediate level I’m watching closely because it is the latest visible low. If sellers push price back toward that zone and break it with momentum, the move could open the door toward the $103.28 area shown on the chart.
On the other hand, I would not chase a short directly into $103.63. Price has already reacted from that low, so a relief bounce is possible. The cleaner scenario would be a move back into the $104.80–$105.20 region followed by rejection. That would give sellers a chance to prove that the bounce is only a temporary recovery rather than a real trend change.
Above that, $106.35 becomes the important warning level. A sustained move through it would weaken the bearish idea and suggest that buyers are gaining control of the short-term structure.
For me, the key is simple: let the bounce show its strength before taking the next decision. If resistance rejects price again, sellers remain in the driver’s seat; if $106.35 is reclaimed decisively, the short thesis needs to be reconsidered.
Wait for the reaction, respect the invalidation, and let the chart confirm the next move — $SOL
#SOLJumps20%OnTheWeek #CaliforniaBillWouldBarOfficialMemeCoins #TRONMainnetActivatesTVMPragueOsaka #QatarExtendsLNGForceMajeureByOneMonth #TaiwanTAIEXRetakes46500OnChipRally