


SOL posts a sharp daily advance, while derivatives data shows intense short liquidation activity across major futures markets recently.
A three-month descending trendline has broken, putting the upper-$80s and $98.40 near-term resistance levels into focus for traders.
Futures activity remains elevated, while traders monitor whether reclaimed resistance can hold during continued price strength near term.
Solana breakout momentum is strengthening as buyers push through a three-month descending trendline, while heavy derivatives activity adds another layer to the latest market recovery phase now underway.
Trendline Break Changes SOL’s Technical Structure
The market data as of writing places SOL at $87.41 after a 13.23% daily gain. Its seven-day advance has reached 14.60%, showing renewed short-term strength. Trading volume has reached $5.6 billion over 24 hours.
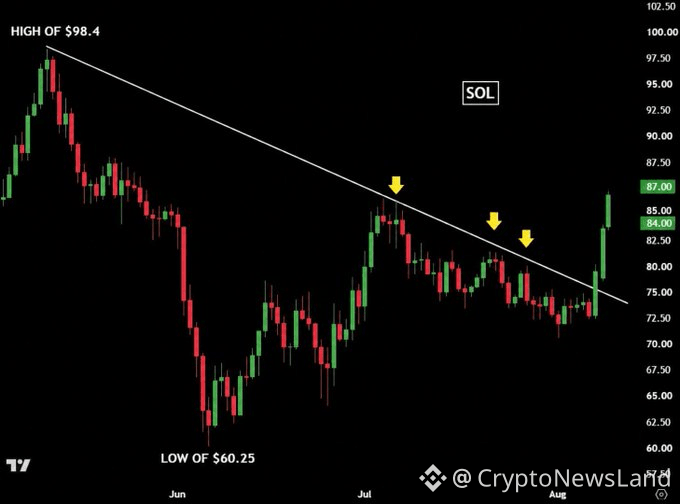
The move follows a decline from a previous peak near $98.40. That decline produced repeated lower highs beneath descending resistance. Each recovery attempt struggled near that trendline, keeping sellers active.
The structure changed after SOL reached a major low around $60.25. Price stabilized and formed a broader consolidation range. That base allowed buyers to challenge declining resistance.
Shahnawaz recently said SOL broke its three-month downtrend. His post described the move as bullish for SOL holders. He also said momentum could strengthen as the breakout develops.
 Source: X Liquidations Add Force to the Latest Move
The Solana breakout marks a clear change from the bearish structure. SOL moved above resistance after several tests from below. The move also carried price beyond the $80 region.
This resistance contained rallies throughout the previous three months. Its break removes one barrier from the recovery path. However, the market still needs sustained trading above that zone.
The broken trendline now becomes an important reference for traders. A successful retest could confirm resistance has turned into support. A return below it could weaken the breakout structure.
The next visible hurdle sits around the upper-$80s to $90. Beyond that zone, the previous $98.40 peak becomes important. A move toward that level would extend June's recovery.
Futures Activity Keeps Momentum Under Watch
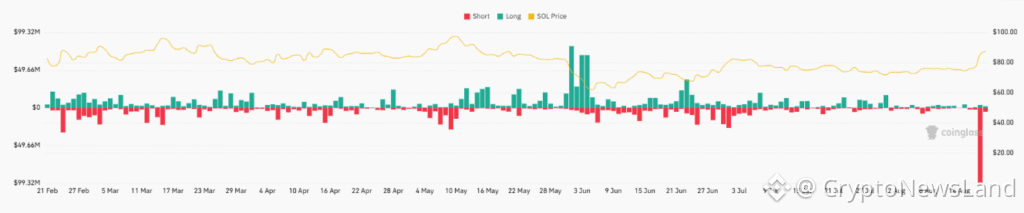
SOL perpetual futures show heavy liquidation activity around major moves. The largest recent bar appears near the chart’s right edge. That red bar approaches the $99.32 million liquidation scale.
 Source: Coinglass
The latest spike occurred as SOL advanced toward the mid-$80s. That timing points toward forced closures among short positions. Such liquidations can increase buying pressure during rapid advances.
Earlier activity showed substantial long liquidations during the May decline. SOL fell sharply toward the $60 region during that period. Green liquidation bars appeared as leveraged positions were closed.
Since June, liquidation bars have generally become smaller and balanced. That pattern accompanied SOL’s recovery through July and August. The latest spike marks renewed derivatives pressure.
For the Solana breakout to hold, price must defend reclaimed resistance. Continued higher highs would keep the recovery structure intact. A break above $98.40 would establish a new technical milestone.