
BlackCat Analysis
5.2k Publicaciones

BlackCat Analysis
 Verificado Plus de Binance Square
Denunciar
Bloquear usuario
Trader || X (Twitter): @BlackCatTrader7 |I Binance KOL II Trad e Setups are my Personal Opinions I| DYOR
Trader frecuente
1.9 año(s)
98 Siguiendo
36.9K+ Seguidores
67.6K+ Me gusta
Publicaciones
Todo
Videos
Artículo
$BTC May Be Entering Wave 3 — The Most Violent Move Usually Comes Next.$BTC is beginning to show a structure that suggests the market may be transitioning into a more sensitive phase.
From a wave perspective, the recent movement resembles the completion of a wave 2 correction, which unfolded in a relatively clear zigzag pattern. If this interpretation continues to hold, the market could be approaching the start of wave 3, a phase that historically tends to produce the strongest and fastest movements in the direction of the main trend.
Structurally, wave 3 phases often coincide with expanding volatility and increasing pressure on market sentiment. Once momentum accelerates, the market can move quickly toward the next major liquidity zones.
In the current context, the 58,000–55,000 USD region becomes a key area to monitor. This zone stands out not only as a technical support region but also as a potential liquidity pocket where the market could test the strength of buyers. If selling momentum begins to accelerate, price could move toward this region relatively quickly as the market searches for deeper demand.
Liquidity dynamics also play an important role here. If Bitcoin were to approach this area with strong downside momentum, many positions that entered during the recent rebound could be forced to close. That kind of forced unwinding often amplifies volatility and can push the market into a short-term panic phase.
Psychologically, this is where the market often becomes most unstable. Traders expecting a continuation of the recovery may suddenly find themselves on the wrong side of the move, which can further accelerate selling pressure.
However, the scenario has a clear invalidation level. If price manages to reclaim and hold above 74,000 USD, the current wave structure would lose its reliability. A move above that level would suggest that the market is regaining strength rather than entering a deeper corrective phase.
For now, the key factor remains whether selling pressure continues to build. Markets at this stage can move very quickly, and shifts in structure can change the short-term outlook almost immediately.
$BTC #Bitcoin #Crypto
{future}(BTCUSDT)
$BTC May Be Entering Wave 3 — The Most Violent Move Usually Comes Next.
$BTC is beginning to show a structure that suggests the market may be transitioning into a more sensitive phase.
From a wave perspective, the recent movement resembles the completion of a wave 2 correction, which unfolded in a relatively clear zigzag pattern. If this interpretation continues to hold, the market could be approaching the start of wave 3, a phase that historically tends to produce the strongest and fastest movements in the direction of the main trend.
Structurally, wave 3 phases often coincide with expanding volatility and increasing pressure on market sentiment. Once momentum accelerates, the market can move quickly toward the next major liquidity zones.
In the current context, the 58,000–55,000 USD region becomes a key area to monitor. This zone stands out not only as a technical support region but also as a potential liquidity pocket where the market could test the strength of buyers. If selling momentum begins to accelerate, price could move toward this region relatively quickly as the market searches for deeper demand.
Liquidity dynamics also play an important role here. If Bitcoin were to approach this area with strong downside momentum, many positions that entered during the recent rebound could be forced to close. That kind of forced unwinding often amplifies volatility and can push the market into a short-term panic phase.
Psychologically, this is where the market often becomes most unstable. Traders expecting a continuation of the recovery may suddenly find themselves on the wrong side of the move, which can further accelerate selling pressure.
However, the scenario has a clear invalidation level. If price manages to reclaim and hold above 74,000 USD, the current wave structure would lose its reliability. A move above that level would suggest that the market is regaining strength rather than entering a deeper corrective phase.
For now, the key factor remains whether selling pressure continues to build. Markets at this stage can move very quickly, and shifts in structure can change the short-term outlook almost immediately.
$BTC #Bitcoin #Crypto
From a wave perspective, the recent movement resembles the completion of a wave 2 correction, which unfolded in a relatively clear zigzag pattern. If this interpretation continues to hold, the market could be approaching the start of wave 3, a phase that historically tends to produce the strongest and fastest movements in the direction of the main trend.
Structurally, wave 3 phases often coincide with expanding volatility and increasing pressure on market sentiment. Once momentum accelerates, the market can move quickly toward the next major liquidity zones.
In the current context, the 58,000–55,000 USD region becomes a key area to monitor. This zone stands out not only as a technical support region but also as a potential liquidity pocket where the market could test the strength of buyers. If selling momentum begins to accelerate, price could move toward this region relatively quickly as the market searches for deeper demand.
Liquidity dynamics also play an important role here. If Bitcoin were to approach this area with strong downside momentum, many positions that entered during the recent rebound could be forced to close. That kind of forced unwinding often amplifies volatility and can push the market into a short-term panic phase.
Psychologically, this is where the market often becomes most unstable. Traders expecting a continuation of the recovery may suddenly find themselves on the wrong side of the move, which can further accelerate selling pressure.
However, the scenario has a clear invalidation level. If price manages to reclaim and hold above 74,000 USD, the current wave structure would lose its reliability. A move above that level would suggest that the market is regaining strength rather than entering a deeper corrective phase.
For now, the key factor remains whether selling pressure continues to build. Markets at this stage can move very quickly, and shifts in structure can change the short-term outlook almost immediately.
$BTC #Bitcoin #Crypto
14
1
138
83.5k
Artículo
Bitcoin vs Altcoins: Early Rotation or Beginning of Expansion?While $BTC continues navigating macro pressure and uneven liquidity conditions, parts of the altcoin market are beginning to show a different behavior.
After nearly four years of prolonged correction and consolidation, several altcoins are quietly transitioning away from pure downtrend structure. The shift isn’t obvious through headlines or narratives — it’s showing up directly in price action.
What stands out is structural change.
Higher lows are beginning to form.
Trading ranges are expanding instead of compressing.
Former resistance zones are gradually being absorbed rather than rejected.
These are often early characteristics seen when markets move from accumulation into the first stages of expansion.
Interestingly, this rotation is happening while broader attention remains fixed on Bitcoin’s uncertainty. When the majority of participants are still focused on whether $BTC might weaken further, speculative capital sometimes begins exploring higher-beta assets earlier in the cycle.
That doesn’t automatically confirm a full altseason.
Early rotations can fail if liquidity doesn’t follow through. Sustainable growth usually requires improving participation, expanding volume, and consistent capital inflow — not just isolated price strength.
For now, the environment appears selective rather than euphoric.
This phase tends to reward patience and asset selection more than aggressive chasing. Markets often build new foundations quietly before wider recognition arrives.
If liquidity continues strengthening alongside improving structure, the current transition could evolve into a broader growth phase — one that typically becomes obvious only after much of the initial move has already unfolded.
$BTC #Bitcoin #Crypto
{future}(BTCUSDT)
Bitcoin vs Altcoins: Early Rotation or Beginning of Expansion?
While $BTC continues navigating macro pressure and uneven liquidity conditions, parts of the altcoin market are beginning to show a different behavior.
After nearly four years of prolonged correction and consolidation, several altcoins are quietly transitioning away from pure downtrend structure. The shift isn’t obvious through headlines or narratives — it’s showing up directly in price action.
What stands out is structural change.
Higher lows are beginning to form.
Trading ranges are expanding instead of compressing.
Former resistance zones are gradually being absorbed rather than rejected.
These are often early characteristics seen when markets move from accumulation into the first stages of expansion.
Interestingly, this rotation is happening while broader attention remains fixed on Bitcoin’s uncertainty. When the majority of participants are still focused on whether $BTC might weaken further, speculative capital sometimes begins exploring higher-beta assets earlier in the cycle.
That doesn’t automatically confirm a full altseason.
Early rotations can fail if liquidity doesn’t follow through. Sustainable growth usually requires improving participation, expanding volume, and consistent capital inflow — not just isolated price strength.
For now, the environment appears selective rather than euphoric.
This phase tends to reward patience and asset selection more than aggressive chasing. Markets often build new foundations quietly before wider recognition arrives.
If liquidity continues strengthening alongside improving structure, the current transition could evolve into a broader growth phase — one that typically becomes obvious only after much of the initial move has already unfolded.
$BTC #Bitcoin #Crypto
After nearly four years of prolonged correction and consolidation, several altcoins are quietly transitioning away from pure downtrend structure. The shift isn’t obvious through headlines or narratives — it’s showing up directly in price action.
What stands out is structural change.
Higher lows are beginning to form.
Trading ranges are expanding instead of compressing.
Former resistance zones are gradually being absorbed rather than rejected.
These are often early characteristics seen when markets move from accumulation into the first stages of expansion.
Interestingly, this rotation is happening while broader attention remains fixed on Bitcoin’s uncertainty. When the majority of participants are still focused on whether $BTC might weaken further, speculative capital sometimes begins exploring higher-beta assets earlier in the cycle.
That doesn’t automatically confirm a full altseason.
Early rotations can fail if liquidity doesn’t follow through. Sustainable growth usually requires improving participation, expanding volume, and consistent capital inflow — not just isolated price strength.
For now, the environment appears selective rather than euphoric.
This phase tends to reward patience and asset selection more than aggressive chasing. Markets often build new foundations quietly before wider recognition arrives.
If liquidity continues strengthening alongside improving structure, the current transition could evolve into a broader growth phase — one that typically becomes obvious only after much of the initial move has already unfolded.
$BTC #Bitcoin #Crypto
9
7
88
85.6k
Artículo
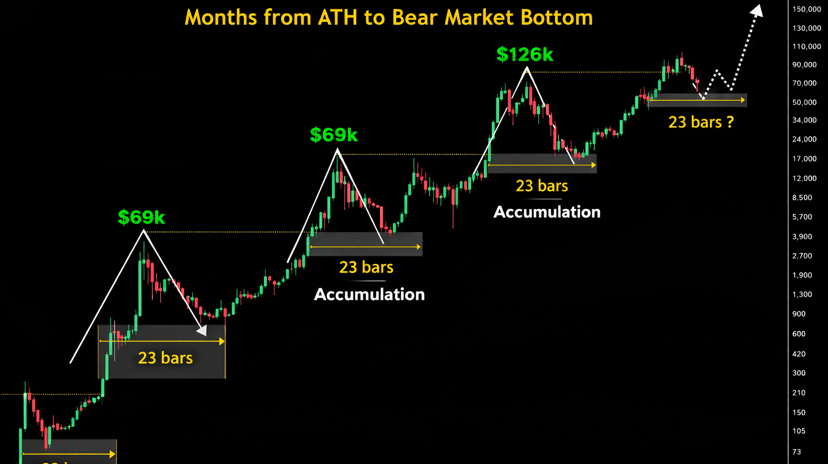
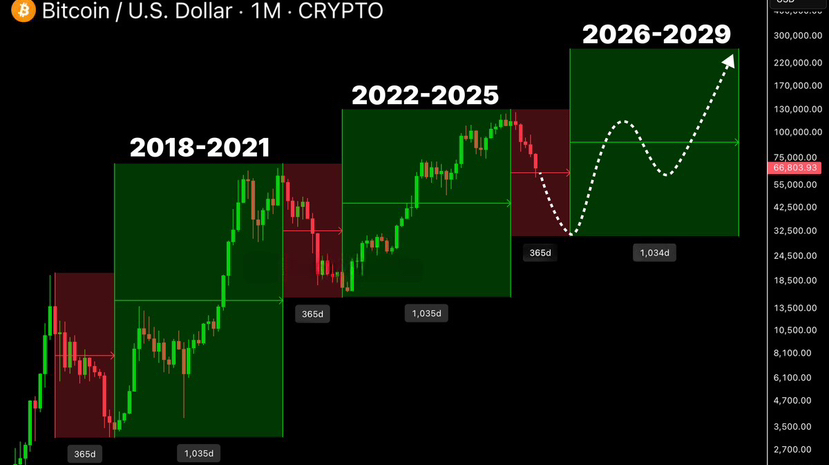
Bitcoin Cycle Mechanics: Compression Before Expansion?There’s a recurring rhythm in $BTC that many overlook:
Roughly 1 year of contraction → followed by ~3 years of expansion.
Not perfectly timed.
Not mechanically identical.
But structurally consistent.
How the cycle typically unfolds:
Phase 1 – Cleanup
Price declines. Excess leverage clears. Weak positioning exits.
Volatility compresses near the bottom as liquidity stabilizes.
Phase 2 – Base Formation
Sideways structure. Sentiment remains skeptical.
Accumulation happens quietly while narratives stay muted.
Phase 3 – Expansion
Momentum returns. Higher highs form.
Liquidity expands alongside participation.
New all-time highs develop only after structure confirms.
Now look at the present context.
We’ve already seen a correction phase that reset leverage and sentiment. The question is whether this compression is transitioning into a growth-loading phase — or whether more structural rebuilding is required.
For a true growth phase to begin, $BTC needs:
• Clear higher lows on higher timeframes
• Resistance zones reclaimed with follow-through
• Expanding volume, not thinning liquidity
• Reduced volatility on pullbacks
Cycles are not about predicting the exact week of reversal.
They’re about recognizing phase shifts.
If the contraction has largely completed, the market will start showing it through structure first — not headlines.
Correction phases exhaust participants.
Growth phases reward patience.
Right now, the chart is closer to transition than collapse.
But confirmation always comes from price behavior, not from cycle theory alone.
#BTC #Bitcoin #Crypto
{future}(BTCUSDT)
Bitcoin Cycle Mechanics: Compression Before Expansion?
There’s a recurring rhythm in $BTC that many overlook:
Roughly 1 year of contraction → followed by ~3 years of expansion.
Not perfectly timed.
Not mechanically identical.
But structurally consistent.
How the cycle typically unfolds:
Phase 1 – Cleanup
Price declines. Excess leverage clears. Weak positioning exits.
Volatility compresses near the bottom as liquidity stabilizes.
Phase 2 – Base Formation
Sideways structure. Sentiment remains skeptical.
Accumulation happens quietly while narratives stay muted.
Phase 3 – Expansion
Momentum returns. Higher highs form.
Liquidity expands alongside participation.
New all-time highs develop only after structure confirms.
Now look at the present context.
We’ve already seen a correction phase that reset leverage and sentiment. The question is whether this compression is transitioning into a growth-loading phase — or whether more structural rebuilding is required.
For a true growth phase to begin, $BTC needs:
• Clear higher lows on higher timeframes
• Resistance zones reclaimed with follow-through
• Expanding volume, not thinning liquidity
• Reduced volatility on pullbacks
Cycles are not about predicting the exact week of reversal.
They’re about recognizing phase shifts.
If the contraction has largely completed, the market will start showing it through structure first — not headlines.
Correction phases exhaust participants.
Growth phases reward patience.
Right now, the chart is closer to transition than collapse.
But confirmation always comes from price behavior, not from cycle theory alone.
#BTC #Bitcoin #Crypto
Roughly 1 year of contraction → followed by ~3 years of expansion.
Not perfectly timed.
Not mechanically identical.
But structurally consistent.
How the cycle typically unfolds:
Phase 1 – Cleanup
Price declines. Excess leverage clears. Weak positioning exits.
Volatility compresses near the bottom as liquidity stabilizes.
Phase 2 – Base Formation
Sideways structure. Sentiment remains skeptical.
Accumulation happens quietly while narratives stay muted.
Phase 3 – Expansion
Momentum returns. Higher highs form.
Liquidity expands alongside participation.
New all-time highs develop only after structure confirms.
Now look at the present context.
We’ve already seen a correction phase that reset leverage and sentiment. The question is whether this compression is transitioning into a growth-loading phase — or whether more structural rebuilding is required.
For a true growth phase to begin, $BTC needs:
• Clear higher lows on higher timeframes
• Resistance zones reclaimed with follow-through
• Expanding volume, not thinning liquidity
• Reduced volatility on pullbacks
Cycles are not about predicting the exact week of reversal.
They’re about recognizing phase shifts.
If the contraction has largely completed, the market will start showing it through structure first — not headlines.
Correction phases exhaust participants.
Growth phases reward patience.
Right now, the chart is closer to transition than collapse.
But confirmation always comes from price behavior, not from cycle theory alone.
#BTC #Bitcoin #Crypto
12
6
73
69.1k
Artículo
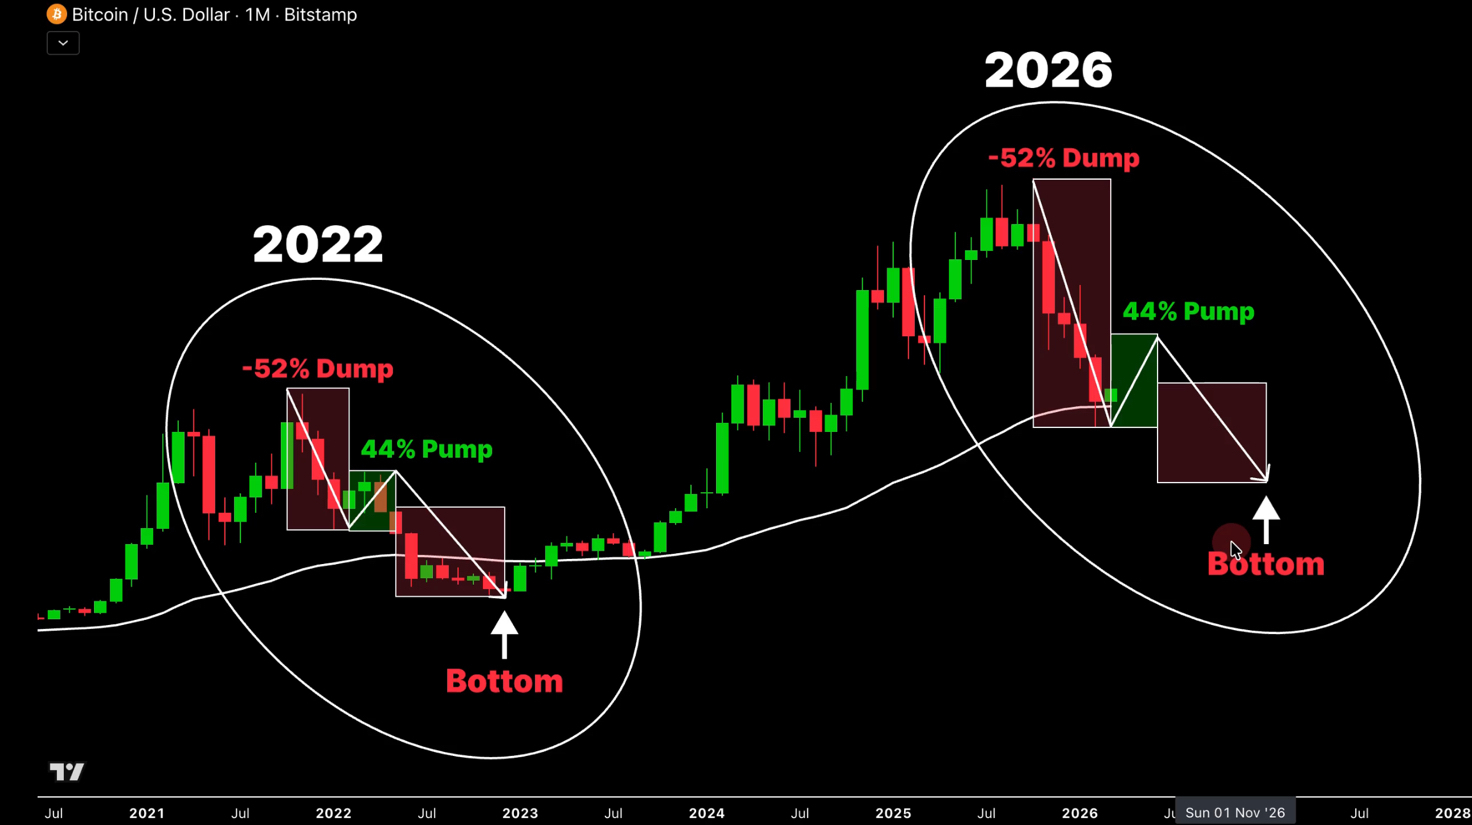
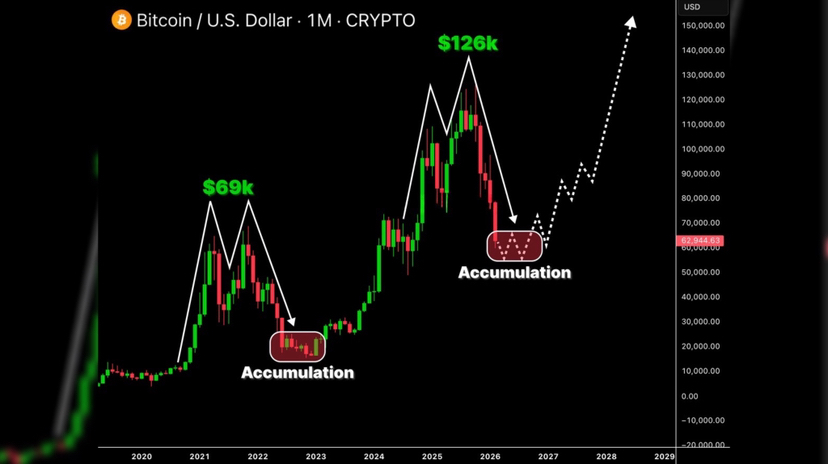
Bitcoin: Is the 2019–2022 Structure Repeating?There’s a growing narrative that $BTC is mirroring the 2019–2022 cycle almost step by step.
The sequence looks familiar:
Double top → sharp correction → extended accumulation → expansion phase.
On higher timeframes, the structural resemblance is noticeable. After a euphoric peak, price retraces aggressively, volatility compresses, and the market shifts into a prolonged sideways range where both bulls and bears lose conviction. That’s typically where long-term positioning quietly rebuilds.
But similarity is not certainty.
In 2019, the accumulation phase formed after liquidity was fully flushed and volatility contracted significantly. The breakout only happened once structure shifted — higher lows, resistance reclaim, sustained volume expansion.
If the pattern truly repeats, the current phase would represent late-stage consolidation rather than early-stage collapse.
However, there are a few conditions to monitor before concluding we are “closer to the bottom”:
• Is selling pressure decreasing on each push lower?
• Are higher timeframe lows holding consistently?
• Is liquidity being absorbed instead of aggressively rejected?
• Is volatility compressing instead of expanding?
Accumulation is not about blindly buying weakness. It’s about recognizing when downside momentum fades and structure stabilizes.
If this is indeed a historical rhyme, positioning during consolidation — not during breakout euphoria — tends to offer the best asymmetric opportunity.
But confirmation always comes from structure, not from pattern comparison alone.
Markets can echo the past.
They don’t copy it perfectly.
If you’re building positions, do it with structure awareness — not just historical optimism.
$BTC #Bitcoin #Crypto
{future}(BTCUSDT)
Bitcoin: Is the 2019–2022 Structure Repeating?
There’s a growing narrative that $BTC is mirroring the 2019–2022 cycle almost step by step.
The sequence looks familiar:
Double top → sharp correction → extended accumulation → expansion phase.
On higher timeframes, the structural resemblance is noticeable. After a euphoric peak, price retraces aggressively, volatility compresses, and the market shifts into a prolonged sideways range where both bulls and bears lose conviction. That’s typically where long-term positioning quietly rebuilds.
But similarity is not certainty.
In 2019, the accumulation phase formed after liquidity was fully flushed and volatility contracted significantly. The breakout only happened once structure shifted — higher lows, resistance reclaim, sustained volume expansion.
If the pattern truly repeats, the current phase would represent late-stage consolidation rather than early-stage collapse.
However, there are a few conditions to monitor before concluding we are “closer to the bottom”:
• Is selling pressure decreasing on each push lower?
• Are higher timeframe lows holding consistently?
• Is liquidity being absorbed instead of aggressively rejected?
• Is volatility compressing instead of expanding?
Accumulation is not about blindly buying weakness. It’s about recognizing when downside momentum fades and structure stabilizes.
If this is indeed a historical rhyme, positioning during consolidation — not during breakout euphoria — tends to offer the best asymmetric opportunity.
But confirmation always comes from structure, not from pattern comparison alone.
Markets can echo the past.
They don’t copy it perfectly.
If you’re building positions, do it with structure awareness — not just historical optimism.
$BTC #Bitcoin #Crypto
The sequence looks familiar:
Double top → sharp correction → extended accumulation → expansion phase.
On higher timeframes, the structural resemblance is noticeable. After a euphoric peak, price retraces aggressively, volatility compresses, and the market shifts into a prolonged sideways range where both bulls and bears lose conviction. That’s typically where long-term positioning quietly rebuilds.
But similarity is not certainty.
In 2019, the accumulation phase formed after liquidity was fully flushed and volatility contracted significantly. The breakout only happened once structure shifted — higher lows, resistance reclaim, sustained volume expansion.
If the pattern truly repeats, the current phase would represent late-stage consolidation rather than early-stage collapse.
However, there are a few conditions to monitor before concluding we are “closer to the bottom”:
• Is selling pressure decreasing on each push lower?
• Are higher timeframe lows holding consistently?
• Is liquidity being absorbed instead of aggressively rejected?
• Is volatility compressing instead of expanding?
Accumulation is not about blindly buying weakness. It’s about recognizing when downside momentum fades and structure stabilizes.
If this is indeed a historical rhyme, positioning during consolidation — not during breakout euphoria — tends to offer the best asymmetric opportunity.
But confirmation always comes from structure, not from pattern comparison alone.
Markets can echo the past.
They don’t copy it perfectly.
If you’re building positions, do it with structure awareness — not just historical optimism.
$BTC #Bitcoin #Crypto
8
6
90
109k
Artículo
BTC Futures Are Heavy Short — Is The Bounce Setup Building?Something changed in the derivatives landscape.
And it’s not subtle.
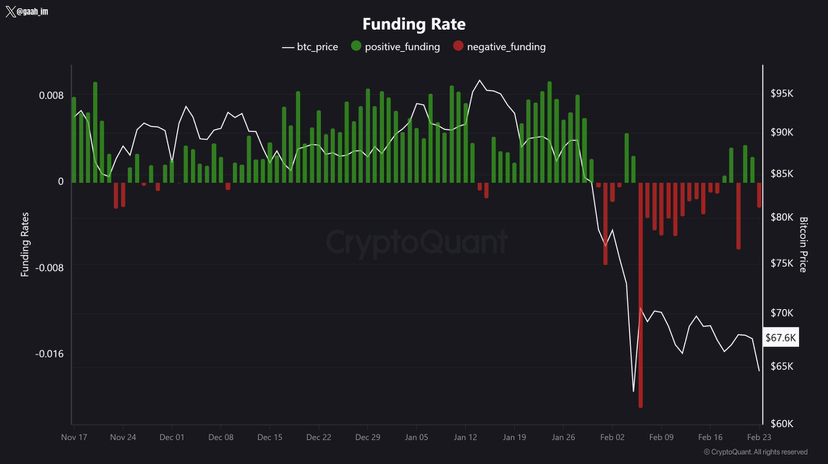
Funding rates are sitting deep in negative territory while Bitcoin hovers in the ~$62K–$68K zone. That tells you one thing clearly: the dominant positioning right now is bearish.$BTC
Shorts are paying.
That’s pressure building under the surface.
Compare This To The $80K Bottom
At the previous local bottom around $80K, funding was mostly positive. Traders were still leaning long. Optimism hadn’t fully cracked.
This time is different.
Since July 2025, the tape has been seller-controlled. Every bounce has felt mechanical. Buy limit orders aren’t chasing — they’re absorbing. That’s not aggression. That’s defense.
Selling pressure over the past few weeks has reached its highest level in three months.
That’s not random noise.
That’s positioning stress.$BTC
16 Months Of Leverage — Now Being Purged
The futures market has been running hot for over a year.
High leverage.
Crowded positioning.
Compressed risk.
Since the last ATH, that leverage has been unwinding. Slowly at first. Then violently.
Every sharp drop forces liquidations.
Every flush reduces systemic fragility.
Every deleveraging wave improves structural health.
Painful short term.
Constructive long term.
What Negative Funding Really Means
When funding stays deeply negative at support:
• Shorts are overcrowded
• Sentiment leans defensive
• Downside conviction is high
• But squeeze fuel builds overhead
This doesn’t guarantee a rally.
But it creates asymmetry.
Because when everyone leans one direction, the unwind can be sharp.
The Bigger Picture
Right now:
• Spot demand is cautious
• Futures traders are leaning short
• Leverage is compressing
• Capitulation is cleansing excess
This is how bottoms start forming.
Not with excitement.
With exhaustion.
The market doesn’t bounce because people are confident.
It bounces because positioning becomes too one-sided to sustain.
Bears currently dominate the futures tape.
The question isn’t whether they’re right.
It’s whether they’re too crowded.
#Bitcoin #Crypto
{future}(BTCUSDT)
BTC Futures Are Heavy Short — Is The Bounce Setup Building?
Something changed in the derivatives landscape.
And it’s not subtle.
Funding rates are sitting deep in negative territory while Bitcoin hovers in the ~$62K–$68K zone. That tells you one thing clearly: the dominant positioning right now is bearish.$BTC
Shorts are paying.
That’s pressure building under the surface.
Compare This To The $80K Bottom
At the previous local bottom around $80K, funding was mostly positive. Traders were still leaning long. Optimism hadn’t fully cracked.
This time is different.
Since July 2025, the tape has been seller-controlled. Every bounce has felt mechanical. Buy limit orders aren’t chasing — they’re absorbing. That’s not aggression. That’s defense.
Selling pressure over the past few weeks has reached its highest level in three months.
That’s not random noise.
That’s positioning stress.$BTC
16 Months Of Leverage — Now Being Purged
The futures market has been running hot for over a year.
High leverage.
Crowded positioning.
Compressed risk.
Since the last ATH, that leverage has been unwinding. Slowly at first. Then violently.
Every sharp drop forces liquidations.
Every flush reduces systemic fragility.
Every deleveraging wave improves structural health.
Painful short term.
Constructive long term.
What Negative Funding Really Means
When funding stays deeply negative at support:
• Shorts are overcrowded
• Sentiment leans defensive
• Downside conviction is high
• But squeeze fuel builds overhead
This doesn’t guarantee a rally.
But it creates asymmetry.
Because when everyone leans one direction, the unwind can be sharp.
The Bigger Picture
Right now:
• Spot demand is cautious
• Futures traders are leaning short
• Leverage is compressing
• Capitulation is cleansing excess
This is how bottoms start forming.
Not with excitement.
With exhaustion.
The market doesn’t bounce because people are confident.
It bounces because positioning becomes too one-sided to sustain.
Bears currently dominate the futures tape.
The question isn’t whether they’re right.
It’s whether they’re too crowded.
#Bitcoin #Crypto
And it’s not subtle.
Funding rates are sitting deep in negative territory while Bitcoin hovers in the ~$62K–$68K zone. That tells you one thing clearly: the dominant positioning right now is bearish.$BTC
Shorts are paying.
That’s pressure building under the surface.
Compare This To The $80K Bottom
At the previous local bottom around $80K, funding was mostly positive. Traders were still leaning long. Optimism hadn’t fully cracked.
This time is different.
Since July 2025, the tape has been seller-controlled. Every bounce has felt mechanical. Buy limit orders aren’t chasing — they’re absorbing. That’s not aggression. That’s defense.
Selling pressure over the past few weeks has reached its highest level in three months.
That’s not random noise.
That’s positioning stress.$BTC
16 Months Of Leverage — Now Being Purged
The futures market has been running hot for over a year.
High leverage.
Crowded positioning.
Compressed risk.
Since the last ATH, that leverage has been unwinding. Slowly at first. Then violently.
Every sharp drop forces liquidations.
Every flush reduces systemic fragility.
Every deleveraging wave improves structural health.
Painful short term.
Constructive long term.
What Negative Funding Really Means
When funding stays deeply negative at support:
• Shorts are overcrowded
• Sentiment leans defensive
• Downside conviction is high
• But squeeze fuel builds overhead
This doesn’t guarantee a rally.
But it creates asymmetry.
Because when everyone leans one direction, the unwind can be sharp.
The Bigger Picture
Right now:
• Spot demand is cautious
• Futures traders are leaning short
• Leverage is compressing
• Capitulation is cleansing excess
This is how bottoms start forming.
Not with excitement.
With exhaustion.
The market doesn’t bounce because people are confident.
It bounces because positioning becomes too one-sided to sustain.
Bears currently dominate the futures tape.
The question isn’t whether they’re right.
It’s whether they’re too crowded.
#Bitcoin #Crypto
6
1.7k
Artículo
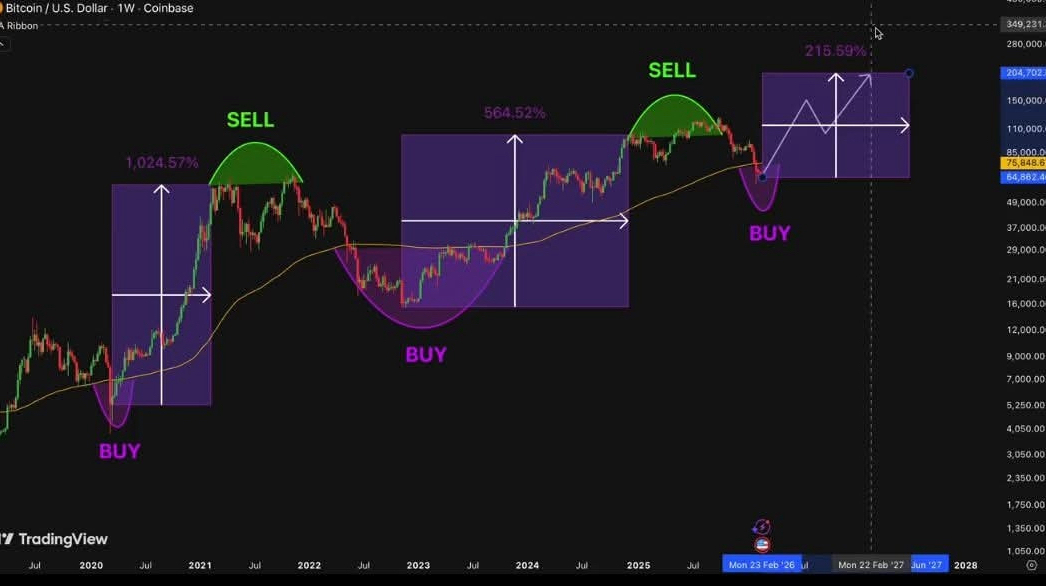
BTC And The Weekly 200 EMA — Where Cycles Quietly ResetThere’s a level on the chart that rarely gets the attention it deserves.
Not because it’s flashy.
Not because it predicts tomorrow.
But because it keeps showing up at turning points.
The weekly 200 EMA.
Every time Bitcoin drifts toward it — or spends extended time around it — something deeper starts happening beneath the surface.
What This Zone Represents
The weekly 200 EMA isn’t just a moving average.
It’s a long-term equilibrium line.
When price trades far above it, optimism dominates.
When price compresses back into it, psychology shifts.
Fear builds.
Conviction gets tested.
Narratives fracture.
That emotional reset is part of the structural cycle.
Look Back — Not At Percentages, But At Process
In 2019–2020, BTC consolidated near the 200 EMA for months.
Volatility dried up.
Interest faded.
Confidence was thin.
Then the expansion phase began.
In 2022–2023, the same thing happened.
Macro fear.
Tight liquidity.
Doubt everywhere.
Price hovered around the weekly 200 EMA again.
And from there, the next major uptrend was born.
The magnitude of rallies matters less than the pattern of behavior:
• Extended compression
• Weak hands exiting
• Stronger hands accumulating
• Leverage flushed out
That’s how sustainable moves are built.
Why This Area Becomes a DCA Zone
It’s not about calling the exact bottom.
It’s about risk compression.
Historically, when BTC stabilizes around the weekly 200 EMA:
• Downside becomes more limited relative to upside
• Volatility contracts
• Sentiment becomes neutral-to-bearish
• Structural accumulation builds quietly
The best expansions didn’t start from hype.
They started from boredom.
From uncertainty.
From emotional exhaustion.
Where We Stand Now
Price is once again revisiting that long-term equilibrium area.
Momentum feels muted.
Narratives are divided.
Confidence is cautious.
That doesn’t scream euphoria.
It resembles preparation.
Important Reality
This does not mean price can’t dip lower short term.
It does not guarantee an immediate rally.
And it does not allow precise bottom timing.
What it does show is this:
Every previous time Bitcoin stabilized around this structure, the next cycle reshaped expectations.
Markets expand from discomfort — not from certainty.
History doesn’t repeat perfectly.
But structural behavior tends to rhyme.
And the weekly 200 EMA has consistently been where cycles quietly reset.
$BTC #BTC #crypto
{future}(BTCUSDT)
BTC And The Weekly 200 EMA — Where Cycles Quietly Reset
There’s a level on the chart that rarely gets the attention it deserves.
Not because it’s flashy.
Not because it predicts tomorrow.
But because it keeps showing up at turning points.
The weekly 200 EMA.
Every time Bitcoin drifts toward it — or spends extended time around it — something deeper starts happening beneath the surface.
What This Zone Represents
The weekly 200 EMA isn’t just a moving average.
It’s a long-term equilibrium line.
When price trades far above it, optimism dominates.
When price compresses back into it, psychology shifts.
Fear builds.
Conviction gets tested.
Narratives fracture.
That emotional reset is part of the structural cycle.
Look Back — Not At Percentages, But At Process
In 2019–2020, BTC consolidated near the 200 EMA for months.
Volatility dried up.
Interest faded.
Confidence was thin.
Then the expansion phase began.
In 2022–2023, the same thing happened.
Macro fear.
Tight liquidity.
Doubt everywhere.
Price hovered around the weekly 200 EMA again.
And from there, the next major uptrend was born.
The magnitude of rallies matters less than the pattern of behavior:
• Extended compression
• Weak hands exiting
• Stronger hands accumulating
• Leverage flushed out
That’s how sustainable moves are built.
Why This Area Becomes a DCA Zone
It’s not about calling the exact bottom.
It’s about risk compression.
Historically, when BTC stabilizes around the weekly 200 EMA:
• Downside becomes more limited relative to upside
• Volatility contracts
• Sentiment becomes neutral-to-bearish
• Structural accumulation builds quietly
The best expansions didn’t start from hype.
They started from boredom.
From uncertainty.
From emotional exhaustion.
Where We Stand Now
Price is once again revisiting that long-term equilibrium area.
Momentum feels muted.
Narratives are divided.
Confidence is cautious.
That doesn’t scream euphoria.
It resembles preparation.
Important Reality
This does not mean price can’t dip lower short term.
It does not guarantee an immediate rally.
And it does not allow precise bottom timing.
What it does show is this:
Every previous time Bitcoin stabilized around this structure, the next cycle reshaped expectations.
Markets expand from discomfort — not from certainty.
History doesn’t repeat perfectly.
But structural behavior tends to rhyme.
And the weekly 200 EMA has consistently been where cycles quietly reset.
$BTC #BTC #crypto
Not because it’s flashy.
Not because it predicts tomorrow.
But because it keeps showing up at turning points.
The weekly 200 EMA.
Every time Bitcoin drifts toward it — or spends extended time around it — something deeper starts happening beneath the surface.
What This Zone Represents
The weekly 200 EMA isn’t just a moving average.
It’s a long-term equilibrium line.
When price trades far above it, optimism dominates.
When price compresses back into it, psychology shifts.
Fear builds.
Conviction gets tested.
Narratives fracture.
That emotional reset is part of the structural cycle.
Look Back — Not At Percentages, But At Process
In 2019–2020, BTC consolidated near the 200 EMA for months.
Volatility dried up.
Interest faded.
Confidence was thin.
Then the expansion phase began.
In 2022–2023, the same thing happened.
Macro fear.
Tight liquidity.
Doubt everywhere.
Price hovered around the weekly 200 EMA again.
And from there, the next major uptrend was born.
The magnitude of rallies matters less than the pattern of behavior:
• Extended compression
• Weak hands exiting
• Stronger hands accumulating
• Leverage flushed out
That’s how sustainable moves are built.
Why This Area Becomes a DCA Zone
It’s not about calling the exact bottom.
It’s about risk compression.
Historically, when BTC stabilizes around the weekly 200 EMA:
• Downside becomes more limited relative to upside
• Volatility contracts
• Sentiment becomes neutral-to-bearish
• Structural accumulation builds quietly
The best expansions didn’t start from hype.
They started from boredom.
From uncertainty.
From emotional exhaustion.
Where We Stand Now
Price is once again revisiting that long-term equilibrium area.
Momentum feels muted.
Narratives are divided.
Confidence is cautious.
That doesn’t scream euphoria.
It resembles preparation.
Important Reality
This does not mean price can’t dip lower short term.
It does not guarantee an immediate rally.
And it does not allow precise bottom timing.
What it does show is this:
Every previous time Bitcoin stabilized around this structure, the next cycle reshaped expectations.
Markets expand from discomfort — not from certainty.
History doesn’t repeat perfectly.
But structural behavior tends to rhyme.
And the weekly 200 EMA has consistently been where cycles quietly reset.
$BTC #BTC #crypto
2
12
5k
Artículo
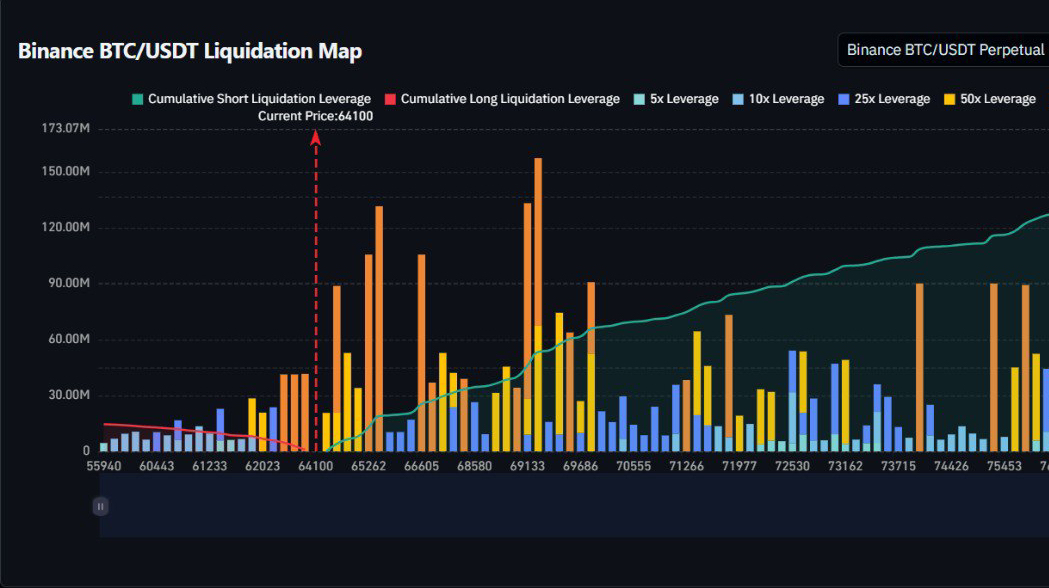
BTC LIQUIDATION TIME BOMB: $7.2B Shorts at RiskThere’s a visible skew in the derivatives landscape.
Roughly $7.2B in short exposure sits vulnerable if Bitcoin pushes ~20% higher.
On the downside, a 20% drop threatens only about $550M in long liquidations.
That’s not balance.
That’s asymmetry.
What This Actually Means
When positioning becomes heavily one-sided, the market becomes structurally unstable.
• Shorts cluster above resistance
• Stops stack tightly
• Liquidation levels compress
• Funding dynamics skew negative
If price begins pushing upward with momentum, it doesn’t just rise — it accelerates.
Because forced buying fuels continuation.
That’s how squeezes form.
But There’s A Catch
Liquidation maps show potential fuel — not direction.
Markets often:
• Sweep weak longs first
• Create doubt
• Then rotate aggressively
• Or fail to squeeze at all
Liquidity is a magnet.
But price doesn’t move because traders expect it to.
It moves when positioning becomes fragile enough to break.
The Real Signal To Watch
If $BTC begins reclaiming key resistance with:
• Rising spot volume
• Positive delta absorption
• Shorts adding into strength
That’s when the squeeze probability increases dramatically.
Without spot demand, liquidation data alone won’t sustain expansion.
The Current Structure
Short exposure stacked above.
Long exposure relatively light below.
Positioning skewed defensive.
That creates upside convexity — but only if momentum ignites.
Until then, it’s just compressed risk.
In leveraged markets, price tends to travel toward the side that causes the most forced reaction.
Right now, that pain sits overhead.
The imbalance is clear.
The trigger isn’t.
#BTC #Bitcoin #Crypto
{future}(BTCUSDT)
BTC LIQUIDATION TIME BOMB: $7.2B Shorts at Risk
There’s a visible skew in the derivatives landscape.
Roughly $7.2B in short exposure sits vulnerable if Bitcoin pushes ~20% higher.
On the downside, a 20% drop threatens only about $550M in long liquidations.
That’s not balance.
That’s asymmetry.
What This Actually Means
When positioning becomes heavily one-sided, the market becomes structurally unstable.
• Shorts cluster above resistance
• Stops stack tightly
• Liquidation levels compress
• Funding dynamics skew negative
If price begins pushing upward with momentum, it doesn’t just rise — it accelerates.
Because forced buying fuels continuation.
That’s how squeezes form.
But There’s A Catch
Liquidation maps show potential fuel — not direction.
Markets often:
• Sweep weak longs first
• Create doubt
• Then rotate aggressively
• Or fail to squeeze at all
Liquidity is a magnet.
But price doesn’t move because traders expect it to.
It moves when positioning becomes fragile enough to break.
The Real Signal To Watch
If $BTC begins reclaiming key resistance with:
• Rising spot volume
• Positive delta absorption
• Shorts adding into strength
That’s when the squeeze probability increases dramatically.
Without spot demand, liquidation data alone won’t sustain expansion.
The Current Structure
Short exposure stacked above.
Long exposure relatively light below.
Positioning skewed defensive.
That creates upside convexity — but only if momentum ignites.
Until then, it’s just compressed risk.
In leveraged markets, price tends to travel toward the side that causes the most forced reaction.
Right now, that pain sits overhead.
The imbalance is clear.
The trigger isn’t.
#BTC #Bitcoin #Crypto
Roughly $7.2B in short exposure sits vulnerable if Bitcoin pushes ~20% higher.
On the downside, a 20% drop threatens only about $550M in long liquidations.
That’s not balance.
That’s asymmetry.
What This Actually Means
When positioning becomes heavily one-sided, the market becomes structurally unstable.
• Shorts cluster above resistance
• Stops stack tightly
• Liquidation levels compress
• Funding dynamics skew negative
If price begins pushing upward with momentum, it doesn’t just rise — it accelerates.
Because forced buying fuels continuation.
That’s how squeezes form.
But There’s A Catch
Liquidation maps show potential fuel — not direction.
Markets often:
• Sweep weak longs first
• Create doubt
• Then rotate aggressively
• Or fail to squeeze at all
Liquidity is a magnet.
But price doesn’t move because traders expect it to.
It moves when positioning becomes fragile enough to break.
The Real Signal To Watch
If $BTC begins reclaiming key resistance with:
• Rising spot volume
• Positive delta absorption
• Shorts adding into strength
That’s when the squeeze probability increases dramatically.
Without spot demand, liquidation data alone won’t sustain expansion.
The Current Structure
Short exposure stacked above.
Long exposure relatively light below.
Positioning skewed defensive.
That creates upside convexity — but only if momentum ignites.
Until then, it’s just compressed risk.
In leveraged markets, price tends to travel toward the side that causes the most forced reaction.
Right now, that pain sits overhead.
The imbalance is clear.
The trigger isn’t.
#BTC #Bitcoin #Crypto
8
2.9k
Artículo
BTC MVRV Has Cooled — But It Hasn’t Fully ResetMVRV is one of the cleanest valuation gauges we have on-chain.
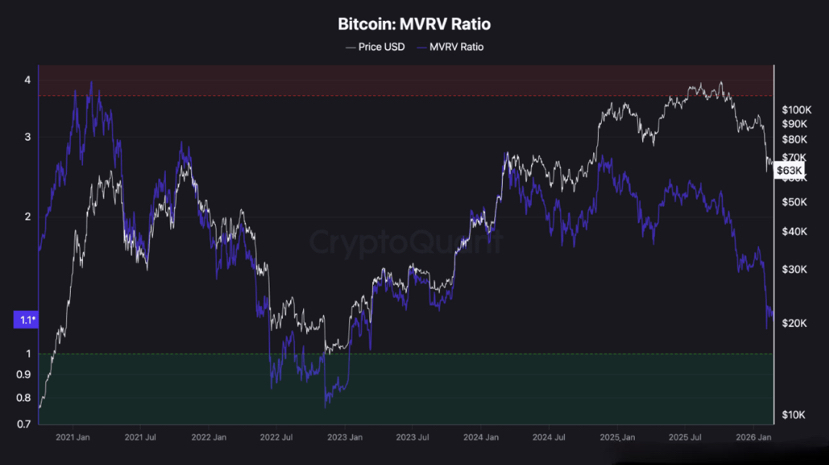
It compares market value to realized value — essentially measuring how far price sits above (or below) the average on-chain cost basis.
And right now, it’s telling a very specific story.
Where We Came From
In 2021, MVRV pushed into the 3.8–4.0 zone.
That was clear overheating.
Excess profit.
Late-cycle euphoria.
In 2022, the reset was undeniable:
• MVRV broke below 1.0
• Briefly touched ~0.8
• Majority of holders moved into loss
That was capitulation territory.
That was structural pain.
Where We Are Now
Today, MVRV sits around 1.1–1.2.
That implies:
• The average holder is still in profit
• No broad-based loss environment
• Valuation has compressed, but not purged
• Sentiment is weak — but not destroyed
This isn’t a euphoric market.
But it’s not a washed-out one either.
Why This Matters
In prior cycles, durable bottoms formed when:
• MVRV approached 1.0
• Or fell decisively below it
• Unrealized profits evaporated
• Emotional exhaustion peaked
That’s not what we see right now.
We see cooling.
Not full capitulation.
What It Does — And Doesn’t — Mean
This does not guarantee further downside.
Markets can bottom above 1.0 if structural conditions change.
But historically, the deepest resets required broader profit wipeouts.
Right now:
• Profit margins are thinner
• Leverage has compressed
• Volatility has cooled
But the system hasn’t experienced the kind of full valuation flush seen in 2022.
The Big Picture
MVRV isn’t flashing “overheated.”
It’s also not flashing “deep value.”
It’s sitting in the middle.
That’s usually a transitional zone — not a final one.
MVRV has cooled.
It hasn’t fully reset.
$BTC #Bitcoin #Crypto
{future}(BTCUSDT)
BTC MVRV Has Cooled — But It Hasn’t Fully Reset
MVRV is one of the cleanest valuation gauges we have on-chain.
It compares market value to realized value — essentially measuring how far price sits above (or below) the average on-chain cost basis.
And right now, it’s telling a very specific story.
Where We Came From
In 2021, MVRV pushed into the 3.8–4.0 zone.
That was clear overheating.
Excess profit.
Late-cycle euphoria.
In 2022, the reset was undeniable:
• MVRV broke below 1.0
• Briefly touched ~0.8
• Majority of holders moved into loss
That was capitulation territory.
That was structural pain.
Where We Are Now
Today, MVRV sits around 1.1–1.2.
That implies:
• The average holder is still in profit
• No broad-based loss environment
• Valuation has compressed, but not purged
• Sentiment is weak — but not destroyed
This isn’t a euphoric market.
But it’s not a washed-out one either.
Why This Matters
In prior cycles, durable bottoms formed when:
• MVRV approached 1.0
• Or fell decisively below it
• Unrealized profits evaporated
• Emotional exhaustion peaked
That’s not what we see right now.
We see cooling.
Not full capitulation.
What It Does — And Doesn’t — Mean
This does not guarantee further downside.
Markets can bottom above 1.0 if structural conditions change.
But historically, the deepest resets required broader profit wipeouts.
Right now:
• Profit margins are thinner
• Leverage has compressed
• Volatility has cooled
But the system hasn’t experienced the kind of full valuation flush seen in 2022.
The Big Picture
MVRV isn’t flashing “overheated.”
It’s also not flashing “deep value.”
It’s sitting in the middle.
That’s usually a transitional zone — not a final one.
MVRV has cooled.
It hasn’t fully reset.
$BTC #Bitcoin #Crypto
It compares market value to realized value — essentially measuring how far price sits above (or below) the average on-chain cost basis.
And right now, it’s telling a very specific story.
Where We Came From
In 2021, MVRV pushed into the 3.8–4.0 zone.
That was clear overheating.
Excess profit.
Late-cycle euphoria.
In 2022, the reset was undeniable:
• MVRV broke below 1.0
• Briefly touched ~0.8
• Majority of holders moved into loss
That was capitulation territory.
That was structural pain.
Where We Are Now
Today, MVRV sits around 1.1–1.2.
That implies:
• The average holder is still in profit
• No broad-based loss environment
• Valuation has compressed, but not purged
• Sentiment is weak — but not destroyed
This isn’t a euphoric market.
But it’s not a washed-out one either.
Why This Matters
In prior cycles, durable bottoms formed when:
• MVRV approached 1.0
• Or fell decisively below it
• Unrealized profits evaporated
• Emotional exhaustion peaked
That’s not what we see right now.
We see cooling.
Not full capitulation.
What It Does — And Doesn’t — Mean
This does not guarantee further downside.
Markets can bottom above 1.0 if structural conditions change.
But historically, the deepest resets required broader profit wipeouts.
Right now:
• Profit margins are thinner
• Leverage has compressed
• Volatility has cooled
But the system hasn’t experienced the kind of full valuation flush seen in 2022.
The Big Picture
MVRV isn’t flashing “overheated.”
It’s also not flashing “deep value.”
It’s sitting in the middle.
That’s usually a transitional zone — not a final one.
MVRV has cooled.
It hasn’t fully reset.
$BTC #Bitcoin #Crypto
5
618
Artículo
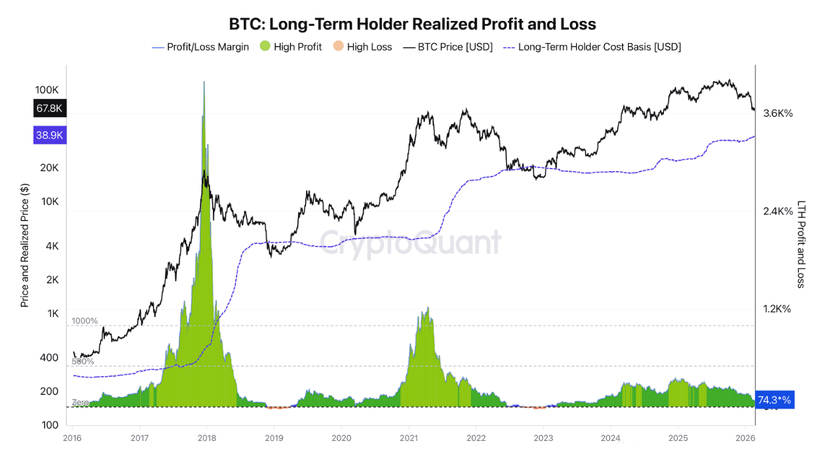
BTC Drifting Toward the LTH Pain Threshold{future}(BNBUSDT)
When the market stalls, the real story isn’t on the 4H chart.
It’s in cohort behavior.
And right now, the Long-Term Holders (LTHs) are the group to watch.
Where LTHs Stand Today
At current prices, LTHs are still sitting on an average unrealized profit of roughly 74%.
That sounds comfortable.
But that margin is compressing.
As price drifts lower, BTC inches closer to the LTH realized price, currently estimated around $38,900.
And this level matters more than most realize.
Why the LTH Cost Basis Is Critical
The LTH realized price represents the average on-chain acquisition cost of holders who have held for 155+ days.
It isn’t static.
It rises over time as Short-Term Holders (STHs) who bought at higher prices age into the LTH category.
That means the structural “pain line” gradually climbs each cycle.
Historically, major bear markets have followed a similar pattern:
• Price trends downward
• LTH profit margins compress
• Eventually price breaks below LTH cost basis
• Final capitulation unfolds
• ~15–20% realized loss event occurs
• Market rebuilds from there
That breakdown below LTH cost has often marked the emotional purge phase.#Creatorpadvn $BNB
What Makes This Cycle Different?
We can’t ignore structural shifts.
This cycle includes:
• Institutional allocation
• Corporate treasury exposure
• ETF participation
• Sovereign involvement
Previous cycles were predominantly retail-driven.
This one isn’t.
That matters.
Institutions behave differently under drawdown. Their time horizon, capital structure, and mandate differ from retail capitulation patterns of 2018 or 2022.
So while history shows price often pierces LTH cost basis before true recovery, it’s not a guaranteed outcome.@Binance_Vietnam
The Core Risk Scenario
If BTC continues weakening:
• LTH profit margin compresses further
• Psychological pressure increases
• Weak LTH hands begin distributing
• Realized losses accelerate
• Final capitulation event forms
That’s the classical endgame.
But until price approaches the $38K–$40K region, that scenario remains conditional — not active.
The Structural Perspective
Right now:
• LTHs are still deeply profitable
• No mass LTH capitulation visible
• Profit compression is gradual
• No panic behavior from strong hands
The market is drifting — not collapsing.
The key question becomes:
Does this cycle require the traditional LTH pain event to reset?
Or do new structural participants alter that rhythm?
History suggests bear markets end when long-term conviction gets tested.
But cycles evolve.
For now, the LTH pain line sits far below price — and it’s rising slowly.
Whether we approach it — or reverse before touching it — will likely define the character of this entire cycle.
$BTC #Bitcoin #Crypto
{future}(BTCUSDT)
BTC Drifting Toward the LTH Pain Threshold
When the market stalls, the real story isn’t on the 4H chart.
It’s in cohort behavior.
And right now, the Long-Term Holders (LTHs) are the group to watch.
Where LTHs Stand Today
At current prices, LTHs are still sitting on an average unrealized profit of roughly 74%.
That sounds comfortable.
But that margin is compressing.
As price drifts lower, BTC inches closer to the LTH realized price, currently estimated around $38,900.
And this level matters more than most realize.
Why the LTH Cost Basis Is Critical
The LTH realized price represents the average on-chain acquisition cost of holders who have held for 155+ days.
It isn’t static.
It rises over time as Short-Term Holders (STHs) who bought at higher prices age into the LTH category.
That means the structural “pain line” gradually climbs each cycle.
Historically, major bear markets have followed a similar pattern:
• Price trends downward
• LTH profit margins compress
• Eventually price breaks below LTH cost basis
• Final capitulation unfolds
• ~15–20% realized loss event occurs
• Market rebuilds from there
That breakdown below LTH cost has often marked the emotional purge phase.#Creatorpadvn $BNB
What Makes This Cycle Different?
We can’t ignore structural shifts.
This cycle includes:
• Institutional allocation
• Corporate treasury exposure
• ETF participation
• Sovereign involvement
Previous cycles were predominantly retail-driven.
This one isn’t.
That matters.
Institutions behave differently under drawdown. Their time horizon, capital structure, and mandate differ from retail capitulation patterns of 2018 or 2022.
So while history shows price often pierces LTH cost basis before true recovery, it’s not a guaranteed outcome.@Binance Vietnam
The Core Risk Scenario
If BTC continues weakening:
• LTH profit margin compresses further
• Psychological pressure increases
• Weak LTH hands begin distributing
• Realized losses accelerate
• Final capitulation event forms
That’s the classical endgame.
But until price approaches the $38K–$40K region, that scenario remains conditional — not active.
The Structural Perspective
Right now:
• LTHs are still deeply profitable
• No mass LTH capitulation visible
• Profit compression is gradual
• No panic behavior from strong hands
The market is drifting — not collapsing.
The key question becomes:
Does this cycle require the traditional LTH pain event to reset?
Or do new structural participants alter that rhythm?
History suggests bear markets end when long-term conviction gets tested.
But cycles evolve.
For now, the LTH pain line sits far below price — and it’s rising slowly.
Whether we approach it — or reverse before touching it — will likely define the character of this entire cycle.
$BTC #Bitcoin #Crypto
It’s in cohort behavior.
And right now, the Long-Term Holders (LTHs) are the group to watch.
Where LTHs Stand Today
At current prices, LTHs are still sitting on an average unrealized profit of roughly 74%.
That sounds comfortable.
But that margin is compressing.
As price drifts lower, BTC inches closer to the LTH realized price, currently estimated around $38,900.
And this level matters more than most realize.
Why the LTH Cost Basis Is Critical
The LTH realized price represents the average on-chain acquisition cost of holders who have held for 155+ days.
It isn’t static.
It rises over time as Short-Term Holders (STHs) who bought at higher prices age into the LTH category.
That means the structural “pain line” gradually climbs each cycle.
Historically, major bear markets have followed a similar pattern:
• Price trends downward
• LTH profit margins compress
• Eventually price breaks below LTH cost basis
• Final capitulation unfolds
• ~15–20% realized loss event occurs
• Market rebuilds from there
That breakdown below LTH cost has often marked the emotional purge phase.#Creatorpadvn $BNB
What Makes This Cycle Different?
We can’t ignore structural shifts.
This cycle includes:
• Institutional allocation
• Corporate treasury exposure
• ETF participation
• Sovereign involvement
Previous cycles were predominantly retail-driven.
This one isn’t.
That matters.
Institutions behave differently under drawdown. Their time horizon, capital structure, and mandate differ from retail capitulation patterns of 2018 or 2022.
So while history shows price often pierces LTH cost basis before true recovery, it’s not a guaranteed outcome.@Binance Vietnam
The Core Risk Scenario
If BTC continues weakening:
• LTH profit margin compresses further
• Psychological pressure increases
• Weak LTH hands begin distributing
• Realized losses accelerate
• Final capitulation event forms
That’s the classical endgame.
But until price approaches the $38K–$40K region, that scenario remains conditional — not active.
The Structural Perspective
Right now:
• LTHs are still deeply profitable
• No mass LTH capitulation visible
• Profit compression is gradual
• No panic behavior from strong hands
The market is drifting — not collapsing.
The key question becomes:
Does this cycle require the traditional LTH pain event to reset?
Or do new structural participants alter that rhythm?
History suggests bear markets end when long-term conviction gets tested.
But cycles evolve.
For now, the LTH pain line sits far below price — and it’s rising slowly.
Whether we approach it — or reverse before touching it — will likely define the character of this entire cycle.
$BTC #Bitcoin #Crypto
4
604
Artículo
BTC Range Update — The Tape Already SpokeThis is what a real post-capitulation range looks like.
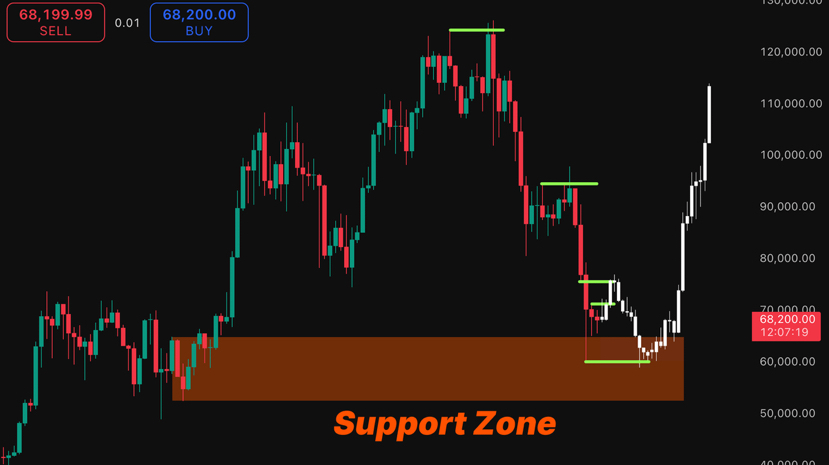
The drop to $60K wasn’t random volatility.
It was a selling climax.
Forced liquidations. Panic exits. Peak supply.
That low defines the floor.
The bounce to $72K wasn’t strength returning.
It was a reaction rally.
Short covering. Relief. Mechanical mean reversion.
That high defines the ceiling.
Now you have the battlefield:
$60K–$72K.
And this is where most traders get it wrong.
A Range Isn’t Noise — It’s A Process
After a heavy selloff, the range isn’t sideways chaos.
It’s a negotiation.
It answers one question:
Who is quietly gaining control?
If buyers are absorbing supply:
• Volume contracts over time
• Pullbacks get shallower
• Down candles shrink
• Upside expansions widen
That’s accumulation.
If sellers remain dominant:
• Volume stays elevated
• Drops expand aggressively
• Bounces overlap and stall
• Lower highs form inside the box
That’s distribution.
What The Structure Actually Shows
Look closely at how this range matured.
Volume never meaningfully cooled.
Upside attempts lacked follow-through.
Down candles consistently expanded wider than the up legs.
Sellers pressed for two consecutive weeks.
That’s not neutral tape.
That’s pressure.
The climax and the reaction rally only set the boundaries.
The real information comes from behavior inside the box.
And the behavior hasn’t been buyer-controlled.
Why Most Traders Misread It
People see chop and assume equilibrium.
But ranges after heavy selloffs often resolve in the direction of internal pressure.
If sellers dominate inside the range, the eventual break usually comes lower.
Not because of drama.
Because of exhaustion.
The Key Takeaway
$60K–$72K is not random consolidation.
It’s a structural decision zone.
The tape has been leaning one direction.
Most see sideways.
The market is actually revealing intent.
$BTC #Bitcoin #Crypto
{future}(BTCUSDT)
BTC Range Update — The Tape Already Spoke
This is what a real post-capitulation range looks like.
The drop to $60K wasn’t random volatility.
It was a selling climax.
Forced liquidations. Panic exits. Peak supply.
That low defines the floor.
The bounce to $72K wasn’t strength returning.
It was a reaction rally.
Short covering. Relief. Mechanical mean reversion.
That high defines the ceiling.
Now you have the battlefield:
$60K–$72K.
And this is where most traders get it wrong.
A Range Isn’t Noise — It’s A Process
After a heavy selloff, the range isn’t sideways chaos.
It’s a negotiation.
It answers one question:
Who is quietly gaining control?
If buyers are absorbing supply:
• Volume contracts over time
• Pullbacks get shallower
• Down candles shrink
• Upside expansions widen
That’s accumulation.
If sellers remain dominant:
• Volume stays elevated
• Drops expand aggressively
• Bounces overlap and stall
• Lower highs form inside the box
That’s distribution.
What The Structure Actually Shows
Look closely at how this range matured.
Volume never meaningfully cooled.
Upside attempts lacked follow-through.
Down candles consistently expanded wider than the up legs.
Sellers pressed for two consecutive weeks.
That’s not neutral tape.
That’s pressure.
The climax and the reaction rally only set the boundaries.
The real information comes from behavior inside the box.
And the behavior hasn’t been buyer-controlled.
Why Most Traders Misread It
People see chop and assume equilibrium.
But ranges after heavy selloffs often resolve in the direction of internal pressure.
If sellers dominate inside the range, the eventual break usually comes lower.
Not because of drama.
Because of exhaustion.
The Key Takeaway
$60K–$72K is not random consolidation.
It’s a structural decision zone.
The tape has been leaning one direction.
Most see sideways.
The market is actually revealing intent.
$BTC #Bitcoin #Crypto
The drop to $60K wasn’t random volatility.
It was a selling climax.
Forced liquidations. Panic exits. Peak supply.
That low defines the floor.
The bounce to $72K wasn’t strength returning.
It was a reaction rally.
Short covering. Relief. Mechanical mean reversion.
That high defines the ceiling.
Now you have the battlefield:
$60K–$72K.
And this is where most traders get it wrong.
A Range Isn’t Noise — It’s A Process
After a heavy selloff, the range isn’t sideways chaos.
It’s a negotiation.
It answers one question:
Who is quietly gaining control?
If buyers are absorbing supply:
• Volume contracts over time
• Pullbacks get shallower
• Down candles shrink
• Upside expansions widen
That’s accumulation.
If sellers remain dominant:
• Volume stays elevated
• Drops expand aggressively
• Bounces overlap and stall
• Lower highs form inside the box
That’s distribution.
What The Structure Actually Shows
Look closely at how this range matured.
Volume never meaningfully cooled.
Upside attempts lacked follow-through.
Down candles consistently expanded wider than the up legs.
Sellers pressed for two consecutive weeks.
That’s not neutral tape.
That’s pressure.
The climax and the reaction rally only set the boundaries.
The real information comes from behavior inside the box.
And the behavior hasn’t been buyer-controlled.
Why Most Traders Misread It
People see chop and assume equilibrium.
But ranges after heavy selloffs often resolve in the direction of internal pressure.
If sellers dominate inside the range, the eventual break usually comes lower.
Not because of drama.
Because of exhaustion.
The Key Takeaway
$60K–$72K is not random consolidation.
It’s a structural decision zone.
The tape has been leaning one direction.
Most see sideways.
The market is actually revealing intent.
$BTC #Bitcoin #Crypto
3
1
37
22.9k
Artículo
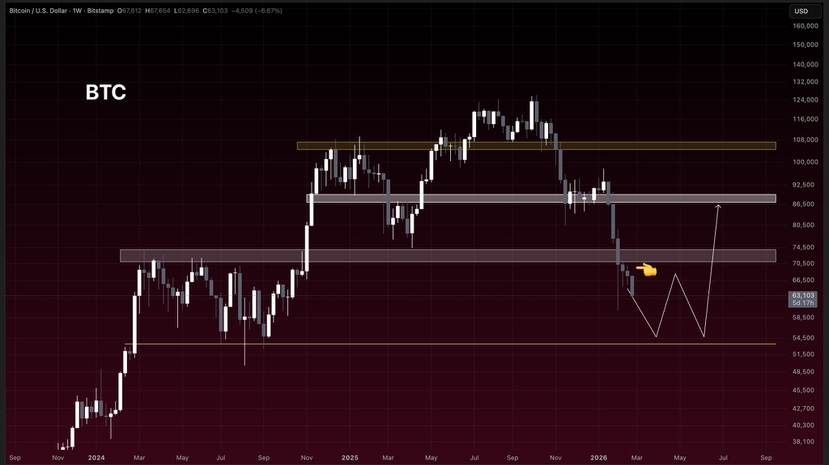
BTC Lost $70K — And That Changes The StructureFor nearly a year, the $70K–$71K weekly band acted as a structural shelf.
Support.
Acceptance.
Confidence.
Now it’s gone.
And this isn’t about intraday wicks — we’re talking about weekly closes below the level. That’s a structural shift, not noise.
When a level holds that long and then breaks, pretending nothing changed is dangerous.
Why $70K Mattered
That zone wasn’t just psychological.
It represented:
• Prior breakout acceptance
• High-volume consolidation
• Institutional cost clusters
• Trend continuation support
Once price loses a level like that and starts closing below it, it flips from support → resistance.
That grey shelf now caps upside until reclaimed.
The Downside Map
As long as $BTC remains below that weekly band:
➜ $60K becomes the first liquidity magnet
➜ $53K (yellow zone) becomes the deeper structural test
Those aren’t dramatic predictions — they’re logical liquidity pools below the breakdown.
Markets move toward inefficiencies.
Right now, liquidity sits lower.
What Flips The Script
The invalidation is simple:
Reclaim $70.8K
Close ABOVE it on a weekly basis
Hold it — not spike it
If that happens, the breakdown becomes a shakeout.
Structure would rotate back toward:
• Mid-$70Ks
• Possibly $80Ks
But until that reclaim happens, the burden of proof stays with bulls.
This Isn’t Emotional — It’s Structural
Every breakdown thesis needs an invalidation.
Here it is.
Below $70K weekly = defensive posture
Above $70.8K weekly hold = structural recovery
No guessing. No bias.
Just levels.
Right now, price is trading beneath a level that defined the market for a year.
That’s not something to ignore.
It’s something to respect.
$BTC #Bitcoin #Crypto
{future}(BTCUSDT)
BTC Lost $70K — And That Changes The Structure
For nearly a year, the $70K–$71K weekly band acted as a structural shelf.
Support.
Acceptance.
Confidence.
Now it’s gone.
And this isn’t about intraday wicks — we’re talking about weekly closes below the level. That’s a structural shift, not noise.
When a level holds that long and then breaks, pretending nothing changed is dangerous.
Why $70K Mattered
That zone wasn’t just psychological.
It represented:
• Prior breakout acceptance
• High-volume consolidation
• Institutional cost clusters
• Trend continuation support
Once price loses a level like that and starts closing below it, it flips from support → resistance.
That grey shelf now caps upside until reclaimed.
The Downside Map
As long as $BTC remains below that weekly band:
➜ $60K becomes the first liquidity magnet
➜ $53K (yellow zone) becomes the deeper structural test
Those aren’t dramatic predictions — they’re logical liquidity pools below the breakdown.
Markets move toward inefficiencies.
Right now, liquidity sits lower.
What Flips The Script
The invalidation is simple:
Reclaim $70.8K
Close ABOVE it on a weekly basis
Hold it — not spike it
If that happens, the breakdown becomes a shakeout.
Structure would rotate back toward:
• Mid-$70Ks
• Possibly $80Ks
But until that reclaim happens, the burden of proof stays with bulls.
This Isn’t Emotional — It’s Structural
Every breakdown thesis needs an invalidation.
Here it is.
Below $70K weekly = defensive posture
Above $70.8K weekly hold = structural recovery
No guessing. No bias.
Just levels.
Right now, price is trading beneath a level that defined the market for a year.
That’s not something to ignore.
It’s something to respect.
$BTC #Bitcoin #Crypto
Support.
Acceptance.
Confidence.
Now it’s gone.
And this isn’t about intraday wicks — we’re talking about weekly closes below the level. That’s a structural shift, not noise.
When a level holds that long and then breaks, pretending nothing changed is dangerous.
Why $70K Mattered
That zone wasn’t just psychological.
It represented:
• Prior breakout acceptance
• High-volume consolidation
• Institutional cost clusters
• Trend continuation support
Once price loses a level like that and starts closing below it, it flips from support → resistance.
That grey shelf now caps upside until reclaimed.
The Downside Map
As long as $BTC remains below that weekly band:
➜ $60K becomes the first liquidity magnet
➜ $53K (yellow zone) becomes the deeper structural test
Those aren’t dramatic predictions — they’re logical liquidity pools below the breakdown.
Markets move toward inefficiencies.
Right now, liquidity sits lower.
What Flips The Script
The invalidation is simple:
Reclaim $70.8K
Close ABOVE it on a weekly basis
Hold it — not spike it
If that happens, the breakdown becomes a shakeout.
Structure would rotate back toward:
• Mid-$70Ks
• Possibly $80Ks
But until that reclaim happens, the burden of proof stays with bulls.
This Isn’t Emotional — It’s Structural
Every breakdown thesis needs an invalidation.
Here it is.
Below $70K weekly = defensive posture
Above $70.8K weekly hold = structural recovery
No guessing. No bias.
Just levels.
Right now, price is trading beneath a level that defined the market for a year.
That’s not something to ignore.
It’s something to respect.
$BTC #Bitcoin #Crypto
15
7
27
20.7k
Artículo
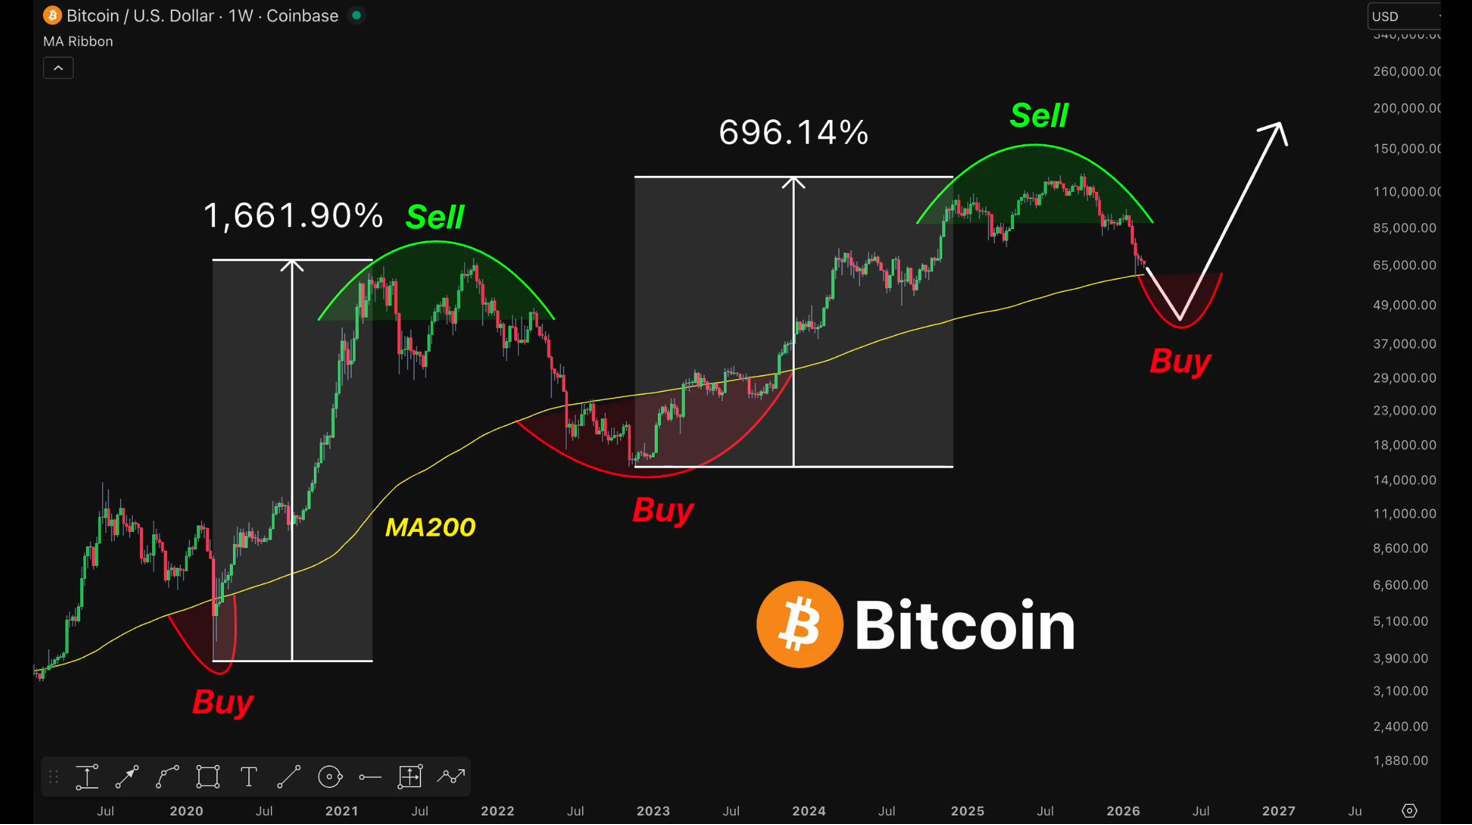
Why I Think BTC This Crypto Bull Cycle Has Already BegunFor months, the market felt exhausted.
Every bounce was sold.
Every breakout failed.
Confidence was thin.
But recently, the tone has shifted — not dramatically, not euphorically — just subtly and structurally. And that kind of shift is often how real bull cycles begin.
This doesn’t look like hype.
It looks like transition.
1. Structure Is Quietly Improving
In every major cycle, the change happens before the headlines catch up.
First, the lower lows stop printing.
Then higher lows begin forming.
Then pullbacks become shallower.
That’s what’s developing now.
Instead of cascading breakdowns, dips are getting absorbed faster. Volatility feels controlled rather than chaotic. The market isn’t collapsing on weakness — it’s stabilizing.
Structural resilience is the earliest bullish tell.
2. BTC Is Acting Like a Leader Again
Bitcoin doesn’t need vertical candles to signal strength.
Slow grinding accumulation is often more powerful than explosive rallies. When $BTC holds levels despite negative sentiment and reclaims key zones without euphoria, it suggests positioning — not speculation.
Bull markets often start in boredom.
Not excitement.
Right now feels more like silent positioning than retail mania.
3. Liquidity Is Slowly Returning
Crypto doesn’t move on hope.
It moves on liquidity.
We’re beginning to see capital rotate back into risk assets. Institutional participation is more measured, but it’s present. Long-term investors are engaging again.
Liquidity expansions always precede strong crypto cycles.
When money flows, crypto tends to amplify.
And the early flow signals are appearing.
4. Ethereum and Infrastructure Are Quietly Building
Ethereum doesn’t always lead loudly.
In past cycles, $ETH often lagged slightly before accelerating aggressively. Development activity remains consistent. On-chain engagement hasn’t collapsed.
Strong ecosystems build before price reacts.
That pattern looks familiar.
5. Altcoins Are Showing Selective Strength
Deep bear markets crush everything indiscriminately.
That’s not happening now.
We’re seeing selective rotation:
• AI-related projects
• Infrastructure protocols
• High-liquidity meme assets
Not everything is pumping — and that’s healthy.
Early bull phases reward selectivity, not chaos.
6. Sentiment Is Still Skeptical
This might be the strongest signal of all.
People are cautious.
Narratives are restrained.
Doubt dominates discussions.
True bull markets don’t begin with consensus optimism. They begin when most participants remain defensive.
When everyone agrees it’s bullish, the easy move is gone.
Right now, skepticism remains high — and that’s constructive.
7. On-Chain Behavior Is Supportive
Long-term holders aren’t distributing aggressively.
Supply isn’t flooding exchanges.
Coins are moving into stronger hands.
Selling pressure feels absorbed rather than expanding.
Tightening supply combined with gradual demand recovery creates sustainable conditions.
Not explosive — sustainable.
8. The Market Is Absorbing Bad News
In bear markets, negative headlines cause violent reactions.
Recently, bad news hasn’t triggered collapse. Price reacts — but doesn’t cascade.
That shift in reaction function matters.
Markets that absorb negativity tend to be transitioning upward.
Important Reality
This doesn’t mean straight-line gains.
Early bull cycles are messy:
• Choppy ranges
• Fake breakdowns
• Frustrating consolidations
They don’t feel obvious.
They feel confusing.
Only later do they become obvious in hindsight.
Why I Believe the Shift Is Underway
Because:
• Structure is stabilizing
• Liquidity is rotating
• Supply is tightening
• Sentiment remains skeptical
• Downside reactions are weakening
That alignment doesn’t guarantee parabolic upside tomorrow.
But it strongly resembles the early stages of past cycle transitions.
Bull markets don’t begin with fireworks.
They begin with subtle strength.
And right now, the market feels quietly strong.
That’s usually how the biggest moves start.
#Bitcoin #Ethereum #Crypto
{future}(BTCUSDT)
{future}(ETHUSDT)
Why I Think BTC This Crypto Bull Cycle Has Already Begun
For months, the market felt exhausted.
Every bounce was sold.
Every breakout failed.
Confidence was thin.
But recently, the tone has shifted — not dramatically, not euphorically — just subtly and structurally. And that kind of shift is often how real bull cycles begin.
This doesn’t look like hype.
It looks like transition.
1. Structure Is Quietly Improving
In every major cycle, the change happens before the headlines catch up.
First, the lower lows stop printing.
Then higher lows begin forming.
Then pullbacks become shallower.
That’s what’s developing now.
Instead of cascading breakdowns, dips are getting absorbed faster. Volatility feels controlled rather than chaotic. The market isn’t collapsing on weakness — it’s stabilizing.
Structural resilience is the earliest bullish tell.
2. BTC Is Acting Like a Leader Again
Bitcoin doesn’t need vertical candles to signal strength.
Slow grinding accumulation is often more powerful than explosive rallies. When $BTC holds levels despite negative sentiment and reclaims key zones without euphoria, it suggests positioning — not speculation.
Bull markets often start in boredom.
Not excitement.
Right now feels more like silent positioning than retail mania.
3. Liquidity Is Slowly Returning
Crypto doesn’t move on hope.
It moves on liquidity.
We’re beginning to see capital rotate back into risk assets. Institutional participation is more measured, but it’s present. Long-term investors are engaging again.
Liquidity expansions always precede strong crypto cycles.
When money flows, crypto tends to amplify.
And the early flow signals are appearing.
4. Ethereum and Infrastructure Are Quietly Building
Ethereum doesn’t always lead loudly.
In past cycles, $ETH often lagged slightly before accelerating aggressively. Development activity remains consistent. On-chain engagement hasn’t collapsed.
Strong ecosystems build before price reacts.
That pattern looks familiar.
5. Altcoins Are Showing Selective Strength
Deep bear markets crush everything indiscriminately.
That’s not happening now.
We’re seeing selective rotation:
• AI-related projects
• Infrastructure protocols
• High-liquidity meme assets
Not everything is pumping — and that’s healthy.
Early bull phases reward selectivity, not chaos.
6. Sentiment Is Still Skeptical
This might be the strongest signal of all.
People are cautious.
Narratives are restrained.
Doubt dominates discussions.
True bull markets don’t begin with consensus optimism. They begin when most participants remain defensive.
When everyone agrees it’s bullish, the easy move is gone.
Right now, skepticism remains high — and that’s constructive.
7. On-Chain Behavior Is Supportive
Long-term holders aren’t distributing aggressively.
Supply isn’t flooding exchanges.
Coins are moving into stronger hands.
Selling pressure feels absorbed rather than expanding.
Tightening supply combined with gradual demand recovery creates sustainable conditions.
Not explosive — sustainable.
8. The Market Is Absorbing Bad News
In bear markets, negative headlines cause violent reactions.
Recently, bad news hasn’t triggered collapse. Price reacts — but doesn’t cascade.
That shift in reaction function matters.
Markets that absorb negativity tend to be transitioning upward.
Important Reality
This doesn’t mean straight-line gains.
Early bull cycles are messy:
• Choppy ranges
• Fake breakdowns
• Frustrating consolidations
They don’t feel obvious.
They feel confusing.
Only later do they become obvious in hindsight.
Why I Believe the Shift Is Underway
Because:
• Structure is stabilizing
• Liquidity is rotating
• Supply is tightening
• Sentiment remains skeptical
• Downside reactions are weakening
That alignment doesn’t guarantee parabolic upside tomorrow.
But it strongly resembles the early stages of past cycle transitions.
Bull markets don’t begin with fireworks.
They begin with subtle strength.
And right now, the market feels quietly strong.
That’s usually how the biggest moves start.
#Bitcoin #Ethereum #Crypto
Every bounce was sold.
Every breakout failed.
Confidence was thin.
But recently, the tone has shifted — not dramatically, not euphorically — just subtly and structurally. And that kind of shift is often how real bull cycles begin.
This doesn’t look like hype.
It looks like transition.
1. Structure Is Quietly Improving
In every major cycle, the change happens before the headlines catch up.
First, the lower lows stop printing.
Then higher lows begin forming.
Then pullbacks become shallower.
That’s what’s developing now.
Instead of cascading breakdowns, dips are getting absorbed faster. Volatility feels controlled rather than chaotic. The market isn’t collapsing on weakness — it’s stabilizing.
Structural resilience is the earliest bullish tell.
2. BTC Is Acting Like a Leader Again
Bitcoin doesn’t need vertical candles to signal strength.
Slow grinding accumulation is often more powerful than explosive rallies. When $BTC holds levels despite negative sentiment and reclaims key zones without euphoria, it suggests positioning — not speculation.
Bull markets often start in boredom.
Not excitement.
Right now feels more like silent positioning than retail mania.
3. Liquidity Is Slowly Returning
Crypto doesn’t move on hope.
It moves on liquidity.
We’re beginning to see capital rotate back into risk assets. Institutional participation is more measured, but it’s present. Long-term investors are engaging again.
Liquidity expansions always precede strong crypto cycles.
When money flows, crypto tends to amplify.
And the early flow signals are appearing.
4. Ethereum and Infrastructure Are Quietly Building
Ethereum doesn’t always lead loudly.
In past cycles, $ETH often lagged slightly before accelerating aggressively. Development activity remains consistent. On-chain engagement hasn’t collapsed.
Strong ecosystems build before price reacts.
That pattern looks familiar.
5. Altcoins Are Showing Selective Strength
Deep bear markets crush everything indiscriminately.
That’s not happening now.
We’re seeing selective rotation:
• AI-related projects
• Infrastructure protocols
• High-liquidity meme assets
Not everything is pumping — and that’s healthy.
Early bull phases reward selectivity, not chaos.
6. Sentiment Is Still Skeptical
This might be the strongest signal of all.
People are cautious.
Narratives are restrained.
Doubt dominates discussions.
True bull markets don’t begin with consensus optimism. They begin when most participants remain defensive.
When everyone agrees it’s bullish, the easy move is gone.
Right now, skepticism remains high — and that’s constructive.
7. On-Chain Behavior Is Supportive
Long-term holders aren’t distributing aggressively.
Supply isn’t flooding exchanges.
Coins are moving into stronger hands.
Selling pressure feels absorbed rather than expanding.
Tightening supply combined with gradual demand recovery creates sustainable conditions.
Not explosive — sustainable.
8. The Market Is Absorbing Bad News
In bear markets, negative headlines cause violent reactions.
Recently, bad news hasn’t triggered collapse. Price reacts — but doesn’t cascade.
That shift in reaction function matters.
Markets that absorb negativity tend to be transitioning upward.
Important Reality
This doesn’t mean straight-line gains.
Early bull cycles are messy:
• Choppy ranges
• Fake breakdowns
• Frustrating consolidations
They don’t feel obvious.
They feel confusing.
Only later do they become obvious in hindsight.
Why I Believe the Shift Is Underway
Because:
• Structure is stabilizing
• Liquidity is rotating
• Supply is tightening
• Sentiment remains skeptical
• Downside reactions are weakening
That alignment doesn’t guarantee parabolic upside tomorrow.
But it strongly resembles the early stages of past cycle transitions.
Bull markets don’t begin with fireworks.
They begin with subtle strength.
And right now, the market feels quietly strong.
That’s usually how the biggest moves start.
#Bitcoin #Ethereum #Crypto
15
8
87
94.8k
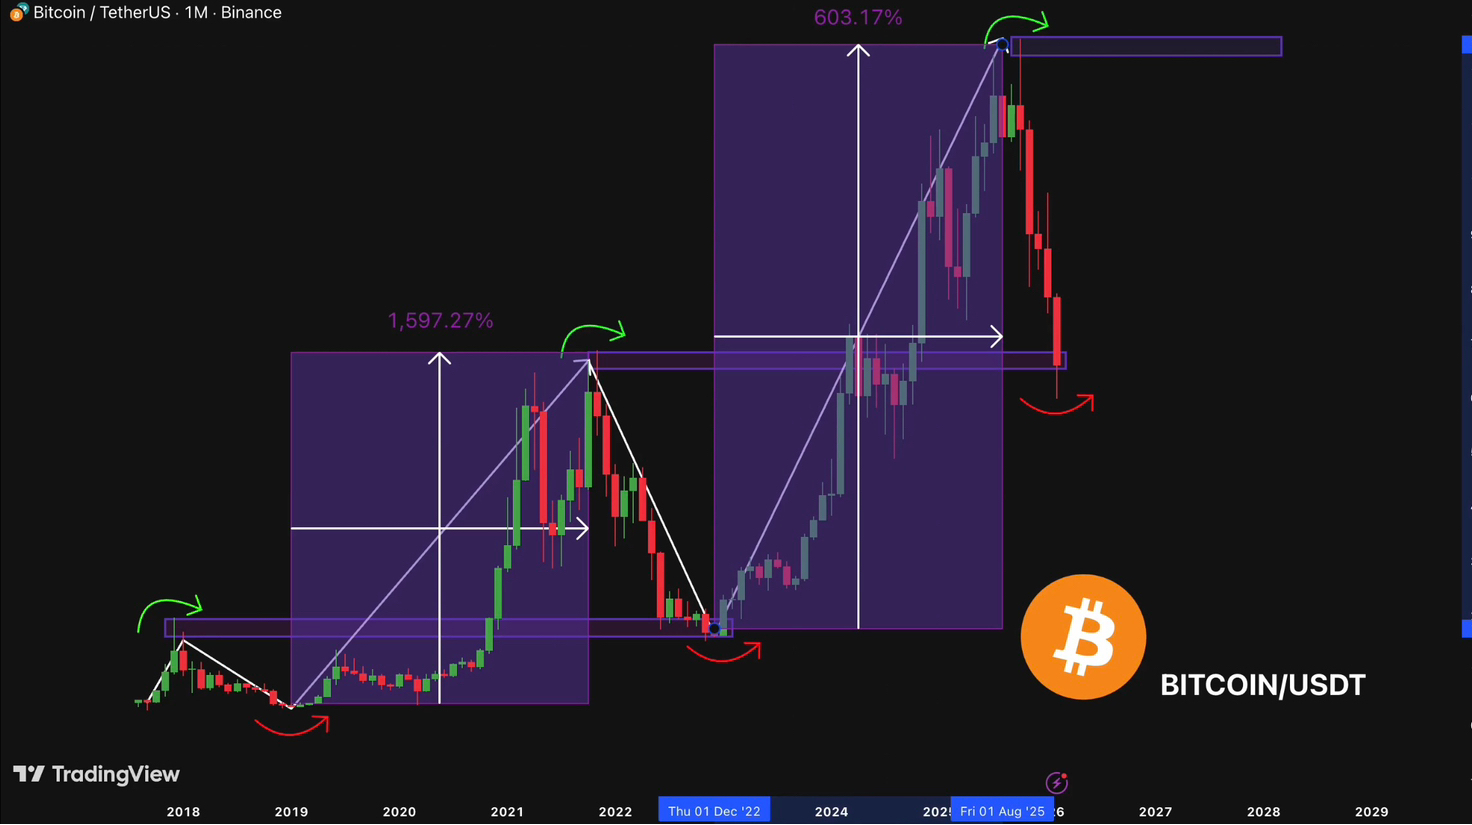
Artículo
BTC At Historical Production Cost ZoneThere’s a level on the chart that doesn’t get enough attention.
Not resistance.
Not a trendline.
Not a moving average.
Production cost.
Right now, Bitcoin is trading very close to its estimated average mining cost — the same economic zone that has quietly marked every major macro bottom in previous cycles.
And that’s not random.
Why Production Cost Matters
Production cost represents the real economic floor of the network.
When price approaches this zone:
➜ Miner profit margins compress
➜ Aggressive selling slows down
➜ Inefficient miners shut off
➜ Network sell pressure naturally declines
Mining is a business. When margins shrink, forced supply decreases over time. That supply contraction changes the balance between buyers and sellers.
Not overnight.
But structurally.
The Historical Pattern
Look back at prior cycle bottoms:
• 2015 → Bottom formed near production cost
• 2018 → Bottom aligned with mining cost compression
• 2022 → Price stabilized around the same economic floor
• 2026 → Price once again testing that zone
Every time price fell materially below production cost, it didn’t stay there long. Extended mining at a loss is unsustainable.
Eventually, equilibrium returns.
What Typically Follows
This zone doesn’t trigger instant rallies.
It usually triggers a process:
➜ Volatility contracts
➜ Sentiment deteriorates
➜ Weak hands exit
➜ Stronger capital accumulates
➜ Structure slowly rebuilds
Only later does expansion begin.
By the time momentum returns, the opportunity window is already smaller.
The Psychology of This Phase
This is where:
• Fear dominates narratives
• Analysts call for extreme lower targets
• Retail conviction collapses
• Long-term capital quietly positions
Production cost zones don’t feel bullish when they form.
They feel uncomfortable.
That discomfort is part of the structure.
Important Context
This level is not a guaranteed bottom.
Black swans can push price lower temporarily.
Macro shocks can distort cycles.
But historically, production cost has acted as a gravity zone — a place where downside risk compresses relative to long-term upside.
Markets don’t respect this area because of magic.
They respect it because it reflects real economic pressure inside the system.
When economics stabilize, structure stabilizes.
And when structure stabilizes, cycles reset.
History doesn’t repeat perfectly.
But the rhythm of supply economics has remained surprisingly consistent.
Smart capital isn’t reacting emotionally here.
It’s observing the cost floor.
And so far, $BTC is trading right on top of it.
$BTC #Bitcoin #Crypto
{future}(BTCUSDT)
BTC At Historical Production Cost Zone
There’s a level on the chart that doesn’t get enough attention.
Not resistance.
Not a trendline.
Not a moving average.
Production cost.
Right now, Bitcoin is trading very close to its estimated average mining cost — the same economic zone that has quietly marked every major macro bottom in previous cycles.
And that’s not random.
Why Production Cost Matters
Production cost represents the real economic floor of the network.
When price approaches this zone:
➜ Miner profit margins compress
➜ Aggressive selling slows down
➜ Inefficient miners shut off
➜ Network sell pressure naturally declines
Mining is a business. When margins shrink, forced supply decreases over time. That supply contraction changes the balance between buyers and sellers.
Not overnight.
But structurally.
The Historical Pattern
Look back at prior cycle bottoms:
• 2015 → Bottom formed near production cost
• 2018 → Bottom aligned with mining cost compression
• 2022 → Price stabilized around the same economic floor
• 2026 → Price once again testing that zone
Every time price fell materially below production cost, it didn’t stay there long. Extended mining at a loss is unsustainable.
Eventually, equilibrium returns.
What Typically Follows
This zone doesn’t trigger instant rallies.
It usually triggers a process:
➜ Volatility contracts
➜ Sentiment deteriorates
➜ Weak hands exit
➜ Stronger capital accumulates
➜ Structure slowly rebuilds
Only later does expansion begin.
By the time momentum returns, the opportunity window is already smaller.
The Psychology of This Phase
This is where:
• Fear dominates narratives
• Analysts call for extreme lower targets
• Retail conviction collapses
• Long-term capital quietly positions
Production cost zones don’t feel bullish when they form.
They feel uncomfortable.
That discomfort is part of the structure.
Important Context
This level is not a guaranteed bottom.
Black swans can push price lower temporarily.
Macro shocks can distort cycles.
But historically, production cost has acted as a gravity zone — a place where downside risk compresses relative to long-term upside.
Markets don’t respect this area because of magic.
They respect it because it reflects real economic pressure inside the system.
When economics stabilize, structure stabilizes.
And when structure stabilizes, cycles reset.
History doesn’t repeat perfectly.
But the rhythm of supply economics has remained surprisingly consistent.
Smart capital isn’t reacting emotionally here.
It’s observing the cost floor.
And so far, $BTC is trading right on top of it.
$BTC #Bitcoin #Crypto
Not resistance.
Not a trendline.
Not a moving average.
Production cost.
Right now, Bitcoin is trading very close to its estimated average mining cost — the same economic zone that has quietly marked every major macro bottom in previous cycles.
And that’s not random.
Why Production Cost Matters
Production cost represents the real economic floor of the network.
When price approaches this zone:
➜ Miner profit margins compress
➜ Aggressive selling slows down
➜ Inefficient miners shut off
➜ Network sell pressure naturally declines
Mining is a business. When margins shrink, forced supply decreases over time. That supply contraction changes the balance between buyers and sellers.
Not overnight.
But structurally.
The Historical Pattern
Look back at prior cycle bottoms:
• 2015 → Bottom formed near production cost
• 2018 → Bottom aligned with mining cost compression
• 2022 → Price stabilized around the same economic floor
• 2026 → Price once again testing that zone
Every time price fell materially below production cost, it didn’t stay there long. Extended mining at a loss is unsustainable.
Eventually, equilibrium returns.
What Typically Follows
This zone doesn’t trigger instant rallies.
It usually triggers a process:
➜ Volatility contracts
➜ Sentiment deteriorates
➜ Weak hands exit
➜ Stronger capital accumulates
➜ Structure slowly rebuilds
Only later does expansion begin.
By the time momentum returns, the opportunity window is already smaller.
The Psychology of This Phase
This is where:
• Fear dominates narratives
• Analysts call for extreme lower targets
• Retail conviction collapses
• Long-term capital quietly positions
Production cost zones don’t feel bullish when they form.
They feel uncomfortable.
That discomfort is part of the structure.
Important Context
This level is not a guaranteed bottom.
Black swans can push price lower temporarily.
Macro shocks can distort cycles.
But historically, production cost has acted as a gravity zone — a place where downside risk compresses relative to long-term upside.
Markets don’t respect this area because of magic.
They respect it because it reflects real economic pressure inside the system.
When economics stabilize, structure stabilizes.
And when structure stabilizes, cycles reset.
History doesn’t repeat perfectly.
But the rhythm of supply economics has remained surprisingly consistent.
Smart capital isn’t reacting emotionally here.
It’s observing the cost floor.
And so far, $BTC is trading right on top of it.
$BTC #Bitcoin #Crypto
2
2
14
14.7k
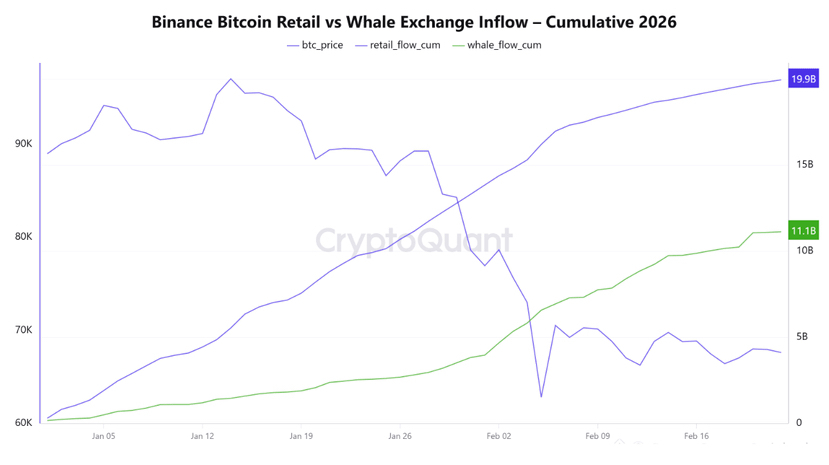
Artículo
Retail Bitcoin Inflows to Binance Hit $19.9B — What Does It Signal for $BTC?On-chain flow data is revealing a clear behavioral divergence between retail and large holders.
Since the beginning of 2026:
• Retail cumulative inflows: ~$19.94B
• Whale cumulative inflows: ~$11.13B
• Difference: ~$8.8B in favor of retail
That gap matters.
Why Retail Dominance in Inflows Is Important
When smaller holders move Bitcoin to exchanges, it often signals:
• Readiness to sell
• Position reshuffling
• Emotional reaction to volatility
• Short-term uncertainty
Exchange inflows are not automatically bearish — but when retail flows dominate while price remains sluggish near $67K, it suggests potential supply pressure building beneath the surface.
Retail typically reacts faster to fear and uncertainty.
Whales usually move slower — and more strategically.
What Are Whales Doing?
Although whale inflows are lower than retail, they have steadily increased beyond $11B.
This implies:
• Large players are not exiting aggressively
• Capital management is controlled
• Liquidity deployment is gradual
• No signs of panic distribution
Historically, markets become more volatile when retail activity outweighs whale positioning significantly. That imbalance often leads to short-term fragility.
The Broader Structural Context
Price hovering around $67K while retail inflows outpace whales suggests a rebalancing phase.
Two scenarios stand out:
If retail inflows continue rising without price expansion:
→ Increased probability of downside pressure
→ Supply overhang grows
→ Short-term volatility increases
If retail inflows slow and whales shift toward net withdrawals:
→ Supply tightens
→ Early structural accumulation signal
→ Potential trend stabilization
The Key Variable
This isn’t about inflows alone.
It’s about interaction between:
• Retail behavior
• Whale positioning
• Price reaction
• Liquidity depth
Markets bottom when weak hands exhaust.
They expand when stronger hands absorb.
Right now, retail is more active than whales.
The next shift in that relationship will likely define the next directional move.
$BTC #Bitcoin #Crypto
{future}(BTCUSDT)
Retail Bitcoin Inflows to Binance Hit $19.9B — What Does It Signal for $BTC?
On-chain flow data is revealing a clear behavioral divergence between retail and large holders.
Since the beginning of 2026:
• Retail cumulative inflows: ~$19.94B
• Whale cumulative inflows: ~$11.13B
• Difference: ~$8.8B in favor of retail
That gap matters.
Why Retail Dominance in Inflows Is Important
When smaller holders move Bitcoin to exchanges, it often signals:
• Readiness to sell
• Position reshuffling
• Emotional reaction to volatility
• Short-term uncertainty
Exchange inflows are not automatically bearish — but when retail flows dominate while price remains sluggish near $67K, it suggests potential supply pressure building beneath the surface.
Retail typically reacts faster to fear and uncertainty.
Whales usually move slower — and more strategically.
What Are Whales Doing?
Although whale inflows are lower than retail, they have steadily increased beyond $11B.
This implies:
• Large players are not exiting aggressively
• Capital management is controlled
• Liquidity deployment is gradual
• No signs of panic distribution
Historically, markets become more volatile when retail activity outweighs whale positioning significantly. That imbalance often leads to short-term fragility.
The Broader Structural Context
Price hovering around $67K while retail inflows outpace whales suggests a rebalancing phase.
Two scenarios stand out:
If retail inflows continue rising without price expansion:
→ Increased probability of downside pressure
→ Supply overhang grows
→ Short-term volatility increases
If retail inflows slow and whales shift toward net withdrawals:
→ Supply tightens
→ Early structural accumulation signal
→ Potential trend stabilization
The Key Variable
This isn’t about inflows alone.
It’s about interaction between:
• Retail behavior
• Whale positioning
• Price reaction
• Liquidity depth
Markets bottom when weak hands exhaust.
They expand when stronger hands absorb.
Right now, retail is more active than whales.
The next shift in that relationship will likely define the next directional move.
$BTC #Bitcoin #Crypto
Since the beginning of 2026:
• Retail cumulative inflows: ~$19.94B
• Whale cumulative inflows: ~$11.13B
• Difference: ~$8.8B in favor of retail
That gap matters.
Why Retail Dominance in Inflows Is Important
When smaller holders move Bitcoin to exchanges, it often signals:
• Readiness to sell
• Position reshuffling
• Emotional reaction to volatility
• Short-term uncertainty
Exchange inflows are not automatically bearish — but when retail flows dominate while price remains sluggish near $67K, it suggests potential supply pressure building beneath the surface.
Retail typically reacts faster to fear and uncertainty.
Whales usually move slower — and more strategically.
What Are Whales Doing?
Although whale inflows are lower than retail, they have steadily increased beyond $11B.
This implies:
• Large players are not exiting aggressively
• Capital management is controlled
• Liquidity deployment is gradual
• No signs of panic distribution
Historically, markets become more volatile when retail activity outweighs whale positioning significantly. That imbalance often leads to short-term fragility.
The Broader Structural Context
Price hovering around $67K while retail inflows outpace whales suggests a rebalancing phase.
Two scenarios stand out:
If retail inflows continue rising without price expansion:
→ Increased probability of downside pressure
→ Supply overhang grows
→ Short-term volatility increases
If retail inflows slow and whales shift toward net withdrawals:
→ Supply tightens
→ Early structural accumulation signal
→ Potential trend stabilization
The Key Variable
This isn’t about inflows alone.
It’s about interaction between:
• Retail behavior
• Whale positioning
• Price reaction
• Liquidity depth
Markets bottom when weak hands exhaust.
They expand when stronger hands absorb.
Right now, retail is more active than whales.
The next shift in that relationship will likely define the next directional move.
$BTC #Bitcoin #Crypto
1
1
5
12.9k
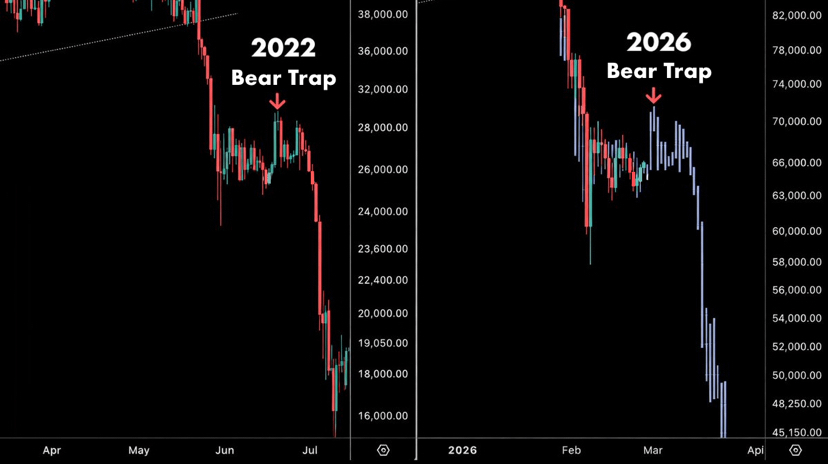
Artículo
BTC Capitulation Signal? $4B Exits Crypto FundsThe outflow streak continues.
Digital asset investment products just logged their fifth consecutive week of redemptions, with another $288 million pulled last week. That brings the five-week total to roughly $4.0 billion withdrawn.
On the surface, that looks like institutional retreat.
But the structure underneath matters more than the headline.
Liquidity Is Clearly Thinning
Trading volumes have dropped to around $17 billion, the lowest levels seen since mid-2025.
Lower volume means:
• Reduced conviction
• Fewer aggressive participants
• Thinner order books
• Higher sensitivity to shocks
When liquidity dries up, volatility doesn’t disappear — it becomes asymmetric.
What This Really Signals
This isn’t retail panic.
Retail typically reacts late and emotionally.
This is structured capital trimming exposure — likely driven by:
• Macro uncertainty
• Risk management mandates
• Portfolio rebalancing
• Dollar strength and rate expectations
Institutions don’t “panic sell.”
They de-risk systematically.
Capitulation — or Just Repricing?
True capitulation usually comes with:
• Explosive volatility
• Forced liquidations
• Panic-driven headlines
• One-sided positioning
What we’re seeing now is slower.
More controlled.
That suggests risk reduction, not collapse.
However, prolonged outflows create a vacuum.
If inflows don’t return, recovery attempts remain capped.
The Critical Variable
The key question isn’t whether $4B left.
It’s what happens next:
• Do outflows accelerate?
• Do flows stabilize and compress?
• Does price hold structural support despite weak demand?
If capital stabilizes and liquidity conditions improve, this phase could represent late-stage fatigue before reversal.
If macro pressure intensifies, it could evolve into a deeper uưnind.
Institutions stepping back doesn’t automatically mean the cycle is over.
But it does mean momentum won’t return until liquidity does.
Watch flows.
Watch structure.
Watch who steps in when volatility expands.
That’s where the real signal will appear.
$BTC #Bitcoin #Crypto
{future}(BTCUSDT)
BTC Capitulation Signal? $4B Exits Crypto Funds
The outflow streak continues.
Digital asset investment products just logged their fifth consecutive week of redemptions, with another $288 million pulled last week. That brings the five-week total to roughly $4.0 billion withdrawn.
On the surface, that looks like institutional retreat.
But the structure underneath matters more than the headline.
Liquidity Is Clearly Thinning
Trading volumes have dropped to around $17 billion, the lowest levels seen since mid-2025.
Lower volume means:
• Reduced conviction
• Fewer aggressive participants
• Thinner order books
• Higher sensitivity to shocks
When liquidity dries up, volatility doesn’t disappear — it becomes asymmetric.
What This Really Signals
This isn’t retail panic.
Retail typically reacts late and emotionally.
This is structured capital trimming exposure — likely driven by:
• Macro uncertainty
• Risk management mandates
• Portfolio rebalancing
• Dollar strength and rate expectations
Institutions don’t “panic sell.”
They de-risk systematically.
Capitulation — or Just Repricing?
True capitulation usually comes with:
• Explosive volatility
• Forced liquidations
• Panic-driven headlines
• One-sided positioning
What we’re seeing now is slower.
More controlled.
That suggests risk reduction, not collapse.
However, prolonged outflows create a vacuum.
If inflows don’t return, recovery attempts remain capped.
The Critical Variable
The key question isn’t whether $4B left.
It’s what happens next:
• Do outflows accelerate?
• Do flows stabilize and compress?
• Does price hold structural support despite weak demand?
If capital stabilizes and liquidity conditions improve, this phase could represent late-stage fatigue before reversal.
If macro pressure intensifies, it could evolve into a deeper uưnind.
Institutions stepping back doesn’t automatically mean the cycle is over.
But it does mean momentum won’t return until liquidity does.
Watch flows.
Watch structure.
Watch who steps in when volatility expands.
That’s where the real signal will appear.
$BTC #Bitcoin #Crypto
Digital asset investment products just logged their fifth consecutive week of redemptions, with another $288 million pulled last week. That brings the five-week total to roughly $4.0 billion withdrawn.
On the surface, that looks like institutional retreat.
But the structure underneath matters more than the headline.
Liquidity Is Clearly Thinning
Trading volumes have dropped to around $17 billion, the lowest levels seen since mid-2025.
Lower volume means:
• Reduced conviction
• Fewer aggressive participants
• Thinner order books
• Higher sensitivity to shocks
When liquidity dries up, volatility doesn’t disappear — it becomes asymmetric.
What This Really Signals
This isn’t retail panic.
Retail typically reacts late and emotionally.
This is structured capital trimming exposure — likely driven by:
• Macro uncertainty
• Risk management mandates
• Portfolio rebalancing
• Dollar strength and rate expectations
Institutions don’t “panic sell.”
They de-risk systematically.
Capitulation — or Just Repricing?
True capitulation usually comes with:
• Explosive volatility
• Forced liquidations
• Panic-driven headlines
• One-sided positioning
What we’re seeing now is slower.
More controlled.
That suggests risk reduction, not collapse.
However, prolonged outflows create a vacuum.
If inflows don’t return, recovery attempts remain capped.
The Critical Variable
The key question isn’t whether $4B left.
It’s what happens next:
• Do outflows accelerate?
• Do flows stabilize and compress?
• Does price hold structural support despite weak demand?
If capital stabilizes and liquidity conditions improve, this phase could represent late-stage fatigue before reversal.
If macro pressure intensifies, it could evolve into a deeper uưnind.
Institutions stepping back doesn’t automatically mean the cycle is over.
But it does mean momentum won’t return until liquidity does.
Watch flows.
Watch structure.
Watch who steps in when volatility expands.
That’s where the real signal will appear.
$BTC #Bitcoin #Crypto
1
2
13
11.6k
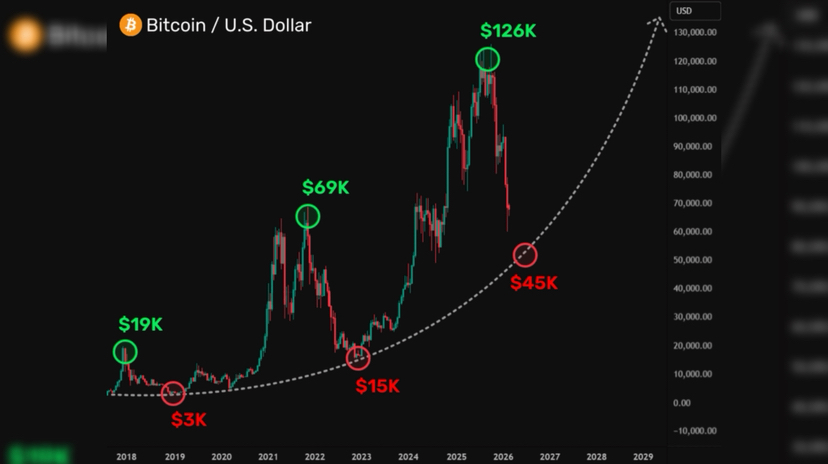
Artículo
BTC At a Reversal Threshold: Hold the Low, Open the Path to $70KNo matter how you frame it, the current $BTC structure still leans toward a constructive scenario. When I look at the chart, one thing stands out clearly: the market is behaving exactly how strong trends often behave before expansion.
First, it did what needed to be done — it swept liquidity.
Thin pockets below support were taken out. Leveraged longs were flushed. Weak hands were removed. What remains is cleaner structure and redistributed positioning. That kind of reset is often a prerequisite before a sustainable move higher.
Interestingly, instead of squeezing shorts immediately by pushing higher, the market chose to clear downside leverage first. To me, that signals prioritization — remove excess long exposure before attempting expansion.
The Bearish Argument Still Exists
From a purely technical standpoint, one could argue that the recent move resembles a breakdown from a bearish flag, with deeper targets — potentially even below $50,000.
But if that scenario plays out, price would be driven directly into major long-term support — zones where historical demand has reacted aggressively. For bears, pushing price that deep without a significant macro catalyst would likely be overextension at this stage.
The Key Variable: The Most Recent Low
Everything now hinges on how price closes and reacts around the recent low.
If that zone:
• Holds firmly
• Shows absorption
• Builds higher lows
• Compresses volatility
Then the entire recent move shifts from “breakdown” to “tight accumulation.”
And in that case, the path toward $70K — and potentially higher — opens naturally through structural expansion.
This is still a scenario, not certainty.
But markets rarely expand without first cleaning out excess positioning.
Right now, the structure suggests that process may already be underway.
Hold the low — build the base — target expansion.
$BTC #Bitcoin #Crypto
{future}(BTCUSDT)
BTC At a Reversal Threshold: Hold the Low, Open the Path to $70K
No matter how you frame it, the current $BTC structure still leans toward a constructive scenario. When I look at the chart, one thing stands out clearly: the market is behaving exactly how strong trends often behave before expansion.
First, it did what needed to be done — it swept liquidity.
Thin pockets below support were taken out. Leveraged longs were flushed. Weak hands were removed. What remains is cleaner structure and redistributed positioning. That kind of reset is often a prerequisite before a sustainable move higher.
Interestingly, instead of squeezing shorts immediately by pushing higher, the market chose to clear downside leverage first. To me, that signals prioritization — remove excess long exposure before attempting expansion.
The Bearish Argument Still Exists
From a purely technical standpoint, one could argue that the recent move resembles a breakdown from a bearish flag, with deeper targets — potentially even below $50,000.
But if that scenario plays out, price would be driven directly into major long-term support — zones where historical demand has reacted aggressively. For bears, pushing price that deep without a significant macro catalyst would likely be overextension at this stage.
The Key Variable: The Most Recent Low
Everything now hinges on how price closes and reacts around the recent low.
If that zone:
• Holds firmly
• Shows absorption
• Builds higher lows
• Compresses volatility
Then the entire recent move shifts from “breakdown” to “tight accumulation.”
And in that case, the path toward $70K — and potentially higher — opens naturally through structural expansion.
This is still a scenario, not certainty.
But markets rarely expand without first cleaning out excess positioning.
Right now, the structure suggests that process may already be underway.
Hold the low — build the base — target expansion.
$BTC #Bitcoin #Crypto
First, it did what needed to be done — it swept liquidity.
Thin pockets below support were taken out. Leveraged longs were flushed. Weak hands were removed. What remains is cleaner structure and redistributed positioning. That kind of reset is often a prerequisite before a sustainable move higher.
Interestingly, instead of squeezing shorts immediately by pushing higher, the market chose to clear downside leverage first. To me, that signals prioritization — remove excess long exposure before attempting expansion.
The Bearish Argument Still Exists
From a purely technical standpoint, one could argue that the recent move resembles a breakdown from a bearish flag, with deeper targets — potentially even below $50,000.
But if that scenario plays out, price would be driven directly into major long-term support — zones where historical demand has reacted aggressively. For bears, pushing price that deep without a significant macro catalyst would likely be overextension at this stage.
The Key Variable: The Most Recent Low
Everything now hinges on how price closes and reacts around the recent low.
If that zone:
• Holds firmly
• Shows absorption
• Builds higher lows
• Compresses volatility
Then the entire recent move shifts from “breakdown” to “tight accumulation.”
And in that case, the path toward $70K — and potentially higher — opens naturally through structural expansion.
This is still a scenario, not certainty.
But markets rarely expand without first cleaning out excess positioning.
Right now, the structure suggests that process may already be underway.
Hold the low — build the base — target expansion.
$BTC #Bitcoin #Crypto
5
3
56
55.2k
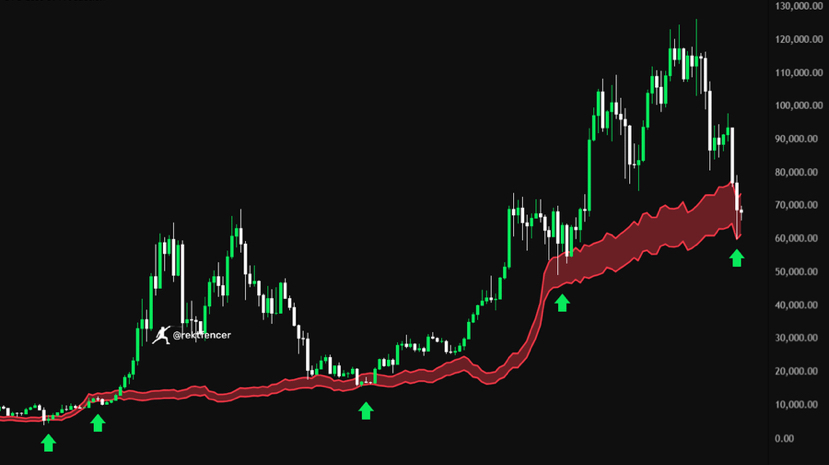
Artículo
BTC AI Shockwave: $52.6B Wiped From Cybersecurity in 48 HoursThe market doesn’t whisper.
It reprices.
After Anthropic introduced Claude Code Security, capital didn’t wait for earnings calls or analyst notes. It moved immediately — and violently.
In just two sessions, roughly $52.6 billion in market value evaporated across major cybersecurity names.
Here’s how the damage unfolded:
• CrowdStrike fell 20% (≈ -$19.6B)
• Cloudflare dropped 18.5% (≈ -$11.2B)
• Palo Alto Networks slid 8.9% (≈ -$11.7B)
• Zscaler sank 17.3%
• Okta declined 16.7%
• Infosys also saw sharp downside pressure
This wasn’t random volatility.
It was sector-wide repricing.
What’s the Market Afraid Of?
The core concern is structural disruption.
AI-native security platforms don’t just improve existing workflows — they potentially compress margins, automate response layers, and reduce dependency on legacy subscription models.
If AI can:
• Detect threats faster
• Write and audit secure code autonomously
• Replace layers of manual monitoring
Then traditional security architectures may face margin pressure.
Capital moves ahead of earnings impact.
Overreaction or Rotation?
Markets often overshoot in both directions.
But when $50B disappears in 48 hours, it’s rarely emotional noise alone.
It signals one of two things:
1. Short-term panic pricing
2. Early-stage capital rotation
If this is rotation, funds may begin reallocating toward AI-first security infrastructure rather than legacy providers.
That shift wouldn’t happen overnight — but valuation compression is often the first sign.
Why This Matters Beyond Stocks
AI disruption isn’t isolated to equities.
It influences:
• Venture funding flows
• Tech infrastructure narratives
• Crypto-AI sector positioning
• Institutional capital allocation
When capital rotates in public markets, private and digital markets often follow with a lag.
The Bigger Question
Is this just fear of a new tool?
Or is this the beginning of a structural repricing of cybersecurity economics?
When billions vanish that quickly, the market is adjusting assumptions — not just reacting to headlines.
The shockwave has started.
Now we watch where the capital goes next.
$BTC #Bitcoin #Crypto
{future}(BTCUSDT)
BTC AI Shockwave: $52.6B Wiped From Cybersecurity in 48 Hours
The market doesn’t whisper.
It reprices.
After Anthropic introduced Claude Code Security, capital didn’t wait for earnings calls or analyst notes. It moved immediately — and violently.
In just two sessions, roughly $52.6 billion in market value evaporated across major cybersecurity names.
Here’s how the damage unfolded:
• CrowdStrike fell 20% (≈ -$19.6B)
• Cloudflare dropped 18.5% (≈ -$11.2B)
• Palo Alto Networks slid 8.9% (≈ -$11.7B)
• Zscaler sank 17.3%
• Okta declined 16.7%
• Infosys also saw sharp downside pressure
This wasn’t random volatility.
It was sector-wide repricing.
What’s the Market Afraid Of?
The core concern is structural disruption.
AI-native security platforms don’t just improve existing workflows — they potentially compress margins, automate response layers, and reduce dependency on legacy subscription models.
If AI can:
• Detect threats faster
• Write and audit secure code autonomously
• Replace layers of manual monitoring
Then traditional security architectures may face margin pressure.
Capital moves ahead of earnings impact.
Overreaction or Rotation?
Markets often overshoot in both directions.
But when $50B disappears in 48 hours, it’s rarely emotional noise alone.
It signals one of two things:
1. Short-term panic pricing
2. Early-stage capital rotation
If this is rotation, funds may begin reallocating toward AI-first security infrastructure rather than legacy providers.
That shift wouldn’t happen overnight — but valuation compression is often the first sign.
Why This Matters Beyond Stocks
AI disruption isn’t isolated to equities.
It influences:
• Venture funding flows
• Tech infrastructure narratives
• Crypto-AI sector positioning
• Institutional capital allocation
When capital rotates in public markets, private and digital markets often follow with a lag.
The Bigger Question
Is this just fear of a new tool?
Or is this the beginning of a structural repricing of cybersecurity economics?
When billions vanish that quickly, the market is adjusting assumptions — not just reacting to headlines.
The shockwave has started.
Now we watch where the capital goes next.
$BTC #Bitcoin #Crypto
It reprices.
After Anthropic introduced Claude Code Security, capital didn’t wait for earnings calls or analyst notes. It moved immediately — and violently.
In just two sessions, roughly $52.6 billion in market value evaporated across major cybersecurity names.
Here’s how the damage unfolded:
• CrowdStrike fell 20% (≈ -$19.6B)
• Cloudflare dropped 18.5% (≈ -$11.2B)
• Palo Alto Networks slid 8.9% (≈ -$11.7B)
• Zscaler sank 17.3%
• Okta declined 16.7%
• Infosys also saw sharp downside pressure
This wasn’t random volatility.
It was sector-wide repricing.
What’s the Market Afraid Of?
The core concern is structural disruption.
AI-native security platforms don’t just improve existing workflows — they potentially compress margins, automate response layers, and reduce dependency on legacy subscription models.
If AI can:
• Detect threats faster
• Write and audit secure code autonomously
• Replace layers of manual monitoring
Then traditional security architectures may face margin pressure.
Capital moves ahead of earnings impact.
Overreaction or Rotation?
Markets often overshoot in both directions.
But when $50B disappears in 48 hours, it’s rarely emotional noise alone.
It signals one of two things:
1. Short-term panic pricing
2. Early-stage capital rotation
If this is rotation, funds may begin reallocating toward AI-first security infrastructure rather than legacy providers.
That shift wouldn’t happen overnight — but valuation compression is often the first sign.
Why This Matters Beyond Stocks
AI disruption isn’t isolated to equities.
It influences:
• Venture funding flows
• Tech infrastructure narratives
• Crypto-AI sector positioning
• Institutional capital allocation
When capital rotates in public markets, private and digital markets often follow with a lag.
The Bigger Question
Is this just fear of a new tool?
Or is this the beginning of a structural repricing of cybersecurity economics?
When billions vanish that quickly, the market is adjusting assumptions — not just reacting to headlines.
The shockwave has started.
Now we watch where the capital goes next.
$BTC #Bitcoin #Crypto
7
6.7k
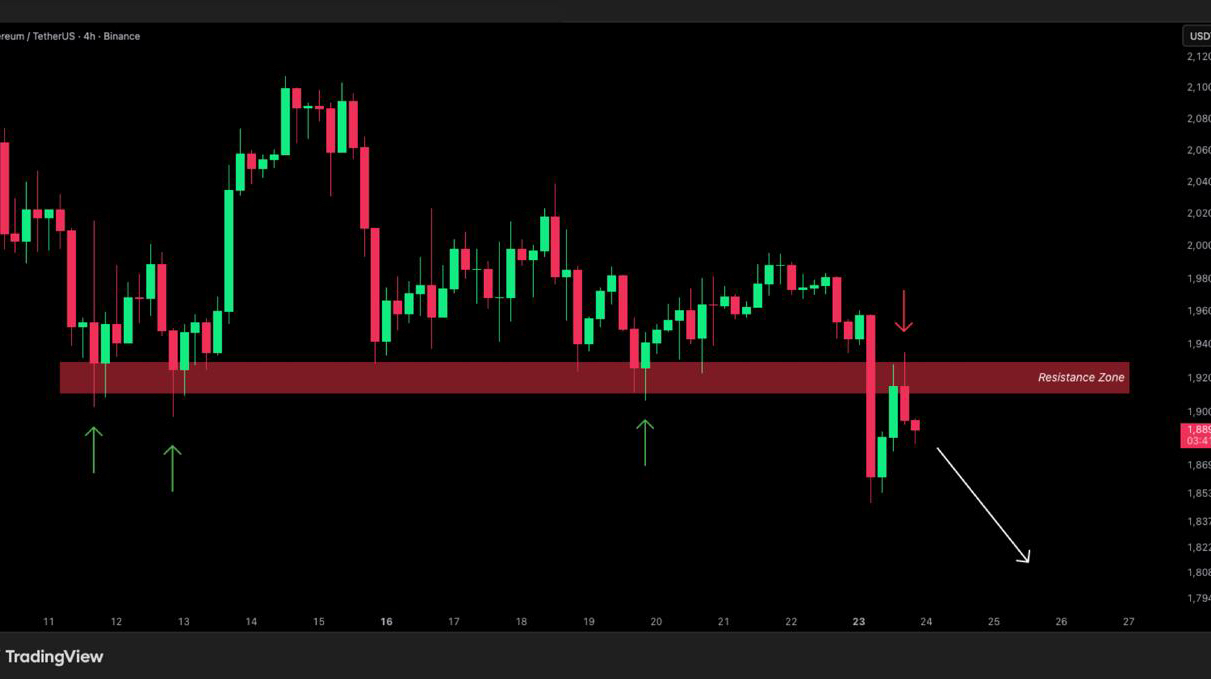
Artículo
ETH - Trade IdeaQuick short idea on .Price broke down from the support zone, and that level has now flipped into resistance.
Simple breakdown into a retest setup. If this rejection holds, it should push lower from here.
And with the Mexico cartel situation still unclear, headline risk is real, that uncertainty can keep pressure on price.
$ETH #Ethereum #Crypto
{future}(ETHUSDT)
ETH - Trade Idea
Quick short idea on .Price broke down from the support zone, and that level has now flipped into resistance.
Simple breakdown into a retest setup. If this rejection holds, it should push lower from here.
And with the Mexico cartel situation still unclear, headline risk is real, that uncertainty can keep pressure on price.
$ETH #Ethereum #Crypto
Simple breakdown into a retest setup. If this rejection holds, it should push lower from here.
And with the Mexico cartel situation still unclear, headline risk is real, that uncertainty can keep pressure on price.
$ETH #Ethereum #Crypto
11
6.8k
Inicia sesión para explorar más contenidos
Únete a usuarios globales de criptomonedas en Binance Square
⚡️ Obtén información útil y actualizada sobre criptos.
💬 Avalado por el mayor exchange de criptomonedas en el mundo.
👍 Descubre perspectivas reales de creadores verificados.
Email/número de teléfono
Temas populares
RussiaStartsLargeScaleDigitalRubleRolloutSep1
30,987 vistas
615 están debatiendo
Rusia lanza su rublo digital a gran escala desde septiembre, pero ¿qué significa que una moneda sea 'digital' en este contexto?
Una **CBDC (Central Bank Digital Currency)** es dinero fiat emitido directamente por un banco central en forma digital, como una versión electrónica del efectivo. A diferencia de las cripto descentralizadas, una CBDC está controlada por el gobierno: el emisor puede rastrear cada transacción, congelar fondos y programar reglas de gasto.
La diferencia clave con el dinero bancario tradicional (que ya es digital) es que la CBDC vive en el balance del banco central, no en bancos comerciales. Eso le da al estado control directo sobre la oferta y el flujo de dinero.
Muchos ven en las CBDC una amenaza a la privacidad financiera: cada compra quedaría registrada. Otros argumentan que mejoran la inclusión y reducen costos de transferencia. En países con controles de capital estrictos, como Rusia o China, las CBDC también facilitan la vigilancia económica.
Mientras gobiernos avanzan con dinero programable, Bitcoin sigue siendo la alternativa sin permisos. La tensión entre control centralizado y soberanía financiera individual nunca fue tan clara.
Seguinos para análisis de mercado y conceptos clave sin vueltas.
#RussiaStartsLargeScaleDigitalRubleRolloutSep1
ElShowdelTrading
·0 me gusta
·114 vistas
BitcoinUp23%InAugustOutperformingGoldAndStocks
38,819 vistas
954 están debatiendo
BitcoinHolds$78K
24,554 vistas
180 están debatiendo