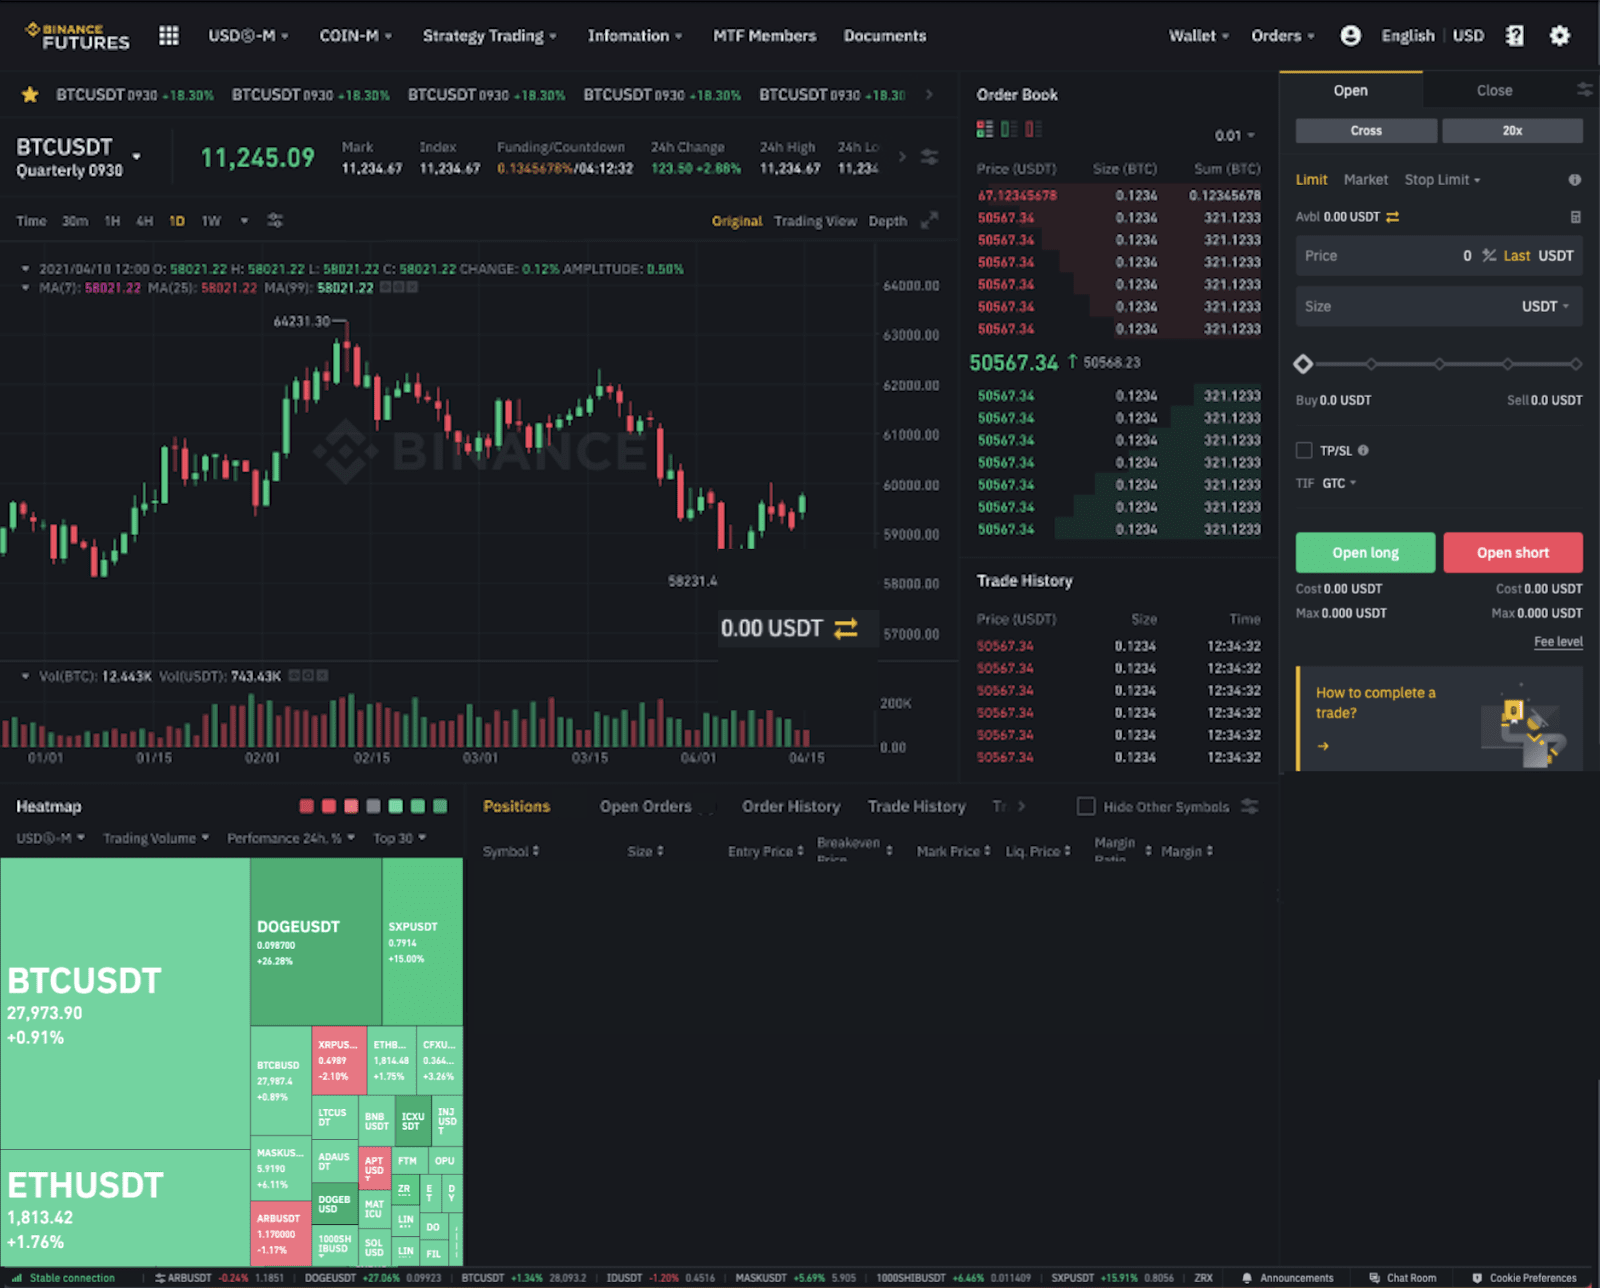
What is the Heatmap?
The Heatmap displays the performance of USDⓈ-M or COIN-M perpetual contracts in Binance Futures based on price changes or technical indicators. It shows real-time data in blocks that are automatically organized by different indicators. The blocks are constantly updated using a color scheme that reflects rising or declining trends.
What data is displayed in the Heatmap?
The Heatmap enables traders to quickly analyze the performance of USDⓈ-M or COIN-M Perpetual Contracts based on multiple indicators. These indicators are then organized in blocks and arranged under various categories, such as:
- “Trading Volume” organizes the blocks based on trading volume. The higher a perpetual contract’s trading volume, the bigger its block size.
- “24h Change” organizes the blocks based on the perpetual contract’s percentage change in the last 24 hours. The higher the percentage, the bigger the block size.
- “MarketCap” arranges the Heatmap based on market capitalization.
Inside these blocks, you can find market data related to the perpetual contracts, including:
- Trading pair
- Exchange rate; and
- Performance indicators.
By hovering over the blocks, you’ll be able to see additional information, such as trading volume and percentage change in the last 24 hours. If you click on the block, you’ll be redirected to the trading page of that USDⓈ-M or COIN-M perpetual contract. You can also view the contracts in groups, such as DeFi, Layer 1, and Layer 2.
Performance indicators
Performance indicators reflect the movement and performance of a cryptocurrency in different colors. There are several indicators available, such as:
Price Performance indicators
These indicators show the price movement of a cryptocurrency. Green represents soaring prices, red stands for declining prices, and gray means that prices have stayed the same within the time period.
- 0% = Gray
- 0 - 10% = Shade 1 green/red
- 11 - 20% = Shade 2 green/red
- 20%+ = Shade 3 green/red
You can choose the following Price Performance indicators:
- 1-hour performance change;
- 24-hour performance change;
- 1-week performance change;
- 1-month performance change.
RSI indicators
The relative strength index (RSI) is a momentum indicator used in technical analysis. RSI measures the speed and magnitude of an asset's recent price changes to evaluate overvalued or undervalued conditions in the price of that asset.
The RSI indicator points to overbought and oversold assets. Traditionally, an RSI reading of 70 or above indicates an overbought situation, whereas a reading of 30 or below indicates an oversold condition.
- RSI > 80: Deep red
- 80 ≥ RSI > 60: Red
- 60 ≥ RSI > 50: Light red
- 50: Gray
- 50 > RSI ≥ 40: Light green
- 40 > RSI ≥ 20: Green
- RSI < 20: Deep green
Note: When there is no RSI 14D data (the symbol is listed for less than 14 days), the symbol color will be gray, and there will be a double dash ("--") next to [RSI 14D] to indicate the absence of data.
Funding rates
Funding rates (FR) are periodic payments paid out to either long or short traders, based on the difference between perpetual contract markets and spot prices. Depending on the open position, a trader will either pay or receive funding.
- FR > 0.01: Deep Green
- 0.01 ≥ FR > 0.005: Green
- 0.005 ≥ FR > 0: Light Green
- FR = 0: Gray
- 0 > FR ≥ 0.005: Light Red
- -0.005 > FR ≥ -0.01: Red
- FR > -0.01: Deep Red
Asset volatility
Asset volatility shows the rate at which the price of an asset moves up and down. This indicator uses the standard deviation in the last 30 days to calculate the daily volatility of an asset
- Volatility > 7%: Dark Blue (shade 2)
- 7% ≥ Volatility > 5%: Dark Blue
- 5% ≥ Volatility > 3%: Blue (shade 2)
- 3% ≥ Volatility > 2%: Blue
- 2% ≥ Volatility > 1%: Light Blue (shade 2)
- 1% ≥ Volatility > 0%: Light Blue
- Volatility = 0%: Gray
How to access the Heatmap in Binance Futures?
1. Go to Binance Futures and click [Log In], or [Register] if you don’t have an account yet.

2. On the Binance Futures trading interface, click [Settings] and enable [Heatmap].

3. Scroll down to view the Heatmap.
4. You can use the filters to change the information displayed on the Heatmap. Click the arrow next to each box to customize your Heatmap:
- [Type]: Choose a contract;
- [Size by]: Choose how to organize the heatmap;
- [Indicator]: Choose a performance indicator;
- [Range]: Choose the number of contracts to display.

5. You can also view the Heatmap on the Futures Markets page.
